35
Examination of the Robustness of the Resilience
Scale Using Multigroup Analysis
Yasuhiro KOIKE
*1, Michiko ISHIDA
*2, Wataru IMURA
*3and
Maki WATANABE
*3(Accepted December 5, 2019)
Key words: resilience, multigroup analysis, robustness
Abstract
This study aimed to investigate the factor invariance and robustness of a resilience scale using multigroup analysis to allow for a relative comparison of models. Participants were 2568 high school students (male: 1211, female: 1357) in Japan. They answered the questionnaire about their respective general attributes (gender, grade) and the resilience scale. The resilience scale included 9 items and 3 factors (building relationship, overcome power, and breakthrough strength). To investigate whether the resilience scale responds appropriately to the participants in this study, a separate confirmatory factor analysis was conducted for each gender. After examining the construct validity of the resilience scale, a multigroup analysis was conducted for groups by gender. The multigroup analysis confirmed configural invariance, measurement invariance, weak factorial invariance, and strong factorial invariance. The results of the confirmatory factor analysis for each gender was a good fit. Configural invariance was adopted for multigroup analysis. The validity of interpreting resilience in male and female participants using the same model was established in this study. We expect that the current findings will help interpret gender differences in resilience in the field of mental health.
*1 Department of Rehabilitation, Faculty of Health Science and Technology, Kawasaki University of Medical Welfare, Kurashiki, 701-0193, Japan E-Mail: y.koike@mw.kawasaki-m.ac.jp
*2 Department of Nursing, Faculty of Nursing, Kawasaki University of Medical Welfare *3 Department of Occupational Therapy, Tamano Institute of Health and Human Services
1. Introduction
According to Erikson’s stages of psychosocial development, high school students are adolescents going through a sensitive period marked by the conflict of ego identity and role confusion1). It is a period of
confusion because of the high sensitivity to social and historical changes in the transition to adulthood2).
Furthermore, adolescence is said to be the period of "the second individuation process," developing mental separation from parents and independence3). Therefore, high school students tend to have low mental
health standards4) and usually feel stressed5). Currently, studies regarding stress experienced by minors
are frequently carried out6,7). These studies suggest that stress in high school is rooted in interpersonal
relationships. It is also well known that stress is related to mental issues and physical symptoms such as depression, anxiety, and anger. As resilience is the ability to overcome difficult events and grow, it is attracting attention as a means to deal with interpersonal stress. Ishida et al.8) define resilience as "not
a special ability, any generation can grow and maintain mental health even in stressful situations or recover in the maladaptive state". These authors developed a resilience scale for high school students, and verified its reliability and validity8). Preceding studies have revealed that resilience affects mental
health8), stress responses9), and coping behavior10). On the other hand, a gender difference has been found
in stress awareness and responses11,12); it is clear that women are more likely to recognize stress13-15). Thus,
resilience also varies according to gender. Moreover, gender differences in some specific resilience factors of junior high school students have been found16). However, it can be problematic to simply compare gender
differences without examining the factor validity of whether the phenomenon of the same content is measured by men and women. For instance, the case of factor structure is different for scales, a men’s scale and women’s scale should not be compared because they have different factor properties.
In psychological studies applying questionnaires, the validity of structural concepts and the robustness of the questionnaire are important. Especially, when using the same scale to measure differences in distinct populations, such as differences between men and women, it is important to examine the robustness of the scale. As a method for examining the robustness of a scale, a method using item response theory17)
or comparing different models by simultaneously estimating different populations is recommended18). By
examining gender difference in the resilience scale, the validity of the scale can be improved. It also makes it possible to more appropriately understand the resilience of high school students, and to interpret these findings and offer appropriate support while keeping gender differences in mind. Additionally, it allows the examination of various causal relationship models.
As a study using multigroup analysis on a resilience scale, Ishida et al.19) clarified that the factor structural
models of the resilience scale are factor invariant without being affected by gender. However, their method of maximum likelihood is adopted as an estimation method. These results remain questionable because such a method is effective on an interval scale with a sufficient sample. Furthermore, only each model fit is separately examined, a relative comparison of each model is not provided. Therefore, it is not possible to examine the model in which the interpretation is really valid. To confirm the interpretation of real validity, it is appropriate to compare each model relatively in multigroup analysis.
This study aimed to check the factor invariance and the robustness of a resilience scale using multigroup analysis in a form that allows relative comparison of models. We hypothesized that if the robustness of the resilience scale was demonstrated as a result of this study, this scale will be more effective as a scale for resilience, and various causal relationships can be empirically examined.
2. Methods
2.1 Participants
The participants were 2667 high school students who attended two ordinary high schools in Japan. Participants were informed of the research purpose and consent was obtained. Of the total participants, 1250 were male and 1390 female, 751 first year students, 957 second year students, and 933 third year students.
2.2 Procedures
The survey consisted of an anonymous questionnaire asking for participants’ general information (such as gender and grade) and the resilience scale19). The distribution and collection of questionnaires was carried
out by the teachers, and ethical procedures and consent were also obtained at this time. A check box for consent was inserted in the questionnaires, and only questionnaires with a checked consent box were included in the analysis.
2.3 Materials
The resilience scale measures high school students’ resilience in three factors: building relationship (3 items), overcome power (3 items), and breakthrough strength (3 items). Responses to the resilience scale are distributed in "Not applicable at all: 0 points," "Not very much applicable: 1 point," "Nothing can be said:
2 points," "Slightly applicable: 3 points," "Entirely applicable: 4 points." The high score of the resilience scale means high resilience, and the resilience scale has been examined for reliability and validity among high school students.
2.4 Analysis
First, to confirm whether the resilience scale responded adequately to the participants of this study, a confirmatory factor analysis by gender was performed. This process is necessary to confirm that the questionnaire used in the survey is sufficiently responsive to the study and is important for increasing the validity of the study, and it is a commonly used method20,21) used to more adequately generalize the
results. In addition, to perform multigroup analysis, and it is necessary to confirm whether the resilience scale is appropriately responding for both men and women. Therefore, a confirmatory factor analysis was performed by gender in this study. The estimation method in confirmatory factor analysis adopts the robust weighted least square method (WLSMV) and Root Mean Square Error of Approximation (RMSEA); Comparative Fit Index (CFI), and Tucker-Lewis Index (TLI) were referenced for model fit. The model fit is a value that determines how well the hypothetical model matches the observational data. Generally, if RMSEA is 0.1 or less and CFI and TLI are 0.9 or more, the fit is said to be good22).
Second, in order to examine factor invariance of the resilience scale, a multigroup analysis was performed by gender grouping. Multigroup analysis is a method for testing whether the same factor is reproduced in two different populations23). Therefore, it is possible to check the difference in the composition concept of
each group. In multi-group simultaneous analysis, the model structure for each group is compared to the mean value of the factors, and the fitness of the model for each group is determined. After that, the model is classified as a "configural invariance model," "measurement invariance model," "weak factor invariance model," or a "strong factor invariance model." After confirming the χ2 value, degrees of freedom, RMSEA,
and CFI of each model, Akaike Information Criterion (AIC), Bayesian Information Criterion (BIC), and Sample Size Adjusted BIC (S-BIC) were compared to determine the suitability of model fit. M-plus ver. 8.2 was used for all statistical analysis.
2.5 Ethical considerations
Ethical considerations such as the purpose of the research, contents, method and anonymity were clearly stated in the questionnaire, and the participant was asked to cooperate in the questionnaire after the verbal explanation of the teacher in charge. It was explained that data were processed statistically and thus individuals were not identified, also that participation was voluntary and not participating would not incur in any disadvantages. This study was conducted with the approval of the ethics committee of Kawasaki University of Medical Welfare.
3. Results
3.1 Participants
Of the 2667 participants studied, 2568 respondents who had replies and no missing responses (effective response rate 96.3%) were included in the survey. The breakdown of the participants was 1211 men and 1357 women, and the grades were 737 first years, 938 second years, and 891 third years students. Table 1 shows the average score and standard deviation of each factor for males and females.
Table 1 The average score of each factor by gender
Building relationships Overcoming power Breakthrough strength
Male 9.2 ± 3.5 10.3 ± 2.8 9.8 ± 3.1
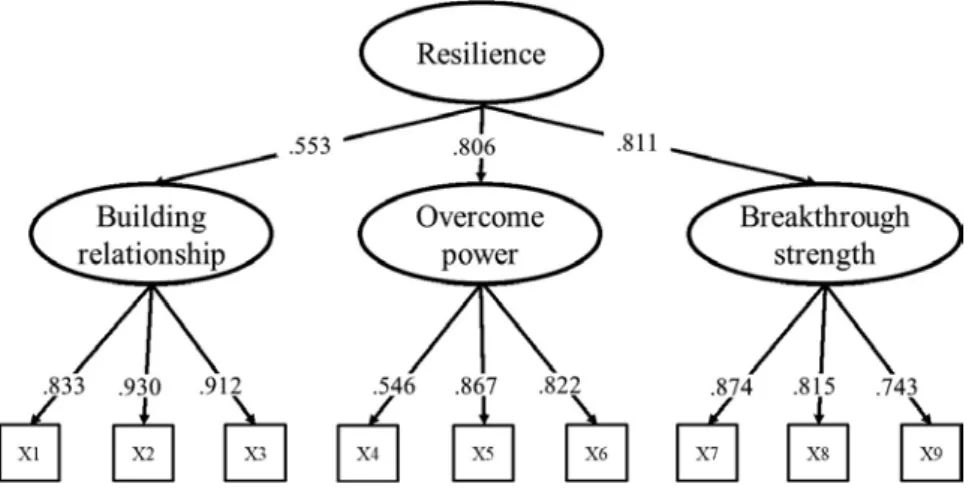
Figure 1 The results of confirmatory factor analysis in men RMSEA: 0.074, CFI: 0.993, TLI: 0.990
Figure 2 The results of confirmatory factor analysis in women RMSEA: 0.068, CFI: 0.992, TLI: 0.989
3.2 Validity of resilience scale
Figures 1 and 2 show the results of the confirmatory factor analysis. The goodness of fit index for men was RMSEA = 0.074, CFI = 0.993, TLI = 0.990, and the fitness index for women was RMSEA = 0.068, CFI = 0.992, TLI = 0.989. Both showed good fit, and the validity of using the resilience scale in this study was confirmed.
3.3 Factor invariance of resilience scale
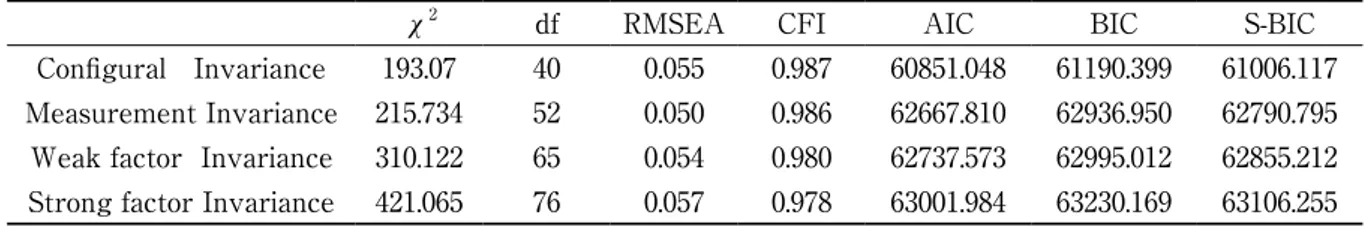
To examine the factor invariance of the resilience scale, multigroup analysis was performed by gender grouping. Table 1 shows the result of multigroup analysis. All models showed good values for the goodness of fit index. As a result of relative evaluation of AIC, BIC, and S-BIC, interpretation by the configural invariance model was valid.
4. Discussion
verified its robustness using multi-group simultaneous analysis. Thus, factor invariance in the resilience scale was confirmed.
First, in examining factor invariance of the resilience scale, WLSMV was used for parameter estimation. WLSMV is a robust estimation method that is used on an ordinal scale and corrects standard errors according to data distribution. In selecting the model, AIC, BIC, and S-BIC were used as information criterion. These criteria are not only for the degree of fit between data and model, but also for selecting a model that does not have a relatively large number of parameters and is able to match the data. In addition, analyses using structural equation modeling usually require about 200 samples24), and the current analysis
method and the number of samples were appropriate.
Second, in this study, prior to the examination of factor invariance in the resilience scale, a confirmatory factor analysis was performed to confirm that the resilience scale responded appropriately to the participants of this study. As a result, it was confirmed that the resilience scale responded appropriately for each sample grouped by gender. Okabayashi states that quantitative comparisons are possible only when the equivalence of constructs are proved by a confirmatory factor analysis25). In this study, confirmation of
the equivalence of the resilience constructs in the two samples helped improve the validity and reliability of the subsequent analysis.
Third, as a result of verifying factor invariance on the resilience scale using simultaneous analysis of multiple populations, a configural invariance model was adopted. In multigroup analysis, each model structure is compared with the mean value of the factors23), and equality constraints are applied to model
parameters incrementally. After that, information criteria for each model were relatively compared. The configural invariant model assumed the same model structure for each sample, possibly because the estimated values such as factor loadings were all different24). In other words, resilience can be interpreted
by a secondary factor model with a three-factor structure of "building relationships," "overcoming power," and "breakthrough strength," even though the estimated values such as factor loading differ for men and women. In the previous Ishida study, the factor loading of the first and second factors, the residual variance of each questionnaire item and the residual variance of the first factor in the male and female model structure with equality constraints showed suitable fitness. However, although the suitability-of-fit index satisfies the criteria, the suitability-of-fit index decreases as the equality constraint is applied, and the true model cannot be interpreted. In the current study, information criteria was evaluated relatively and the configural invariant model was adopted.
Multigroup analysis is one of the most effective methods for confirming the factor invariance of the scale when the same model structure is assumed in multiple populations26). Clarification of factor invariance
makes it possible to properly capture the concept that the scale is trying to measure, thereby empirically revealing the relationship between concepts. Because of the results of this study, in future resilience research it can be possible to appropriately grasp the concept of resilience without being influenced by the gender differences of participants or single-sex education differences.
One limitation of this study was that the target sample was limited to two high schools in Japan. It can be predicted that resilience will vary culturally and socially, and additional surveys will be needed even
Table 2 The results of multigroup analysis
χ2 df RMSEA CFI AIC BIC S-BIC
Configural Invariance 193.07 40 0.055 0.987 60851.048 61190.399 61006.117 Measurement Invariance 215.734 52 0.050 0.986 62667.810 62936.950 62790.795 Weak factor Invariance 310.122 65 0.054 0.980 62737.573 62995.012 62855.212 Strong factor Invariance 421.065 76 0.057 0.978 63001.984 63230.169 63106.255
df: degree of freedom; AIC: Akaike Information Criterion; BIC: Bayesian Information Criterion; S-BIC: Sample-size adjusted Bayesian Information Criterion
in different groups in the future. In addition, for future applications of the scale, it will be a challenge to conduct research to increase the robustness of the scale by calculating invariance of factors, the relationship with stress and to calculate cut-off values. Furthermore, since the reliability and validity of the resilience scale were examined only with high school students, we would like to explore the possibility of diversion to adults and the elderly and expand the scope of use of the scale.
Acknowledgements
This study was supported by JSPS KAKENHI Grant Number JP17K12579. There are no COI-related companies that need to be disclosed by the authors.
References
1. Erikson H : Identity and the life cycle: Selected papers. International Universities Press, New York, 1959. 2. Endo T : Psychology of identity. Nakanishiya Shuppan, Kyoto, 1981. (In Japanese, translated by the author
of this article)
3. Blos P : On adolescence: A psychoanalytic interpretation. Free Press, New York, 1962.
4. Kandel D and Davies M : Epidemiology of depressive mood in adolescents: An empirical study. Archives
of General Psychiatry, 39(10), 1205-1212, 1982.
5. Arnett J : Adolescent storm and stress, reconsidered: American Psychologist, 54(5), 317-326, 1999.
6. Ohsako H : Diversity and effectiveness of high school students’ stress-coping depending on situations.
The Japanese Journal of Health Psychology, 7(1), 26-34, 1994. (In Japanese with English abstract)
7. Miura M and Agari I : Psychological stress model in relationship among friends in junior high school students. The Japanese Journal of Health Psychology, 15(1), 1-9, 2002. (In Japanese with English abstract) 8. Ishida M, Imura W and Watanabe M : Correlations between high school student resilience and mental
health. Japanese Journal of School Health, 59(5), 333-340, 2017. (In Japanese with English abstract)
9. Yamashita M, Amasa K and Makono K : The effect of psychological stress reduction of the resilience.
The Japan Academy of Psychiatric and Mental Health Nursing, 20(2), 11-20, 2011. (In Japanese with English
abstract)
10. Hattori Y, Hattori Y, Muramatu T, Ishida A, Hiro M, Hiro N, Hirano Y, Fuji1 S, Okamoto M, and Muramatsu S : Differences in interpersonal stress events and stress coping behavior related to high and low levels of resilience among high school students. Journal of Sport Sciences and Osteopathic Therapy, 15(3), 159-169, 2014. (In Japanese with English abstract)
11. Yoshihara H and Fujiu H : The examination of gender differences in the relationship between subjective school stressor and stress response and/or friendships of high school students. Journal for the Science of
Schooling, 12, 83-92, 2011. (In Japanese with English abstract)
12. Izawa S, Nakamura-Taira N, Yamada H, Yamada K and Haratani T : Development of a measure to assess stress underestimation belief. The Japanese Journal of Psychology, 84(1), 57-63, 2013.
13. Miura M and Kawaoka F : Development of a school stressor scale for high school students. Japanese
Journal of Counseling Science, 41, 73-83, 2008. (In Japanese with English abstract)
14. Minegishi Y, Uehara N, Sato M, Sawame A and Shido K : Depression tendency of new students and related factors. Journal of School of Nursing and Social Services, Health Sciences University of Hokkaido, 9(1), 141-154, 2013. (In Japanese, translated by the author of this article)
15. Fukuoka Y : Correlation between providing social support for close friends experiencing everyday stress and the provider’s mood states. Kawasaki Medical Welfare Journal, 25(1), 175-182, 2015.
16. Ishige M and Muto T : Resilience and personality traits in junior high school students. The Japanese
Journal of Personality, 14(3), 266-280, 2006. (In Japanese with English abstract)
17. Toyoda H : Item response theory(Introduction): Test and measurement science. Asakura Shoten, Tokyo, 2012. (In Japanese, translated by the author of this article)
analysis. Gendai Sugakusya, Kyoto, 2007. (In Japanese, translated by the author of this article)
19. Ishida M, Yamagata M, Watanabe M and Imura W : Factorial invariance of "Resilience Scale". International
Nursing Care Research, 16(4), 1-9, 2017.
20. Teraoka M and Kyougoku : Analysis of structural relationship among the occupational dysfunction on the psychological problem in healthcare workers: A study using structural equation modeling. Peer J, 3, e1389, 2015.
21. Sano N, Kyougoku M and Teraoka M : Effect of achievement motive for community-dwelling elderly persons on social participation and HR-QOL. Sogo Rehabilitation, 43(8), 765-772, 2015. (In Japanese with English abstract)
22. Oshio A : First covariance structure analysis: Path analysis with Amos. Tokyo Tosho, Tokyo, 2008. (In Japanese, translated by the author of this article)
23. Kosugi K and Shimizu Y : Introduction to structural equation modeling with M-plus and R. Kitaooji Shobo, Kyoto, 2014. (In Japanese, translated by the author of this article)
24. Toyoda H : Stumbling and coping. In Shojima K, Iizuka H, Ozaki K, Murohashi H, Yonemura D, Saito A, Nakamura K, Kawahashi I, Shinohara M and Matsumoto H eds, Covariance structure analysis question edition: Covariance structure legal formula modeling. Asakura Shoten, Tokyo, 2003. (In Japanese, translated by the author of this article)
25. Okabayashi H : Problems in developmental research and new analytical methods for longitudinal data.
The Japanese Journal of Personality, 15(1), 76-86, 2006. (In Japanese with English abstract)