九州大学学術情報リポジトリ
Kyushu University Institutional Repository
好熱性藍藻の光化学系I膜複合体の安定化剤の検索と その特徴
松本, 和也
九州大学大学院生物資源環境科学府
https://doi.org/10.15017/21693
出版情報:Kyushu University, 2011, 博士(農学), 課程博士 バージョン:
権利関係:
Screening and characterization of materials for stabilization of photosystem I membrane complex
from a thermophilic cyanobacterium
Kazuya Matsumoto
2012
Table of contents
Abbreviations --- 3
General introduction --- 4
Chapter 1 Peptide surfactants for stabilization of functional photosystem I membrane complex in aqueous solution 1.1 Abstract --- 6
1.2 Introduction --- 8
1.3 Materials and methods --- 10
1.4 Results and discussion --- 19
Chapter 2 Enhancement of the electron transfer activity on photosystem I by cationic polypeptide surfactants in aqueous solution 2.1 Abstract --- 44
2.2 Introduction --- 46
2.3 Materials and methods --- 47
2.4 Results and discussion --- 50
General conclusions --- 61
Publications --- 62
Acknowledgements --- 63
References --- 65
Abbreviations
PS-I, Photosystem I
DDM, n-Dodecyl-β-D-maltopyranoside FC-14, Fos-choline-14
DG, Digitonin
PG, 1,2-Dioleoyl-sn-glycero-3-phospho-(1'-rac-glycerol) sodium salt CMC, Critical micelle concentration
DLS, Dynamic light scattering AFM, Atomic force microscopy MV, Methyl viologen
DCIP, 2,6-Dichloroindophenol
DCMU, 3-(3’,4’-Dichlorophenyl)-1,1-dimethylurea CF, 5(6)-Carboxyfluorescein
General introduction
For sustainable society, it is required to supply more clean energy including photovoltaics, bio-fuels, bio-diesel, hydrogen gas and so on. The photosynthesis is the conversion of light energy into chemical energy. This reaction is carried out by the absorption of solar photons in two serial photosynthetic electrontransport reaction centers called as photosystem I and II (PS-I and PS-II, respectively) (1, 2). The PS-II complex photooxidizes water to molecular oxygen, and the PS-I complex photoreduces NADP+ to NADPH. PS-I is a thylakoid transmembrane protein complex. In order to utilize the intense photocatalytic properties of PS-I for the energy production, vigorous active researches have been carried out (3-8).
The crystal structure of PS-I from the thermophilic cyanobacterium Thermosynechoccus elongatus was solved by Jordan et al (9). The trimeric protein
complex has a molecular mass of 1.07 MDa and consists of 36 proteins to which 381 co-factors are non-covalently attached. Each monomer of the polymeric complex consists of 12 proteins and 9 of these proteins per monomer feature a network of 34 transmembrane α-helices (for a total of 102 helices in the trimer) that are buried within the lipid bilayer. The large number of transmembrane helices and extensive interactions
with the thylakoid membranes have been problematic in developing protocols for the efficient purification, solubilization and crystallization of the native PS-I super-complex, complete with its associated antenna pigments and co-factors.
For efficient production of energy, photosynthetic complexes might offer attractive architecture for future generation of circuitry where molecular components are organized by a macromolecular scaffold. However, like other complex structure of proteins, PS-I is also soft materials, which is optimized for operation in a lipid bilayer interface between aqueous solutions. For preservation of protein conformation and maintenance or even increase of its activity in solution during reaction, stabilization of multi-protein complex is pivotal.
Thus, in this thesis I studied the stabilization and activation of multi-protein complex by various oligo-peptides and poly-amino acids, and their mechanism on stabilization and activity enhancement.
Chapter 1
Peptide surfactants for stabilization of functional photosystem I membrane complex in aqueous solution
Abstract
Photosystem I (PS-I) is a transmembrane complex in thylakoid. PS-I harvests and converts the light energy to chemical energy efficiently. In order to apply PS-I to photochemical and photovoltaic devices, stabilization of the PS-I and enhancement of its activity is required. For this purpose, several amphiphilic peptide molecules consisting of 6 hydrophobic and one or two hydrophilic amino acids were used for analyses of stabilizing activity. The amphiphilic peptide molecules are known to have mild surfactant activity and controllable interaction with protein. In this chapter, comprehensive analyses of stabilization activity on PS-I complex molecules by a new class of surfactant peptides were carried out. As the results, surfactant peptides like ac-I6K2-NH2, ac-A6K-NH2, ac-V6K2-NH2, and ac-V6R2-NH2, were found to effectively stabilize and increase the PS-I activity. In comparison with the conventionally used chemical detergents, the
amphiphilicity of the surfactant peptides is necessary but not sufficient for stabilization of active PS-I form. Unexpectedly, the cationic surfactant peptides markedly increased and the level of PS-I activity was 10 times higher than that of conventional detergents such as Triton X-100 and n-dodecyl-β-D-maltopyranoside. In contrast, anionic and neutral surfactant peptides indicate no effect on PS-I activity.
Introduction
To date, many attempts for stabilization or enhancement of membrane protein complexes have been developed and positive effect has been found by the addition of sugars (10), lipids (11), chemical detergents (12-14), alcohols (15), peptides (16-19), proteins (20), polysaccharides (20), and synthetic polymers (21). However, the efficient chemical molecules for stabilization of PS-I membrane complexes have not been discovered in the previous research. Our understanding of the interaction between additives and proteins is still limited and up to date the choice of a detergent is purely empirical.
Surfactant peptides are developed to mimic phospholipids and control the interaction between peptides and membrane proteins by their amino acid sequence (22, 23). The surfactant peptides consisted of 6 hydrophobic and one or two hydrophilic amino acids. Zhang and his coworkers have previously shown that specifically sequenced peptides stabilized PS-I complex from spinach (24, 25). the integral membrane glycerol-3-phosphate dehydrogenase (GlpD) from Escherichia coli (26), NADH peroxidase (Npx) from Enterococcus casseliflavus (26) and the G-protein coupled receptor (GPCR) bovine rhodopsin (27) more effectively compared with commercially
available detergents. In the case of spinach PS-I complex, ac-A6K-NH2 and ac-V6D-OH were tested and ac-A6K-NH2 was found to show better stabilization effect than ac-V6D-OH.
In this work, I designed several type of short peptides (7−8 residues) including ac-A6K-NH2 as excellent surfactants and examined their stabilization ability for the PS-I membrane protein from a thermophilic cyanobacterium, Thermosynechococcus elongatus, in aqueous solution. From the characterization of these peptides, it was shown that their concentrations, their critical micelle concentrations (CMC), and the type of electrolyte in the medium were important for formation of stable nanotubes, nanovesicles and micelles like lipids and other chemical detergents (22, 23, 28, 29). Active PS-I complex in aqueous media was here found to be stabilized for long period by peptide surfactant molecules with specific amino acid sequences. On the basis of our results, I propose the mechanism that designed peptide surfactants can interact with the protein complex.
Materials and methods
Chemicals
All the chemicals, n-dodecyl-β-D-maltopyranoside (DDM), Fos-choline-14 (FC-14), and Triton X-100 were purchased from Anatrace (Maumee, OH, USA).
Digitonin (DG) was purchased from EMD Biosciences (San Diego, CA, USA). Peptide surfactants with the sequences, acetyl-AAAAAAK-NH2 (ac-A6K-NH2), acetyl-AAAAAAK-OH (ac-A6K-OH), acetyl-AAAAAAD-OH (ac-A6D-OH), acetyl-IIIIIIKK-NH2 (ac-I6K2-NH2), KAAAAAA-NH2 (KA6-NH2), DAAAAAA-NH2
(DA6-NH2), acetyl-VVVVVVKK-NH2 (ac-V6K2-NH2), acetyl-VVVVVVRR-NH2
(ac-V6R2-NH2), and acetyl-VVVVVVDD-NH2 (ac-V6D2-NH2), were synthesized and purified by Biopolymers Laboratory at Massachusetts Institute of Technology. Tricine, methyl viologen (MV), 2,6-dichloroindophenol (DCIP), sodium ascorbate, 3-(3,4-dichlorophenyl)-1,1-dimethylurea (DCMU), 5,6-carboxyfluorescein (CF) and chlorophyll were purchased from Sigma Aldrich (St. Louis, MO, USA).
Molecular modeling
The model of peptide structure was generated by modeling simulation using the CHARMM software (30). The most stable structure was evaluated by molecular dynamics simulation which included an energy minimization procedure of 20,000 steps with the steepest decent (SD) method followed by 20,000 steps of adapted basis Newton−Raphson (ABNR) method and dynamic simulations using the Generalized Born with Simple Switching (GBSW) implicit solvent model (30, 31). The model is formulated in such a way to yield numerically stable electrostatic solvation forces between the peptides and virtual water molecules. Graphic illustrations were generated by VMD software (32).
Purification of PS-I
The PS-I complex was extracted from the thylakoid membrane of the thermophilic cyanobacterium, T. elongatus. The bacterial grown cell was incubated with 0.25% (w/v) lysozyme for 2−3 h at 37 °C under gentle agitation. Cells were lysed with French press; remaining whole cells were removed by centrifugation at 3,000 × g for 5 min and the membrane fractions were collected by centrifugation at 71,680 × g. The membrane fractions were washed and solubilized according to the method by Fromme and Witt (33) except for the final washing by 3 M NaBr. Then the supernatant was
applied on a 10−40% linear sucrose gradient solution (20 mM MES pH 7.0, 10 mM MgCl2, 10 mM CaCl2 and 1 mM n-dodecyl-β-D-maltopyranoside, (DDM)) and centrifuged for 18 h at 100,000 × g and 4 °C. The lower green fraction collected was stored at −20 °C until the usage. The purity was confirmed by Tris−tricine SDS-PAGE gel electrophoresis (34). The chlorophyll content of PS-I was measured by the method of Porra (35).
Assay of PS-I activity
PS-I activity was determined by the widely used method based on the measurement of consumption of dissolved O2 in the O2-saturated solution with PS-I (36-38). The 3.5 mL of the working solution containing 40 mM tricine, 167 μM MV, 0.1 mM DCIP, 1 mM sodium ascorbate, 10 mM NH4Cl, and 10 μM DCMU at pH 7.5 was used. In this system, DCIP obtains electrons from sodium ascorbate and then the reduced DCIP reduces PS-I, which in turn transfers electrons to MV. The reduced MV is easily oxidized by the dissolved O2 in the solution. Illumination of the reaction solution triggered a photo-catalyzed electrochemical reaction cascade, and that leaded to consumption of dissolved O2. The O2 consumption was measured for determination of proceeding of the reaction by PS-I by an O2 electrode (Model ISO2, World Precision
Instruments, Inc. (Sarasota, FL, USA)). The electrode was standardized before and after each set of measurements with air saturated water (20.4% at 24 °C) according to the manufacturer’s specifications. As photo-source, a fiber optic illuminator Model 9745-00 (Cole Palmer Instrument Company, Chicago, IL) with lamp power 30 W and luminous intensity of 107,600 cd sr/m2 (which corresponds to ca. 1800 μmol of photons m−2 s−1) was used. All measurements were performed at 24 °C in 5 mL of poly(methylmethacrylate), PMMA, closed cuvettes under continuous stirring. The PS-I activities were determined from the initial slopes on the plots of O2 consumption according to reaction time. Standard deviations were calculated using error propagation techniques (n = 3).
For the time course experiment, PS-I samples were incubated at 4 °C in the presence and the absence of ac-A6K-NH2, ac-A6K-OH or DDM. At each time point up to 2 months, a sample was transferred into the reaction cell, which contained the O2-saturated working solution, then O2 consumption was measured as above. The final composition of the reaction mixture was identical to that of the O2 consumption tests shown above, i.e., 5 μg Chl of PS-I/mL and 0.47 mM of the peptide or DDM surfactant.
In all solutions, the concentration of the peptide surfactants and of the conventional detergents was adjusted to 0.47 mM which was higher than each
surfactant’s CMC. To avoid the possibility that PS-I exhibits the low activity by unfolding of PS-I itself in the presence of 0.47 mM chemical detergents, when chemical detergents were tested, concentration was diminished to 0.05 mM and the results obtained were compared. Furthermore, protein conformational change according to temperature was analyzed with fluorescence spectroscopy. Control experiments, using predenatured and unfolded PS-I, were also performed for exclusion of the possibility that O2 consumption was observed only under the presence of free plastocyanine (in vivo electron donor).
Western blots
The structural integrity of PS-I was analyzed by Western blots using specific antibodies for the PsaC and PsaD subunits of PS-I (Agrisera, Vännäs, Sweden) according to the protocol by Minai et al (39). To show that the PsaC and PsaD subunits were not released from the PS-I protein complex, PS-I samples in the presence and the absence of the ac-A6K-NH2 peptide were vigorously mixture by vortex mixer and then centrifuged at 100,000 × g for 30 min at 4 °C. The supernatants and precipitants were collected, separated by Novex 18% Tris−glycine gel electropholesis (Invitrogen, Carlsbad, CA) and separated samples were transferred on 0.2 μm nitrocellulose membranes (BIO RAD,
Hercules, CA). The nitrocellulose membranes were incubated with rabbit serum containing anti-PsaC or PsaD polyclonal antibodies (1:5000 dilution) and detected by goat antirabbit antibody associated with the horseradish peroxidase (ECL chemiluminescence kit, GE Healthcare).
Measurement of the critical micelle concentration (CMC) of the surfactants
To determine the CMC of the peptide surfactants and the conventional detergents, dynamic light scattering (DLS) experiments were performed in a PDDLS/Batch setup (Precision Detectors, Franklin, MA). Peptide and detergent samples were prepared at different concentrations (0.02 mM – 1 mM) in a medium used for the PS-I activity measurements (i.e., 40 mM tricine, 167 M MV, 0.1 mM DCIP, 1 mM sodium ascorbate, 10 mM NH4Cl, 10 μM DCMU in Milli-Q water at pH 7.5). The molecular weight of Triton X-100 was taken as 647 g/mol according to the manufacturer’s specifications. All solutions were passed through 0.2 μm pore sized filters prior to measuring light scattering. Scattered light was detected at 90° angle and the number of photons reaching the avalanche photodiode was recorded. The solvent viscosity and the refractive index of the buffer at 20 °C were 0.894 cP and 1.33,
respectively. Data was acquired and displayed by Precision Deconvolve program.
Triplicated experiments were recorded for each sample.
Measurement of thermal stability of PS-I
The thermal stability of the PS-I protein complex with and without peptide surfactants and DDM detergent was studied by fluorescence spectroscopy using a Perkin-Elmer LS-50B spectrophotometer between 30 and 85 °C. Protein samples were incubated for 20 min prior to recording fluorescence emission spectra between 600 and 800 nm using 1 cm path length quartz cuvettes. The excitation wavelength used was 442 nm, which excites the chlorophyll molecules. The excitation and emission slit widths were set at 5.0 and 2.5 nm, respectively.
Atomic force microscopy (AFM) imaging
AFM studies of peptide surfactants and commercial detergents alone and mixed with PS-I were performed using Nanoscope IIIa (Digital Instruments, Santa Barbara, CA) under tapping mode operation. Soft silicon probes (FESP, Veeco Probes) with a tip radius of <10 nm were mounted on a single-beam cantilever. 2 μL sample was deposited onto freshly cleaved mica surfaces and interacted with the mica surface for 30 s. After
rinse with pure water, samples on the mica surface were then air-dried and quickly AFM image was recorded in air at room temperature. Cantilever deflection was recorded with a cantilever frequency of 250 Hz, horizontal scan rate of 1.2 Hz and 512 samples per line.
For data analysis, the Nanoscope image processing software was utilized by providing height patterns, cross sections and root-mean-square roughness (rms) of PS-I in the presence and the absence of peptide surfactants or commercial detergents. AFM images were collected from two different samples and at random spot surface sampling (at least five spots).
Peptide vesicle stability by fluorescence spectroscopy
The stability of the vesicle constructed by assembly of peptides was studied using the method by Senior and Gregoriadis (40). The structural integrity of the peptide vesicle was assessed by measuring the releasing rate of the fluorescent reagent 5(6)-carboxyfluorescein (CF) from the peptide bilayer. As fluorescence from CF is strongly quenched when it is encapsulated into vesicle, the fluorescence intensity signal is detected only from CF released from bilayer vesicle.
In the presence and the absence of PS-I, the peptide surfactants and DDM were mixed with CF in a solution with the same composition used in the activity
measurements. Nonencapsulated CF was removed by ultrtafiltration with Microcon YM-10 (10 kDa cutoff) according to the supplier’s manual. Then the separated vesicles were resuspended into the buffer (40 mM tricine, 10 mM NH4Cl pH 7.5) and the solution was incubated for 1 h at 20 °C. The CF released from vesicles during incubation was collected by centrifugation, then the fluorescence intensity was measured. The release kinetics of CF was obtained from measurement of samples under 1 h interval. All measurements were carried out in a Perkin-Elmer LS-50B spectrophotometer at 20 °C using quartz cuvettes of 1 cm path length. The excitation wavelength was at 470 nm and the emission maximum was observed at 520 nm. The excitation and emission slit widths for 470 nm and 520 nm waves were set at 5.0 and 2.5 nm, respectively.
Results and discussion
Photo-induced electron transfer activity of PS-I in solution
To determine the activity and function of PS-I from T. elongatus, the course of an electrochemical reaction that involves electron flow from electron donor to acceptor DCIP or MV, through PS-I was monitored (38). Under illumination to the PS-I sample, the O2 concentration was monitored every 1 min after indicating signal was fixed with saturation of working solution by air. Before and after each experiment, a series of blank tests were performed. The PS-I was sensitive to light exposure as indicated by blank control experiments (Figure 1A). Under dark condition, O2 consumption was negligibly low. In contrast, under light illumination conditions, O2 consumption was clearly observed in the presence of PS-I in the solution containing ascorbate and DCIP as the electron donors and MV as the acceptor. To avoid electron transfer from traces of PS-II that may be contaminated in the working solution as a result of incomplete purification, DCMU, a potent inhibitor of PS-II, was added (41).
The O2 consumption observed in the reaction solution containing PS-I under illumination condition could not be attributed to (i) the presence of free plastocyanine (in vivo electron donor) in the PS-I samples, because in control experiments in the absence
of DCIP (in vitro electron donor), PS-I did not show O2 consumption activity (if contaminated plastocyanine is present in PS-I samples, they would consume O2 even in the absence of DCIP); (ii) the core-antenna chlorophylls uncoupled and released from the PS-I complex, because no O2 consumption was measured under testing conditions in the presence of different concentrations of free chlorophyll molecules; (iii) singlet oxygen production, because in the reaction solution ascorbate, which would react with singlet oxygen and produces H2O2, was used (42).
Stabilization of solubilized PS-I by ac-A6K-NH2
Previously, the effect of the peptide surfactant ac-A6K-NH2 were confirmed on the PS-I complexes from spinach under the dried condition at the surface of glasses (24).
The stabilization effect of ac-A6K-NH2 on solubilized PS-I was tested using the O2
consumption measurement. In the presence of ac-A6K-NH2, PS-I showed extremely high photo-induced O2 consumption (Figure 1A) compared to PS-I alone.
The chemical detergents such as FC-14, DDM, DG and Triton X-100 did not show any activity enhancement (Figure 1B). One possible reason for the low activity of PS-I in the presence of chemical detergents was the protein denaturation by high concentration of chemical detergent. Protein destabilization is often observed at high
detergent concentrations. The O2 consumption activity of PS-I was measured under two different conditions containing 0.05 mM (below the CMC) or 0.47 mM (above the CMC) of the chemical detergents. As shown in Figure 1B, same rate of the O2 consumption to the PS-I complex only was detected under all conditions investigated. This observation indicated that denaturation of PS-I complex is not due to the low O2 consumption activity detected.
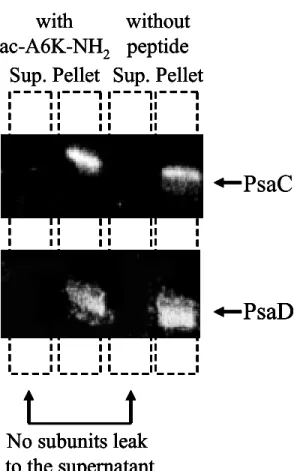
The western blot analysis of the PS-I complexes in the presence of the ac-A6K-NH2 peptide did not show any release of the stroma subunits PsaC and PsaD, which are coupled with the transmembrane subunits of PS-I, into supernatant fraction from PS-I complex (Figure 2). It could be concluded that the O2 consumption observed in the reaction solution containing PS-I complex could not be attributed to the dissociation of the PS-I complex and release of chlorophyll molecules from PS-I complex.
All critical micelle concentration (CMC) for peptide molecules and commercial detergents were obtained and summarized in Table 1. The effect of different ac-A6K-NH2
concentrations on the PS-I activity is shown in Figure 3. The CMC of ac-A6K-NH2 in the reaction solution is 0.26 mM (Table 1). PS-I activity was strongly dependent on the ac-A6K-NH2 concentration from 0.017 mM (1/15 CMC) to 0.47 mM (1.8 CMC). The
initial PS- I activity under addition of 0.47 mM ac-A6K-NH2 exhibited 9 times higher activity than that of PS-I alone (Figure 1A). However, further increase of PS-I activity was not observed with more higher concentration of ac-A6K-NH2: almost same PS-I activity was observed by both the additions of 0.47 mM (1.8 CMC) and 0.94 mM (3.6 CMC) ac-A6K-NH2. This observation indicates that enhancement of PS-I activity by the peptide surfactant is saturated at that concentration.
Comparison of peptide surfactant efficiency for stabilization and enhancement of PS-I activity
The effect of amino acid sequences of peptide detergent molecules on PS-I activity was examined. All peptide and chemical detergents were used at the concentration of 0.47 mM, which was higher than their respective CMC. The values presented in Figure 4 were determined from the slope of O2 consumption curves which were similar to those presented in Figures 1A, 1B and 3. Eight peptide molecules with different amino acid sequences but containing both hydrophobic tail and hydrophilic head were designed. Among these peptide molecules, ac-I6K2−NH2, ac-V6K2-NH2 and ac-V6R2-NH2 accelerated the O2 consumption by PS-I complex 8, 10 and 12 times, respectively (Figure 4, summarized in Table 2). The PS-I activity in the presence of the
appropriate peptide surfactant was higher than that in the presence of standard chemical detergents usually used for the stabilization of membrane proteins.
PS-I stabilization with peptide surfactants for extended time
The PS-I complex was stored under conditions in the presence of the ac-A6K-NH2 or ac-A6D-OH peptide molecules plus with or without of a chemical detergent, DDM. The initial activity of the PS-I complex was monitored over more than 2 months. In the presence of 0.47 mM of ac-A6K-NH2, PS-I showed an initial decrease of activity within the first two days and reached a plateau after one week. However, even after 2 months, PS-I was still highly active under this condition. The activity of the PS-I stored over 2 months in this condition was 5 times higher than that of PS-I stored alone or under condition in the presence of 0.47 mM DDM (Figure 6A).
For structural analyses and for applications in biosensors, it is crucial to stabilize membrane proteins for extended time. The time course experiments showed that PS-I stabilized by ac-A6K-NH2 peptide surfactant remained highly active even after 2 months.
The fact that PS-I mixed with peptide surfactants retains enhanced activity for prolonged periods of time suggests that stabilization of the functional conformation of PS-I complex by the peptide surfactant is not temporary. It was shown previously that PS-I
was stabilized by peptides for 3 weeks in the dry state on the surface of a semiconductor (24). The current study not only confirms the earlier results but also shows that stabilization can be maintained for more than 2 months in aqueous media, an environment in which membrane proteins tend to aggregate more readily.
Thermal stability experiments
The fluorescence spectroscopy was used for investigation of structural stability at different temperature of PS-I alone or mixed with peptide surfactants or with DDM.
Upon excitation at 442 nm the emission profile of PS-I is sensitive to the relative position of the chlorophyll molecules in the three-dimensional structure of the protein. Therefore, the structural stability of the PS-I complex is usually monitored by the chlorophyll fluorescence. The wavelength of maximum emission (λmax) is changed to more blue range by denaturation of the PS-I complex. The wavelength of maximum emission (λmax) was monitored as a function of temperature between 20−85 °C (Figure 6B).
As shown in the Figure 6B, sole PS-I complex indicated the highest thermal stability. On the contrary, when peptide surfactant was present the PS-I complex was denatured at 15 °C lower temperature than that by PS-I alone (containing 0.03 mM DDM to prevent aggregation). Plotting of the wavelength of maximum emission (λmax) of PS-I
complex indicated change of the temperature of thermal stability of PS-I complex to 66 °C from 78 °C by presence of peptide surfactant. The O2 consumption electrochemical reaction was not detected on any PS-I complex after thermal treatment, suggesting that heat treatment changed PS-I complex to the irreversibly denatured form.
These observations suggest that peptide surfactants increased the activity of the membrane protein by a mechanism which does not involve thermal stabilization, and that the peptide surfactants do not bind to the protein in a tight and irreversible mode.
As shown in Figure 6B, PS-I was still active at 24 °C under condition in the presence of 0.47 mM DDM (i.e., 2.7× above the CMC). However, over 30 °C blue shift of the wavelength of maximum emission (λmax) was detected for PS-I complex in the presence of this concentration of DDM, indicating that DMM induced strict change of the tertiary structure of the PS-I complex. From these experiments, it could also be hypothesized that increasing of O2 consumption activity on PS-I complex by peptide surfactant could not be due to enhancement of stabilization of PS-I.
AFM imaging
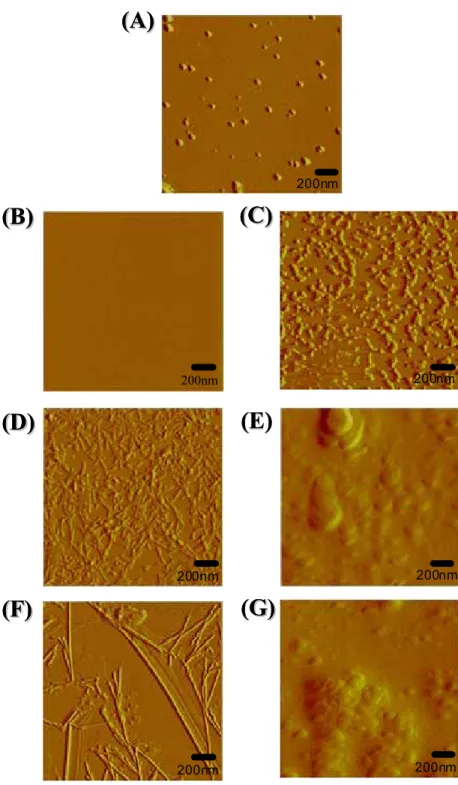
The topological structure of PS-I, with and without surfactants, on the surface of mica using tapping mode AFM was analyzed. Figure 7A shows PS-I molecules with an
average height of 5−6 nm and a diameter between 40−60 nm. Because of tip broadening effects, the width measured by AFM imaging is larger than actual that of individual molecules (43). From the tertiary structure of PS-I determined by crystallography, the height and the diameter of the PS-I trimer complex was predicted 6 nm and approximately 50 nm, respectively. Therefore, the structures observed in the AFM topographical images correlate well with the PS-I trimers.
The surface topology of DDM on mica could not be distinguished from the bare mica surface (Figures 7B). When PS-I was mixed with 0.47 mM DDM (Figure 7C), surface patterns were similar to that of PS-I alone (Figure 7A), which suggests that 0.47 mM DDM did not induce notable structural changes in PS-I.
The ac-A6K-NH2 peptide molecules formed nanotubes with over 100 nm long (Figure 7D), featuring morphology similar to that observed for other types of amphiphilic peptides (17, 19). When PS-I complex was mixed with ac-A6K-NH2 peptide molecule, the morphology of the nanotubes was changed to a two-dimensional “island”
morphology with larger vesicle sizes (Figure 7E). Cross-sectional analysis of the surface topography of this “island” nanotubes showed that the clusters have a step height of 8−15 nm and an average diameter of 160 nm with particle sizes ranging between 110 and 350 nm. Similar morphology but different vesicle size was observed, when the PS-I complex
was mixture with other peptide surfactants, ac-A6D-OH (e.g., Figure 7G). Therefore, difference of the stability of two peptide vesicles was compared.
Peptide vesicle stability
The stability and structural integrity of the peptide vesicles was determined by measuring the release kinetics of the fluorescent probe CF from the vesicles. As shown in Figure 8, releasing of CF from the peptide vesicles consisting of ac-A6K-NH2 were slower than those from vesicles consisting of other peptide surfactant or chemical detergents. When the release experiment were performed under harsh conditions (i.e., centrifugation and resuspension of the vesicles), the amount of CF released from the ac-A6K-NH2 peptide vesicle reached a plateau after 7 h and release of approximately 50% of CF initially incorporated into vesicles. In the case of vesicles composed of other peptides and DDM detergent, CF was completely released from vesicles within 3−4 h.
These observations indicate that the peptide vesicles consisting of ac-A6K-NH2 was stable than other vesicles.
Important Factors for Enhancement of the PS-I Activity
It was already shown that in the solid state surface, the PS-I complex was stabilized for 3 weeks by mixture with a peptide molecule ac-A6K-NH2 (24). In this study, therefore, the stabilization of PS-I complex present in aqueous phase by the same peptide molecule was investigated. Unfortunately, this peptide did not effect on the stability of PS-I complex. However, this peptide molecule drastically increased the O2
consumption activity of PS-I complex. Then, the effects of eight peptide molecules with different amino acid sequences on enhancement of the PS-I activity was analyzed.
Although all peptides were designed with a hydrophobic tail and a hydrophilic head, other factors were shown to be important for ensuring high PS-I functional activity.
Among, these peptide molecules, three kinds of peptide molecules with amino acid sequences, ac-I6K2-NH2, ac-V6K2-NH2 and ac-V6R2-NH2, exhibited the significant enhancement of the PS-I activity (Figure 3 and Table 2).
AFM analysis revealed the formation of large vesicles for all of the peptide surfactants mixed with PS-I. However, only vesicles constructed by ac-A6K-NH2 peptide was correlated with the effective enhancement of the PS-I activity. This suggests that the formation of vesicles is not a necessary condition to determine the peptide surfactant effectiveness.
The release profiles of the fluorescent probe CF from the vesicles suggested that the structural integrity of the peptide vesicles depends on the type of peptide. The higher rigidity and packing order of the vesicles consisting of ac-A6K-NH2 correlates well with the PS-I activity tests (Figure 3). It was shown that the interaction of ac-A6K-NH2 with PS-I resulted in increased their activity as compared to that observed when PS-I was mixed with other peptide molecules or DDM.
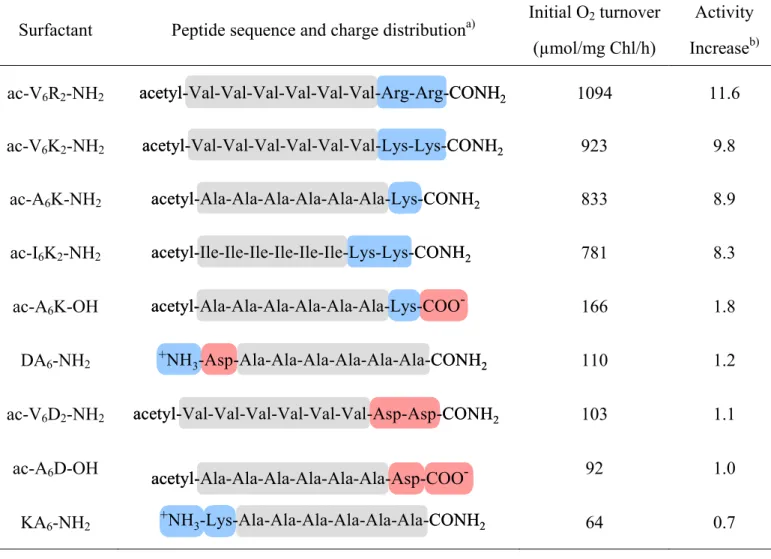
The data showed that positive charges on the C-terminal end of the peptide (e.g., ac-V6K2-NH2 and ac-A6K-NH2) are essential for maintaining high PS-I activity. Peptides carrying a negative charge in the C-terminus did not enhance the PS-I activity.
Furthermore, although ac-A6K-NH2 and ac-A6K-OH have the same amino acid sequence, differing only in the capping group of the C-terminal amino acid, lysine, ac-A6K-NH2 is very effective in increasing the activity of PS-I for prolonged times whereas ac-A6K-OH has no significant effect (Figures 5 and 6A). Both peptides are acetylated at their N-terminal and the -amine group of lysine is positively charged, i.e.,
−CH2−NH3+. However, at pH 7.5 the amidated C-terminus of ac-A6K-NH2, i.e.,
−CONH2, is not charged, but the C-terminus ac-A6K-OH is negatively charged, i.e.,
−COO−. Hence, the net charge of ac-A6K-OH is neutral (Figure 5 and Table 2).
The amino acid sequence, which defines the position of the charges on the peptide, is also important for designing an efficient surfactant. Although the interaction of ac-A6K-NH2 with PS-I significantly increased the protein activity, the KA6-NH2
peptide did not. The nonacetylated N-terminal side of KA6-NH2 has a free amine group, which is positively charged at pH 7.5 (Figure 5 and Table 2). Hence, the charge distribution of KA6-NH2 differs from that of the ac-A6K-NH2.
The importance of the sequence was also identified in the cases of the ac-I6K2-NH2, ac-A6K-NH2, ac-V6K2-NH2 and ac-V6R2-NH2 peptides, which significantly enhanced the activity of PS-I. It was shown that increasing the hydrophobicity of the side chain, namely, alanine < valine < isoleucine (44, 45), of the hydrophobic tail amino acids was not crucial for PS-I activity. Although the 6 isoleucines in the ac-I6K2-NH2 sequence render the peptide tail more hydrophobic compared to ac-V6K2-NH2, the latter is more effective toward an active PS-I. Furthermore, when the PS-I activities in the presence of ac-V6K2-NH2 and ac-V6R2-NH2 peptides were compared, it was shown that the two positively charged arginines (the most hydrophilic amino acid at pH 7.5) at the C-terminus are better than the two lysines (Figure 4).
Table 1. Critical micelle concentration (CMC) of the lipid-like peptide surfactants and general chemical detergents in the reaction solution used for the O2
consumption measurements
Surfactant Type CMC in the reaction solution (mM) ac-V6R2-NH2 Cationic 0.08 ac-V6K2-NH2 Cationic 0.09
ac-A6K-NH2 Cationic 0.26
ac-I6K2-NH2 Cationic 0.10
ac-A6K-OH Zwitterionic 0.11
DA6-NH2 Zwitterionic 0.09
ac-V6D2-NH2 Anionic 0.10
Ac-A6D-OH Anionic 0.22
KA6-NH2 Anionic 0.13
DDM Nonionic 0.17
Triton X-100 Nonionic 0.29
DG Nonionic 0.19
FC-14 Zwitterionic 0.09
Table 2. Amino acid sequence and charge distribution of the peptides used for PS-I stabilization
Surfactant Peptide sequence and charge distributiona) Initial O2 turnover (µmol/mg Chl/h)
Activity Increaseb)
ac-V6R2-NH2 acetyl-Val-Val-Val-Val-Val-Val-Arg-Arg-CONHacetyl-Val-Val-Val-Val-Val-Val-Arg-Arg-CONH22 1094 11.6 ac-V6K2-NH2 acetyl-Val-Val-Val-Val-Val-Val-Lys-Lys-CONHacetyl-Val-Val-Val-Val-Val-Val-Lys-Lys-CONH22 923 9.8
ac-A6K-NH2 acetyl-Ala-Ala-Ala-Ala-Ala-Ala-Lys-CONHacetyl-Ala-Ala-Ala-Ala-Ala-Ala-Lys-CONH22 833 8.9 ac-I6K2-NH2 acetyl-Ile-Ile-Ile-Ile-Ile-Ile-Lys-Lys-CONHacetyl-Ile-Ile-Ile-Ile-Ile-Ile-Lys-Lys-CONH22 781 8.3 ac-A6K-OH acetyl-Ala-Ala-Ala-Ala-Ala-Ala-Lys-COOacetyl-Ala-Ala-Ala-Ala-Ala-Ala-Lys-COO-- 166 1.8 DA6-NH2 ++NHNH33-Asp-Ala-Ala-Ala-Ala-Ala-Ala-CONH-Asp-Ala-Ala-Ala-Ala-Ala-Ala-CONH22 110 1.2 ac-V6D2-NH2 acetyl-Val-Val-Val-Val-Val-Val-Asp-Asp-CONHacetyl-Val-Val-Val-Val-Val-Val-Asp-Asp-CONH22 103 1.1 ac-A6D-OH acetyl-Ala-Ala-Ala-Ala-Ala-Ala-Asp-COOacetyl-Ala-Ala-Ala-Ala-Ala-Ala-Asp-COO-- 92 1.0
KA6-NH2 ++NHNH33-Lys-Ala-Ala-Ala-Ala-Ala-Ala-CONH-Lys-Ala-Ala-Ala-Ala-Ala-Ala-CONH22 64 0.7
a) Highlighted domains represent amino acids with positive charge (blue), negative charge (red) and hydrophobic side chains (grey).
b) The activity increase was calculated with regards to the initial activity of PS-I alone containing traces of DDM (i.e., 94 µmol/mg Chl/h).
(A)
(B) (A)
(B)
Figure 1. Measurement of O2 consumption under the conditions with different amphiphilic peptide surfactants or standard commercial detergents. (A) As the PS-I activity, O2 consumption was measured under indicating conditions. The experiments were repeated three times. Open symbols indicate measurement under dark condition, closed syboles indicate measurement under illuminating condition. (B) O2 consumption was measured under condition in the presence of the indicating concentration of the commercial detergents, FC-14, DDM, DG and Triton X-100. Percentages on y-axis denote O2 consumption relative to the maximum amount of O2 in the solution which corresponds to solution saturation with O2.
Figure 2. Western blot immunodetection of the PsaC and PsaD subunits of the PS-I complex. Samples in the presence and the absence of the ac-A6K-NH2 peptide were tested after vortexing and centrifugations at 100,000 × g.
PsaC
Sup. Pellet with
ac-A6K-NH2
without peptide
PsaD
No subunits leak to the supernatant
Sup. Pellet
PsaC PsaC
Sup. Pellet with
ac-A6K-NH2
without peptide
PsaD
No subunits leak to the supernatant
Sup. Pellet Sup. Pellet with
ac-A6K-NH2
without peptide
PsaD
No subunits leak to the supernatant
Sup. Pellet Sup. Pellet with
ac-A6K-NH2
without peptide
PsaD PsaD
No subunits leak to the supernatant No subunits leak to the supernatant
Sup. Pellet
Figure 3. Measurement of O2 consumption under conditions in the presence of different concentrations of ac-A6K-NH2. All experiments at each data point are repeated three times. The PS-I concentration corresponds to 5.6 μM of chlorophyll.
Percentages on y-axis denote O2 consumption relative to the maximum amount of O2 in the solution which corresponds to solution saturation with O2.
Figure 4. The O2 consumption of the PS-I under conditions in the presence of indicating commercial detergents and peptide surfactants. The experiments were repeated three times.
PS-I only FC
-14
DDM DG Triton X-100
KA-N6 H2 ac-A6
D-OH ac-V6
D-N2 H2 DA-N6 H2
ac-AK6-OH ac-IK6 -N2 H2
ac-AK6-NH2 ac-V6
K-N2 H2 ac-V6
R-N2 H2 PS-I only
FC -14
DDM DG Triton X-100
KA-N6 H2 ac-A6
D-OH ac-V6
D-N2 H2 DA-N6 H2
ac-AK6-OH ac-IK6 -N2 H2
ac-AK6-NH2 ac-V6
K-N2 H2 ac-V6
R-N2 H2
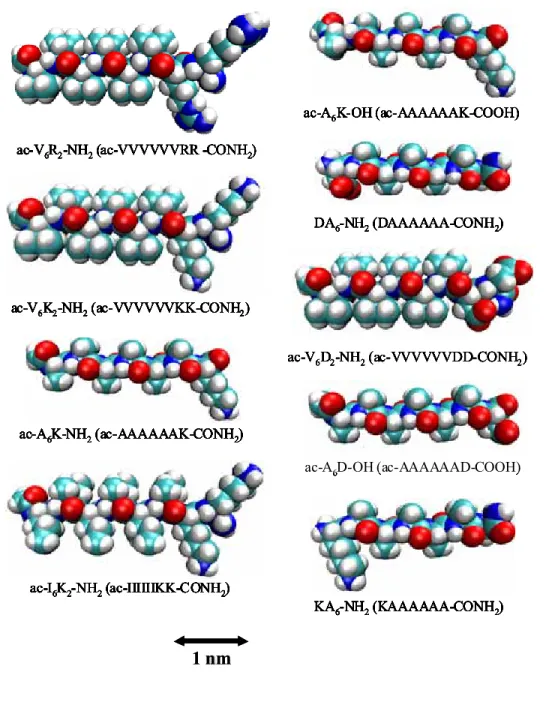
Figure 5. Molecular modeling of peptide surfactants. The bar indicates one nm. Each peptide is ca. 2.5 nm long, similar to biological phospholipids. Cyan indicates the Carbon atom; Red the Oxygen atom; Blue Nitrogen atom; White Hydrogen atom.
ac-V6D2-NH2(ac-VVVVVVDD-CONH2)
ac-A6D-OH (ac-AAAAAAD-COOH) ac-A6K-OH (ac-AAAAAAK-COOH)
DA6-NH2(DAAAAAA-CONH2)
KA6-NH2(KAAAAAA-CONH2) ac-A6K-NH2(ac-AAAAAAK-CONH2)
ac-I6K2-NH2(ac-IIIIIIKK-CONH2) ac-V6K2-NH2(ac-VVVVVVKK-CONH2)
ac-V6R2-NH2(ac-VVVVVVRR -CONH2)
ac-V6D2-NH2(ac-VVVVVVDD-CONH2) ac-V6D2-NH2(ac-VVVVVVDD-CONH2)
ac-A6D-OH (ac-AAAAAAD-COOH) ac-A6K-OH (ac-AAAAAAK-COOH)
DA6-NH2(DAAAAAA-CONH2)
KA6-NH2(KAAAAAA-CONH2) ac-A6K-NH2(ac-AAAAAAK-CONH2)
ac-I6K2-NH2(ac-IIIIIIKK-CONH2) ac-V6K2-NH2(ac-VVVVVVKK-CONH2)
ac-V6R2-NH2(ac-VVVVVVRR -CONH2)
ac-A6D-OH (ac-AAAAAAD-COOH) ac-A6K-OH (ac-AAAAAAK-COOH)
DA6-NH2(DAAAAAA-CONH2)
KA6-NH2(KAAAAAA-CONH2) ac-A6D-OH (ac-AAAAAAD-COOH) ac-A6D-OH (ac-AAAAAAD-COOH) ac-A6K-OH (ac-AAAAAAK-COOH) ac-A6K-OH (ac-AAAAAAK-COOH)
DA6-NH2(DAAAAAA-CONH2) DA6-NH2(DAAAAAA-CONH2)
KA6-NH2(KAAAAAA-CONH2) KA6-NH2(KAAAAAA-CONH2) ac-A6K-NH2(ac-AAAAAAK-CONH2)
ac-I6K2-NH2(ac-IIIIIIKK-CONH2) ac-V6K2-NH2(ac-VVVVVVKK-CONH2)
ac-V6R2-NH2(ac-VVVVVVRR -CONH2)
ac-A6K-NH2(ac-AAAAAAK-CONH2) ac-A6K-NH2(ac-AAAAAAK-CONH2)
ac-I6K2-NH2(ac-IIIIIIKK-CONH2) ac-I6K2-NH2(ac-IIIIIIKK-CONH2) ac-V6K2-NH2(ac-VVVVVVKK-CONH2) ac-V6K2-NH2(ac-VVVVVVKK-CONH2) ac-V6R2-NH2(ac-VVVVVVRR -CONH2) ac-V6R2-NH2(ac-VVVVVVRR -CONH2)
1 nm 1 nm
ac-V6D2-NH2(ac-VVVVVVDD-CONH2)
ac-A6D-OH (ac-AAAAAAD-COOH) ac-A6K-OH (ac-AAAAAAK-COOH)
DA6-NH2(DAAAAAA-CONH2)
KA6-NH2(KAAAAAA-CONH2) ac-A6K-NH2(ac-AAAAAAK-CONH2)
ac-I6K2-NH2(ac-IIIIIIKK-CONH2) ac-V6K2-NH2(ac-VVVVVVKK-CONH2)
ac-V6R2-NH2(ac-VVVVVVRR -CONH2)
ac-V6D2-NH2(ac-VVVVVVDD-CONH2) ac-V6D2-NH2(ac-VVVVVVDD-CONH2)
ac-A6D-OH (ac-AAAAAAD-COOH) ac-A6K-OH (ac-AAAAAAK-COOH)
DA6-NH2(DAAAAAA-CONH2)
KA6-NH2(KAAAAAA-CONH2) ac-A6K-NH2(ac-AAAAAAK-CONH2)
ac-I6K2-NH2(ac-IIIIIIKK-CONH2) ac-V6K2-NH2(ac-VVVVVVKK-CONH2)
ac-V6R2-NH2(ac-VVVVVVRR -CONH2)
ac-A6D-OH (ac-AAAAAAD-COOH) ac-A6K-OH (ac-AAAAAAK-COOH)
DA6-NH2(DAAAAAA-CONH2)
KA6-NH2(KAAAAAA-CONH2) ac-A6D-OH (ac-AAAAAAD-COOH) ac-A6D-OH (ac-AAAAAAD-COOH) ac-A6K-OH (ac-AAAAAAK-COOH) ac-A6K-OH (ac-AAAAAAK-COOH)
DA6-NH2(DAAAAAA-CONH2) DA6-NH2(DAAAAAA-CONH2)
KA6-NH2(KAAAAAA-CONH2) KA6-NH2(KAAAAAA-CONH2) ac-A6K-NH2(ac-AAAAAAK-CONH2)
ac-I6K2-NH2(ac-IIIIIIKK-CONH2) ac-V6K2-NH2(ac-VVVVVVKK-CONH2)
ac-V6R2-NH2(ac-VVVVVVRR -CONH2)
ac-A6K-NH2(ac-AAAAAAK-CONH2) ac-A6K-NH2(ac-AAAAAAK-CONH2)
ac-I6K2-NH2(ac-IIIIIIKK-CONH2) ac-I6K2-NH2(ac-IIIIIIKK-CONH2) ac-V6K2-NH2(ac-VVVVVVKK-CONH2) ac-V6K2-NH2(ac-VVVVVVKK-CONH2) ac-V6R2-NH2(ac-VVVVVVRR -CONH2) ac-V6R2-NH2(ac-VVVVVVRR -CONH2)
1 nm 1 nm
0 100 200 300 400 500 600 700 800 900
0 10 20 30 40 50 60 70
Time (days)
°mol O2/mg Chl/h
PS-I + ac-A6K-NH2 PS-I + ac-A6K-NH2 + DDM PS-I + ac-A6D-OH
PS-I + ac-A6D-OH + DDM PS-I + DDM
(A) (A)
μ
0 100 200 300 400 500 600 700 800 900
0 10 20 30 40 50 60 70
Time (days)
°mol O2/mg Chl/h
PS-I + ac-A6K-NH2 PS-I + ac-A6K-NH2 + DDM PS-I + ac-A6D-OH
PS-I + ac-A6D-OH + DDM PS-I + DDM
(A) (A)
0 100 200 300 400 500 600 700 800 900
0 10 20 30 40 50 60 70
Time (days)
°mol O2/mg Chl/h
PS-I + ac-A6K-NH2 PS-I + ac-A6K-NH2 + DDM PS-I + ac-A6D-OH
PS-I + ac-A6D-OH + DDM PS-I + DDM
(A) (A)
μ
676 678 680 682 684 686 688 690
10 20 30 40 50 60 70 80 90 100 110
Temperature (℃)
Wavelength (nm)
PS- I
PS-I + ac-A6K-NH2 PS-I + ac-A6D-OH PS-I + ac-V6R2-NH2 PS-I + DDM Denatured PS-I
(B) (B)
676 678 680 682 684 686 688 690
10 20 30 40 50 60 70 80 90 100 110
Temperature (℃)
Wavelength (nm)
PS- I
PS-I + ac-A6K-NH2 PS-I + ac-A6D-OH PS-I + ac-V6R2-NH2 PS-I + DDM Denatured PS-I
(B) (B)
Figure 6. (A) O2 consumption of the PS-I complex in the presence of ac-A6K-NH2 or ac-A6D-OH amphiphilic peptides. Closed symbols indicate presence of peptide molecules only, open symbols indicate addition of DDM. The O2 consumption was measured at 20°C and indicating periods. (B) Temperature dependency of the wavelength of maximum emission on excitation at 442 nm. The wavelength of maximum emission was measured in the presence of 0.47 mM of amphiphilic peptides or 0.5 mM of DDM. The heat denatured PS-I (black) was used as a negative control.
Figure 7. Tapping mode AFM images of PS-I stabilized by the ac-A6K-NH2 peptide surfactant and by the commonly used commercial detergents DDM. (A) the PS-I
200nm
200nm
200nm
200nm
200nm 200nm
200nm
(A) (A)
(B) (B) (C) (C)
(D) (D) (E) (E)
(F) (F) (G) (G)
200nm 200nm
200nm 200nm
200nm 200nm
200nm 200nm
200nm 200nm 200nm
200nm 200nm 200nm
(A) (A)
(B) (B) (C) (C)
(D) (D) (E) (E)
(F) (F) (G) (G)
complex only, (B) DDM detergent only, (C) PS-I complex with DDM, (D) ac-A6K-NH2 peptide surfactant only, (E) PS-I in the presence of ac-A6K-NH2
peptide, (F) ac-A6D-OH only, (G) PS-I in the presence of ac-A6D-OH. Scale bar indicates 200 nm.
Figure 8. Retention of encapsulated carboxyfluorescein (CF) in peptide- and DDM-based vesicles upon incubation at 20°C in the presence and the absence of PS-I.
ac
ac--A6KA6K--NH2NH2 PS
PS-I + ac-I + ac--A6K-A6K-NH2NH2 KA6KA6--NH2NH2
PS
PS-I + K A6-I + KA6--NH2NH2 ac
ac--A6DA6D--OHOH PSPS--I + acI + ac--A6DA6D--OHOH DA6DA6--NH 2NH 2
PS
PS-I + DA6-I + DA6--NH2NH2 DDM
DDM PSPS-I + DDM-I + DDM ac
ac--A6KA6K--NH2NH2 PS
PS-I + ac-I + ac--A6K-A6K-NH2NH2 KA6KA6--NH2NH2
PS
PS-I + K A6-I + KA6--NH2NH2 ac
ac--A6DA6D--OHOH PSPS--I + acI + ac--A6DA6D--OHOH DA6DA6--NH 2NH 2
PS
PS-I + DA6-I + DA6--NH2NH2 DDM
DDM PSPS-I + DDM-I + DDM
Chapter 2
Enhancement of the electron transfer activity on photosystem I by cationic polypeptide surfactants in aqueous solution
Abstract
It was indicated in chapter 1 that positive charge on the peptide surfactants plays an important role for effective enhancement of the PS-I activity in aqueous solution.
Stabilization and activation of the PS-I complex by simpler cationic poly-amino acid molecules were investigated.
Six poly-amino acids (i.e., poly-L-tyrosine, poly-L-histidine, poly-L-aspartic acid, poly-L-glutamic acid, poly-L-arginine and poly-L-lysine) were investigate on their ability for enhancement of PS-I activity. The cationic poly-L-lysine and poly-L-arginine markedly enhanced the photochemical activity of PS-I complex, whereas negatively charged and hydrophobic poly-amino acids did not increase the PS-I activity.
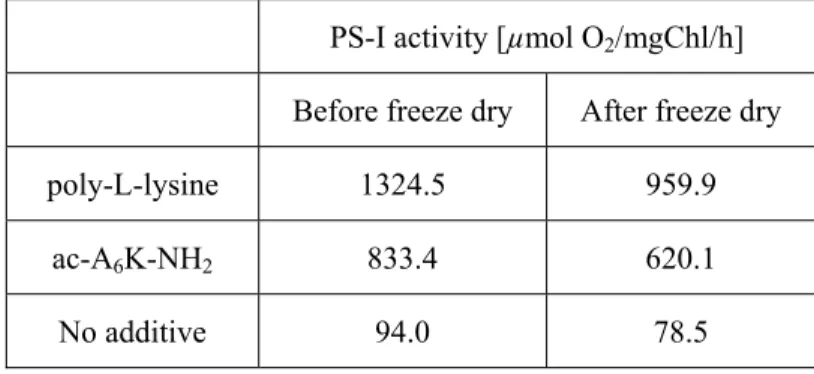
Furthermore, it was observed that 74 % of PS-I activity was recovered after storage under dry conditions by addition of poly-L-lysine to PS-I complex. This indicates that
the simple and commercially available poly-amino acids with positive charges may be useful for applications of the PS-I complex in nanotechnology and biotechnology.
Introduction
In chapter 1, it was investigated that the peptide surfactant molecules have ability to stabilize and increase the electron transfer activity of the PS-I complex. In addition, the guide for design the peptide surfactants with high efficiency on stabilization and enhancement of the PS-I activity was established in comparison of the peptide surfactants with different sequences and features. The vesicle formation of cationic peptide surfactants and the structural integrity of the peptide vesicles were crucial for the PS-I activity enhancement. Peptide surfactants were self-assembled into larger structural architecture that encapsulated PS-I into macro-structures. The self-assembling level of peptide surfactants was related to their concentrations and PS-I activity was decreased below their CMC (0.26 mM or 0.15 mg/ml of ac-A6K-NH2). Among these features, cationic charge on peptide surfactants was detected as the most important factor for enhancement of the PS-I activity. From this observation, it is expected that cationic poly-amino acids possess the similar ability for enhancement of the PS-I activity. In this work, therefore, the possibility of enhancement of PS-I activity by different kinds of poly-amino acids was investigated.