Strain Rate Dependency of Dynamic Flow Stress of BCC Metal in Wide Strain Rate and Temperature Ranges
Masahiro HORITA*, Kiyotaka SAKINO**
In order to clarify a rate controlling mechanism of iron, compressive tests for 0.01wt.%C iron are conducted in a strain rate range from about 1×1 0--3to 2×1 0 /s and at temperatures4 ranging from 79K to 473K. Furthermore, to evaluate the effect of a strain rate history on the dynamic flow stress, strain rate change tests are performed in the strain rate range from about 1.0×1 0 ~1.64 ×1 0 /s at temperature of 293K. The results of4 measurement are treated on the basis of a theory of thermally activated process. In a high strain rate and low temperature ranges, a dominant rate controlling mechanism is a dislocation motion which surmounts the Peierls potential barriers with a aid of the thermally activated formation of kink pairs. Below the strain rate of 1/sec and at temperature of 293K, the mechanism may be controlled by the thermally assisted cutting of point obstacles with moving dislocations.
High Strain rate, Iron, Strain Rate Sensitivity,Thermally Activated Process Key Words :
1. INTRODUCTION
It has been reported by many investigators that a strain rate sensitivity of the flow stress " dσ/dlog " in the metallic materials increases steeply above a critical strain rate of about 5 × 1 03/s. In the case of FCC metals, it has been interpreted that the steep increase in " dσ/dlog "
is due to the transition in the rate controlling mechanism of the dislocation motion shifted from the thermal activation to a phonon drag 1,2 .[ ]
It has been generally accepted for BCC metals that, in the strain rate ranging from about 1 t o 1 ×10 3/s in which
" dσ/dlog" appears strongly, the mechanism is attributable to the d i slocation motion which surmounts the P eierls potential barriers with the aid of the thermally activated formation of kink pairs 3,4,5,6 .[ ] Above strain rate of 5 ×10 /s, the deformation mechanism3 is controlled by the dislocation damping process [5,6 .] In addition, below the strain rate of about 1/s at room temperature it has been considered that the deformation is controlled by a athermal process in spite of a evidence of a increase in the flow stress with the strain rate[3,4 .] However, various questions have been also risen as to the above interpretations. Nojima [ ]7 carried out a strain rate tests for the pure iron and the mild steel in the wide strain rate range (=10 ~10 /s , and suggested that in-4 3 ) the steel, a single thermally activated processes is predominant from a quasi-static up to an extremely high strain rate region. The other interpretation has been also presented which ascribes the phenomenon to the internal structure evolution reflecting the strain rate history [ ]8 .
* Graduate school of Mechanical Engineering
* Department of Mechanical Engineering
On the other hand, Aono et al. [ ]9 made measurements for a single crystal of extremely high purity iron and 150 appm C iron. The measurement were made at low strain rates, but the temperature range covered very low temperature and activation energy E( τ ) for deformation was determined over the wide range of stress including the very high stress which is seen in the present work at very high strain rates.
In this paper, in order to clarify the rate controlling mechanism of iron, compressive tests for 0.01wt.%C iron are conducted in the strain rate range from about 1 × 10⁻³
2 ×10 /s at temperatures ranging from 79K to 473K.
~ 4
Furthermore, the strain rate reduction tests in the strain rate range above about 1x10 /s is conducted to define whether4 the steep increase in " dσ/dlog " is attributed to the strain rate history or the instantaneous strain rate. The results obtained are analysed on the basis of the dislocation kinetics using E( τ ) obtained by Aono et al.
2. EXPERIMENTAL METHOD
Four types of testing setups were used which were a 50 kN capacity screw driven Instron type machine, a split Hopkinson bar system, a direct impact Hopkinson bar system and the strain rate reduction system. Compression tests were carried out at elevated temperatures by surrounding the specimen with a short ceramic tube furnace. Tests at low temperatures were made by placing a foamed polystyrene jacket filled with liquid nitrogen or mixture of liquid nitrogen and ether alcohol around the specimen. Constant strain rate tests were performed at strain rates of 10-3 ~ 2x10 /s and temperatures of 79 ~4 473K. Strain rate reduction tests were conducted at the high strain rates and the temperature of 293K. Testing
setups used in the wide range of strain rates and temperatures and testing conditions are summarized in Table 1.
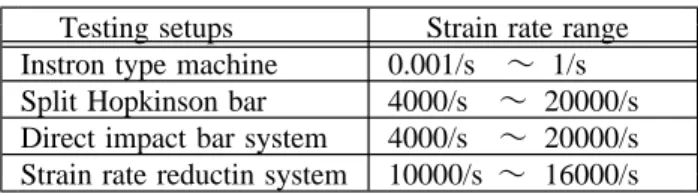
Table 1 Testing setups for various testing conditions Testing setups Strain rate range Instron type machine 0.001/s ~ 1/s Split Hopkinson bar 4000/s ~ 20000/s Direct impact bar system 4000/s ~ 20000/s Strain rate reductin system 10000/s ~ 16000/s
In the case of the hight strain rate tests, the following assemblies were used. Both the projectile and decelerator were made of Ti-6 Al-4 V alloy. Their diameter and length were 13 mm and 100 mm, respectively. The inner diameter of the decelerator was 6 mm. The pressure bar was made of tungsten. Its diameter and length were 4 mm and 300 mm, respectively. The density and the bar wave velocity of Ti-6 Al-4 V alloy are 4.42 g/cm and3 5060 m/s, respectively. Those of tungsten are 19.3g/cm3
and 4480 m/s. The above combination gives strain rate reduction by about 44% of strain rate before reduction.
Using the one-dimensional bar wave approximation and considering elastic deformation of the impact bar and output bar caused by the flow stress of the specimen, the instantaneous strain rate of the specimen is obtained in the following form:
a b e f o r e s t r a i n r a t e r e d u c t i o n ( )
n n
1 a σ0 a σ0
= v0
3 3 3
0 A c ρ1 1 1 A c ρ ( )1 b a f t e r s t r a i n r a t e r e d u c t i o n
( )
1 v1- ( a σ / A c ρ )0 n 1 1 1
=
1 + ( A c ρ / A c ρ )
0 2 2 2 1 1 1
a σ0 n
-
3 3 3
A c ρ ( )2
c where V is the initial velocity of the impact bar;0 ρ, and A are the density, bar wave velocity and cross-sectional area, respectively; subscripts 1 and 2 correspond to the impact bar and pressure bar, respectively;
, and are the initial cross-sectional area, a0 0 σn
initial length and instantaneous nominal flow stress of the specimen, respectively. The mass of the specimen is neglected. The true stress is calculated assuming the deformation of the specimen to be uniform.
3. RESULTS AND DISCUSSION
3.1 Flow stress in the wide strain rate and temperature ranges
Measurements were made for 0.01 wt.% C iron.
Specimens were machined to 1.5 or 2.0 mm in both length and diameter from a cold-drawn bar of 3 mm in a diameter. After machining, the specimens were annealed in a vacuum for 1 h at 850 ℃ and furnace cooled, giving a grain size of about 30 μm. First, to evaluate the strain rate and temperature dependenc y of the flow stress in the wide range, compression tests were conducted at temperatures of 79K, 208K, 298K, 373K and 4 73K in the strain rate ranging from about 10-3 ~ 2x10 /s using a4 variety of testing machines noted in Table 1.
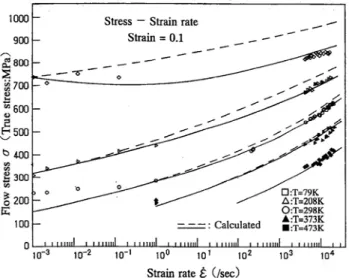
As is seen in Fig. 1, which demonstrates the relations between the flow stress at a given strain of 10% and a logarithm of strain rate, the flow stress observed is dependent strongly on the temperature and strain rate and there are no abrupt change in the flow stress around the strain rate of about 5×10 /s but rather the rise increases3 continuously. In the low strain rate and high temperature ranges, a negative strain rate sensitivity of the flow stress appears, in which the interaction between dislocations and carbons becomes to be explicit. This type of interaction gives rise to a dynamic strain aging. At high strain rates, the time required for deformation is so short that the deformation is a adiabatic, which follows a thermal softening. Particularly, the strain rate dependency of the flow stress at T=79K is relatively low because a specific heat capacity of iron at T=79K is considerably low compared to the values at other test temperatures.
In most materials having a BCC structure the flow s t r e s s for s lip of c rystal i n creases with decreasing
Fig.1 Relation between flow stress and strain rate over the wide strain rate and temperature ranges at a strain of 0.1.
Fig.2 Metallographic observation of specimenestimated at after deformed at =11300/s and T=79K,
ε = 0 . 4
which is transverse section.
temperature, however the flow stress necessary for the twin formation is independent of temperature. Because, at very low temperature such as T=79K, the stress necessary fortwinning is less than that required for slip, and the twinning is the preferred mode of deformation. Figure 2 shows metallographic observation of the cross section perpendicular to a compressive axis in the specimen, which reveals typically mechanical twin. The specimen is compressed at the strain rate of 11700/s and the temperature of 79K and as a result, the strain of about 40%
is produced in the specimen. The area fraction of the mechanical twin detected from the cross-sectional area is about 4%. Assuming a relative amount of the mechanical twin on the cross section at each position along the axis is a constant, the volume fraction of the twinning is 4 % also.
Since a shear strain caused by the formation of twinning is 0.707 in BCC crystal and Schmidt factor is 0.5, the plastic strain produced in the compressive direction is about 2 %.
Contribution of this plastic strain on the total strain in specimen is considered to be negligible small and also, if the volume fraction of twinning is this degree, the blocking effect of it on the dislocation motion could be neglected.
3.2 Strain rate reduction tests
It seems to be very important to confirm the relative importance of the instantaneous strain rate and the strain rate history in the dynamic flow stress at high strain rates in which the flow stress increases even more. Strain rate reduction tests were made by reducing the strain rate by 45
% from about strain rates of 1 ×10 ~1. 6 ×10 /s using the4 4 apparatus devised by Sakino and Shioiri [10 . A typical] result of the strain rate reduction tests at strain rates from 11300 to 6200/s is shown in Fig. 3. In figure, the constant strain rate curve at a strain rate of 11400/s is also shown to indicate the flow stress drop. To evaluate quantitatively the flow stress response to a sudden reduction in strain rate,
σ /σ
the drop ratio " f d" is introduced, where is the flow stress drop caused by the rate reduction and σf
is the flow stress difference between two constant σ
d
strain rate curves at the strain rates before and after the rate reduction. The drop ratio "σ /f σd " is used as a measure which shows the role of the instantaneous strain rate in the dynamic flow stress. The results of the measurements of the flow stress drop caused by the strain rate reduction in the strain rate range from about 1 × 10 ~ 1.6 × 10 /s are summarized in terms of the drop4 4 ratio in Fig. 4. Strains at which the strain rate reduction was imposed were in the range of about 3 0 %. The dot-dashed line shown in the figure shows the average value of the drop ratio, which is almost unity. It seems, therefore, that the effect of the instantaneous strain rate on the dynamic flow stress at high strain rates is dominant.
3 . 3 Analysis on the basis of the thermally activated process
Fig.3 An example of strain rate reduction test at strain rates from 11300 to 6200/s, including constant strain rate test at strain rate of 11400/s.
Fig.4 Ratio of flow stress drop "σf /σd " in strain rate reduction tests conducted in the strain rate ranging from 1×10 ~1. 6 ×10 /s.4 4
The results of the strain rate reduction tests conducted at very high strain rates show that the flow stress depends primarily upon the instantaneous strain rate and the effect of the strain rate history is negligibly small. This means that the strain rate dependency of the flow stress is caused mainly by the rate controlling mechanism of the motion of the dislocation. In the following, analysis is made on the basis of the dislocation kinetics.
a Kink formation model ( )
It is widely known that the deformation of BCC metals is characterized by the high Peierls force. The deformation occurs mainly by the motion of the screw dislocations overcoming the high Peierls potential with the aid of the formation of the kink pair. The kink pair is formed with the aid of the thermal activation, and accordingly it is widely accepted that the strain rate is expressed in the form of the Arrhenius equation:
= 0exp[ - E( τ ) /e kT] ( )3 where is the shear strain rate,0is a constant with a dimension of the strain rate, E( τ )e is the activation energy for formation of the kink pair, τe is the thermal component of the stress, τ is the applied stress,τa is the long range athermal stress. By assuming τa= 49MPa
=135 MPa at strain of 0.1, the value of =
( σa ) τe
(
is determined. k is Boltzman's constant, and T τ - τa
)
is the absolute temperature. The activation energy E( τ) for 150 appm C iron obtained by Aono et al. is used which covers a wide range of the flow stress. Taylor factor M used in a relation of σ =M・ τ is taken to be 2.75, which is generally well known in BCC metals. The value of lo g0is 7.74 which is determined so that a good fit of the calculated curve to the experimental flow stress at T=293K is obtained. As the flow stress of BCC metals is sensitive to the temperature, the correction for temperature is made assuming the adiabatic deformation. The temperature rise ⊿ T in the specimen during the deformation is a function of the flow stress and strain, which is given by the following equation:
η σ d ( )
⊿T = ε 4
ρCp
where ρ is the density, Cp is the specific heat capacity and η is a function of the strain rate. Above about = 4/s, η is taken to be unity in which the deformation is the entirely adiabatic but below the critical strain rate, η decreases exponentially with decreasing strain rate [11 .]
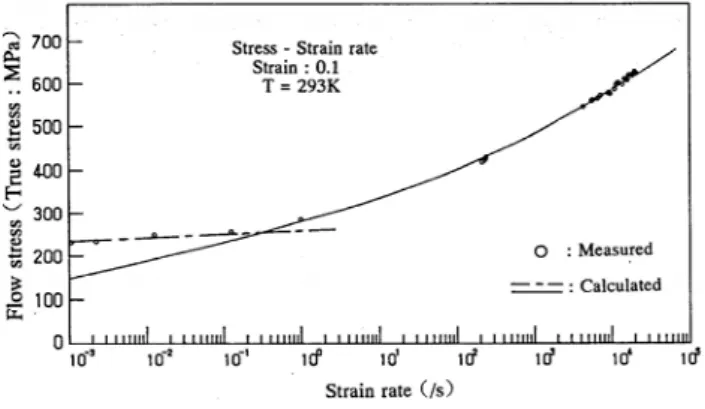
Figure 5 shows the measured values and calculated curves in the present work. The thermal softening
attributable to the adiabatic heating is taken into account in the calculation of σ - log curves shown by the solid line. Included for comparison are the curves shown by the broken line for isothermal deformation, which reveals relatively high strain rate dependency at T=79K. Over the wide range of strain rates and temperatures, the calculated curves shown by the solid line are in a good agreement with directly measured values and further, no steep change in the gradient of σ-log curves is observed at the strain rate of about 5 ×1 0 /s.3
The athermal stress τa is caused by the structure evolution in course of the deformation, but assuming that a is independent of the strain rate and temperature, the τ
above agreement is obtained.
The shape of the curve is determined by the exponential term in Eq. 1 . Therefore, boldly speaking, the rise in the( ) flow stress in the wide strain rates range is governed by the stress dependency of the activation energy of the kink pair generation.
b Dislocation cutting model ( )
In Fig.5, below =10 /sec at T=293K, with-1 decreasing strain rate the difference between the calculated and measured flow stress gradually becomes apparent, sothat a a ppreciable difference is observed between both " dσ/lo g ". It is considered that other drag being different from Peierls potential may be dominant for the m ovemen t of the moving dislocations. Judging from the magnitude of the activation volume associated with the "dσ/d log ", which is
Fig.5 Comparison between measured flow stress and calculated flow s t ress predicted by using E(τ )e over the wide strain rate and temperature ranges at a given strain.
Effect of a diabatic heating on flow stress is taken into consideration. Isothermal curves also shown by broken line.
approximately comparable to that measured on copper 2 being FCC crystal , t h e d o m i n a n t rate [ ]
controllingmechanism seems to be the thermally assisted c utting of the forest dislocations with the moving ones. As shown schematically in Fig.6, the mobile dislocation segments move repeating the thermally assisted cutting of the forest dislocations and the Peierls drag controlled jump motion alternately.
By simplifying the above motion of the dislocation segments as shown in Fig( )b , the rate of the shear strain can be given by the following type equation:
ρdb L
( )
= 5
tt +tv
wherett is the waiting time for the thermally assisted cutting, tv is the time required by one jump motions under the control of the Peierls drag, L is the distance between the adjacent forest dislocations, b is the Burgers vector and ρd is a moving dislocation density. This type of equation has appeared often in other literature 12,13,14 . Below the strain rate of 10 /s, with
[ ] -1
decreasing the strain rate, a time required to overcome the Pierls potential becomes negligibly small compared to the waiting time necessary for cutting the forest dislocations with the aid of thermal activation (i.e. tt ≫tv ) and accordingly, Eq. ( )3 can be approximated as
= ρdb L/( tt +tv)
= ρdbL νexp - U -{ [ τeV /kT] } ( )6 where U is the activation energy of cutting(= Gb /53
15 , V is the activation volume = Lb , is the
[ ] ) ( 2) ν
frequency factor.
This is the thermal activation flow rate-controlled by the thermally assisted cutting of the forest dislocations, in which the flow stress depends linearly upon the logarithm
Fig.6 Kinetic model of dislocation segment motion.
a Loop segment model, b Straight segment model.
( ) ( )
of the strain rate. The used values of the physical constants and quantities are presented in Table 2.
Table 2: Physical constants and quantities of iron used in this experiment
( ) ( ) ( )
G GPa b m υ ( / s ) U J
- 1 0 1 3 -1 9
26.7 2 .8× 1 0 1× 1 0 2 .4×10
The unknown quantities in Eq.( )6 are L andρd.In the present treatment the values of these quantities are determined so that a good fit of the predicted curves to the experimental data is obtained. If L and ρd are independent of the strain rate, L is determined from the gradient of the vs. log plot of the experimental flow stress in the
σ
strain rate range below 10-1 /s where σ is linearly dependent upon log . A value of ρd , which is generally known as the order of 1011 , is determined to obtained a good fit in the stress level. Thus determined L and ρdat T=293K are shown in Table 3:
Table 3: Determined values of Lb ,L and2 ρd
( ) ( )
L m L b ( / s )2 ρd m-2
- 8 - 2 7 11
293K 7 .67× 1 0 3.18× 10 2 .21×10
The σ-log plot predicted by Eq. 6( ) using the above numerical values is shown in Fig. 7 together with the experimental flow stress. In the range below the strain rate of 10 /s, the calculated curve at the temperature of 293K-1 are in a good agreement with directly measured values.
Accordingly, it seems to be controlled by the mechanism of the thermally assisted cutting of the forest dislocations with the moving ones.
Fi g 7 Comparison between measured flow stress and calculated flow stress (dashed line) using dislocation cutting model below strain rate of 10 /s at temperature of-1 293K. Included for comparison are σ- log cu rve solid( line shown in Fig 6.)
4. CONCLUSION
The compression tests were performed for 0.01wt.%C
× ~ ×
iron in the strain rate range from about 1 10-3 2 1 0 /s at temperatures ranging from -79K to 473K.4 Furthermore, strain rate reduction tests were carried out in the high strain rate range above about 1× 10 /s at the4 temperature of 293K. By analysing quantitatively the obtained results on the basis of the dislocation kinetics, it can be concluded that the strain rate dependency of the flow stress of iron at high strainrates and low temperatures is controlled by the dislocation motion which surmounts the Peierls potential barriers with the aid of the thermally activated formation of kink pairs while, in the region below the strain rate of about 1/s at the temperature of 293K, it seems to be controlled by the mechanism of the thermally assisted cutting of the forest dislocations with the moving ones.
References
1 Ferguson W. G., Kumar A., and Dorn J. E., J. Appl.
[ ]
Phys. Vol. 38 (1967 pp. 1863-1869.)
[ ]2 Sakino K. , Journal de Physique IV, (2000) C57-62.
[ ]3 Rosenfield A. R. Harn G. T., ASME., 59 (1966) pp. 962.
4 Campbell, J. D., Ferguson W. G., Phil. Mag., [ ]
1970 63.
( )
5 Tanaka K., Nojima T., Institute of physics, Conf.
[ ]
Ser. No. 47 (1979 pp. 166.)
6 Sakino K. and Shioiri J., Trans. Jpn. Soc. Mech.
[ ]
Eng., Vol. 60, No. 579, A (1994 pp. 2561-2566.) (in Japanese)
[ ]7 Nojima T., J. Soc. Mat. Sci. Vol.35, No.397(1986)
( )
pp.1118-1124. in Japanese
8 Ostwaldt D., Klepaczko J. R. and Klimanek P., [ ]
Journal de Physique IV, Colloque C3, supplement au Journal de Physique III, (1997 , C3-385-390.) 9 Aono,Y. et al., Rep.Res.Inst.Appl.Mechanics, Kyushu [ ]
Univ.,127(1981)pp.24-92.
10 Sakino, K. and Shioiri, J., JOURNAL DE [ ]
PHYSIQUE IV, Colloque C3, supplement au Journal de Physique III, Vol.1, octobre (1991 ,) C3-35-42.
11 Dixon P. R., Parry D. j., JOURNAL DE [ ]
PHYSIQUE IV, Colloque C3, supplement au Journal de Physique III, Vol.1, octobre (1991 ,) C3-85-92.
12 Kumar A. and Kumble R.G., J. Appl. Phy. 40 [ ]
1969 pp.3475-3480.
( )
13 Shioiri J. and Satoh K., JOURNAL DE [ ]
PHYSIQUE, Colloque C5, supplement au n 8,0 Tome 46 (1985 C5-3-10.)
14 Follansbee P.S., Regazzoni G. and Kocks U.F., [ ]
Mechanical Properties at High Rates of Strain (Harding, J. Ed.),Inst. Phys. Conf. Ser. No.70 (1984) pp.71-80.
15 Ashby M. F., Frost H. J., The Kinetics of [ ]
Inelastic Deformation above 0 K, Constitutive Equations in Palsticity, Ed. Argon, A. S., The MIT
Press (1975 pp.117-147.)