*Graduate School of Life and Medical Sciences, Doshisha University, Kyo-tanabe, Kyoto, 610-0321 Telephone; +81-774-65-6439, E-mail; [email protected]
Audiovisual Integration in Mongolian Gerbil Evaluated with Sensory Evoked Potentials
Yuki ITO*, Takafumi FURUYAMA, and Kohta I. KOBAYASI (Received January 19, 2018)
Humans perceive the world by integrating multiple sensory inputs. Audiovisual integration has been studied in standard laboratory rodents, such as rats and mice. However, unlike humans, both species are nocturnal. They have poor visual acuity and their auditory sensitivity to low frequencies (<5 kHz) is significantly worse than that of humans (by at least 20 dB). Therefore, they are unsuitable animal models in which to study audiovisual integration. The Mongolian gerbil, Meriones unguiculatus, has relatively good eyesight and its low-frequency sensitivity is similar to that of humans. Therefore, in this study, we investigated the brain regions related to audiovisual integration around the visual cortex in the Mongolian gerbil. We recorded the sensory evoked potentials (EPs) generated by a visual stimulus alone, an auditory stimulus alone, and synchronized audiovisual stimuli. Each recording site was separated by 1 mm pitch. The similarity of the EP waveforms was evaluated between the audiovisual EP and the sum of the auditory and visual EPs at each recording site. The results showed that the similarity varied depending on the site, and was the lowest around the lateral secondary visual cortex (4 mm lateral and 2 mm anterior to lambda). These results suggest that V2L is associated with audiovisual integration in the gerbil, and that the species is a suitable animal model in which to study the neural basis of audiovisual integration.
.H\ZRUGV:audiovisual integration, Mongolian gerbil, VEP, AEP
,QWURGXFWLRQ
Animals reconstruct the perceptual world by integrating information from the world with different sensory systems within their brains. Multimodal integration reduces the ambiguity of unimodal information, leading to more stable perception. This integration is a very important mechanism, allowing the flexible and appropriate recognition of the outside environment. For example, when combined light and sound stimuli are presented, the reaction times are shorter than when the sound or light stimulus is presented alone1,2). Visual information, such as the
movement of the speaker’s face, help us comprehend acoustically complex sounds (speech) in noisy environments3). Although multimodal integration was thought to occur in higher-order cortices, recent studies have shown that the primary and secondary cortices are also involved in the process in various species (rodents4-6), cat7), ferret8) and monkeys9,10)). Among laboratory rodents, rats and mice are predominantly used to study audiovisual integration. However, their auditory sensitivity in the low frequency range (<5 kHz) is significantly worse than that of humans (by at least 20 dB), and their eyesight is relatively poor because rodents are usually nocturnal.
In this study, we used the Mongolian gerbil, Meriones unguiculatus, as the animal model in which to investigate sensory integration. The gerbil, which belongs to the order Rodentia, is not entirely nocturnal and has relatively good eyesight. Its auditory sensitivity to low frequencies is similar to that of humans11) and it has a large vocalization repertoire12). All these characteristics make the gerbil an appealing animal model in which to study the neural mechanism of audiovisual integration. The purpose of this study was to establish whether the Mongolian gerbil is a useful model for perceptual integration study. As a first step, we investigated the brain region involved in audiovisual integration around the primary visual cortex by measuring the sensory evoked potentials (EPs) to visual, auditory, and combined auditory and visual stimuli.
0DWHULDOVDQG0HWKRGV
2.1 Animal preparation
Three 20–48-week-old Mongolian gerbils, M.
unguiculatus, were used in the experiment. Each animal was kept in an individual cage and allowed free access to food and water. They were maintained on a 12-h light/12-h dark schedule. All husbandry and experimental procedures were approved by the Animal Experiment Committee of Doshisha University.
The experiment was conducted in an acoustically and electrically shielded box. The animals were anesthetized with isoflurane during the experiment. The scalp fur was shaved off and the skin over the cranium was removed. A head post (small metal rod with a flat bottom) was fixed to the top of the exposed cranium with acrylic glue and dental cement. The left cranium, extending from the bregma and lambda and 6 mm lateral to the midline, was removed with drilling, and the cortical surface, including the visual cortex, was exposed.
2.2 Stimuli
A white-light-emitting diode (LED) was used as
the visual stimulus (V). The LED was positioned 5 cm from the right eye of the animal (contralateral to the recording cortex). We presented the auditory stimulus (A) using a sound card (UA-101, Roland Corporation, Japan) and a loudspeaker (ES1, Tucker-Davis Technologies, USA). The loudspeaker was placed 5 cm from the right ear of the animal (contralateral to the recording cortex). The acoustic stimulus was broadband noise (1–70 kHz) and its amplitude was calibrated with a microphone (Type 1, ACO Pacific, Japan) placed at the position of the head. The sound intensity was 80 dB sound pressure level (SPL; 20 μPa). The durations of the visual and auditory stimuli were both 5 ms, with a 1 ms rise/fall time. The presentation of the auditory or visual stimuli alone was designated A or V, respectively; and A and V were also presented simultaneously, designated AV. Each type of stimulus was presented 128 times.
2.3 Recording procedure
A tungsten microelectrode (impedance 200–400 kΩ) was inserted into the visual cortex with a hydraulic micromanipulator (MO-8W, Narishige, Japan). The recordings were made at intracortical depths of ~300 μm.
The electrical signals were amplified with a differential amplifier (DAM80, World Precision Instruments, USA) and filtered with a dual variable filter (0.1–5 kHz; VBF8, Kemo, UK). The recorded signals were stored in a personal computer via an A/D converter (Micro 1401, Cambridge Electronic Design Limited, UK). The head position was calibrated with a midline, and the locations
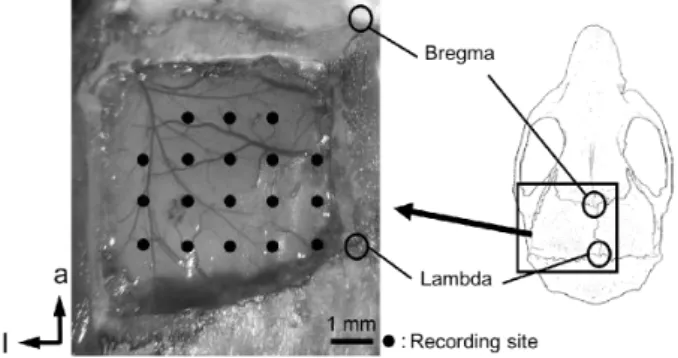
Fig. 1. Recording sites, viewed from above.
The cortical surface, including the visual cortex, was exposed and evoked potential recordings were made at an intracortical depth of
~300 μm.
In this study, we used the Mongolian gerbil, Meriones unguiculatus, as the animal model in which to investigate sensory integration. The gerbil, which belongs to the order Rodentia, is not entirely nocturnal and has relatively good eyesight. Its auditory sensitivity to low frequencies is similar to that of humans11) and it has a large vocalization repertoire12). All these characteristics make the gerbil an appealing animal model in which to study the neural mechanism of audiovisual integration. The purpose of this study was to establish whether the Mongolian gerbil is a useful model for perceptual integration study. As a first step, we investigated the brain region involved in audiovisual integration around the primary visual cortex by measuring the sensory evoked potentials (EPs) to visual, auditory, and combined auditory and visual stimuli.
0DWHULDOVDQG0HWKRGV
2.1 Animal preparation
Three 20–48-week-old Mongolian gerbils, M.
unguiculatus, were used in the experiment. Each animal was kept in an individual cage and allowed free access to food and water. They were maintained on a 12-h light/12-h dark schedule. All husbandry and experimental procedures were approved by the Animal Experiment Committee of Doshisha University.
The experiment was conducted in an acoustically and electrically shielded box. The animals were anesthetized with isoflurane during the experiment. The scalp fur was shaved off and the skin over the cranium was removed. A head post (small metal rod with a flat bottom) was fixed to the top of the exposed cranium with acrylic glue and dental cement. The left cranium, extending from the bregma and lambda and 6 mm lateral to the midline, was removed with drilling, and the cortical surface, including the visual cortex, was exposed.
2.2 Stimuli
A white-light-emitting diode (LED) was used as
the visual stimulus (V). The LED was positioned 5 cm from the right eye of the animal (contralateral to the recording cortex). We presented the auditory stimulus (A) using a sound card (UA-101, Roland Corporation, Japan) and a loudspeaker (ES1, Tucker-Davis Technologies, USA). The loudspeaker was placed 5 cm from the right ear of the animal (contralateral to the recording cortex). The acoustic stimulus was broadband noise (1–70 kHz) and its amplitude was calibrated with a microphone (Type 1, ACO Pacific, Japan) placed at the position of the head. The sound intensity was 80 dB sound pressure level (SPL; 20 μPa). The durations of the visual and auditory stimuli were both 5 ms, with a 1 ms rise/fall time. The presentation of the auditory or visual stimuli alone was designated A or V, respectively; and A and V were also presented simultaneously, designated AV. Each type of stimulus was presented 128 times.
2.3 Recording procedure
A tungsten microelectrode (impedance 200–400 kΩ) was inserted into the visual cortex with a hydraulic micromanipulator (MO-8W, Narishige, Japan). The recordings were made at intracortical depths of ~300 μm.
The electrical signals were amplified with a differential amplifier (DAM80, World Precision Instruments, USA) and filtered with a dual variable filter (0.1–5 kHz; VBF8, Kemo, UK). The recorded signals were stored in a personal computer via an A/D converter (Micro 1401, Cambridge Electronic Design Limited, UK). The head position was calibrated with a midline, and the locations
Fig. 1. Recording sites, viewed from above.
The cortical surface, including the visual cortex, was exposed and evoked potential recordings were made at an intracortical depth of
~300 μm.
of the recording sites in the left hemisphere were placed at intervals of 1 mm, based on the lambda and midline (Fig. 1). The lambda was used as a reference point following previous studies, including ours6). The distance between the bregma and lambda varied less than 500 μm between subject animals.
2.4 Data analysis
The sensory EPs to the auditory stimulus and visual stimulus were designated AEP and VEP, respectively, and the evoked potential to the multimodal stimulus (AV) was designated AVEP. The evoked potentials were averaged over the 128 repetitions of each stimulus (A, V, or AV), and both the latency and amplitude of the responses to the stimuli were quantified with a custom-made program (MATLAB, Mathworks, USA). To investigate the multisensory interactions, the waves of AEP and VEP were summed to create (A+V)EP, which was compared with AVEP. The waveform similarity between (A+V)EP and AVEP at each recording site was quantified as the correlation coefficient between the two waveforms. These similarity values were used to determine the cortical region involved in audiovisual integration.
5HVXOWV
The evoked potentials to unimodal stimuli (AEP and VEP) and the multimodal stimuli (AVEP) at selected recording sites are shown in Fig. 2.
The EPs elicited by the auditory stimulus (AEPs) were characterized by the typical auditory components,
Fig. 3. Audiovisual interaction around the visual cortex.
The color scale represents the correlation coefficients between AVEP and (A+V)EP. The data represents the average of all subjects. The similarity varied, depending on the site, and was the lowest around V2L (4 mm lateral and 2 mm anterior to lambda), suggesting that this site is involved in audiovisual integration.
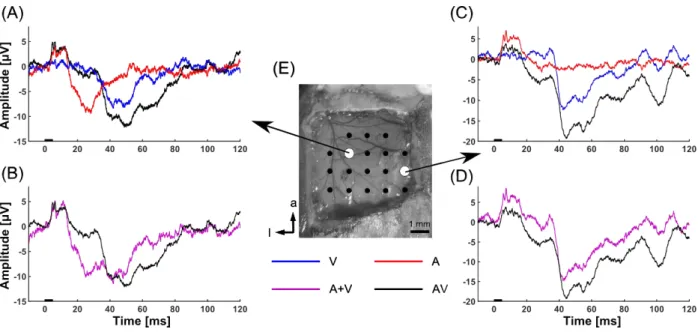
Fig. 2. Representative sensory evoked potentials to uni- and multimodal stimuli from a subject.
The black bars on the abscissa in A–D indicate the time of stimulation. Wave forms of AEP, VEP, and AVEP at different recording sites (shown in E) are shown in A and C. The waveform of A+V (sum of AEP and VEP) is shown in B and D with the corresponding AVEP. See the main text for detail.
i.e., multiple positive peaks within 10 ms from stimulus onset. The EPs elicited by V (VEPs) were characterized by negative peaks at 40–60 ms after stimulus presentation. In AVEP, both the early positive peaks and late negative peaks corresponding to AEP and VEP, respectively, were observed. Figure 2b and 2d show the waveforms of AVEP and (A+V)EP. The similarity between the (A+V)EP and AVEP waveforms at each recording site is shown in Fig. 3. The waveform similarity at a position 4 mm lateral and 2 mm anterior to lambda (Fig. 2a and 2c) was lower than those at the other positions. In all subjects, the similarity was the lowest at the region, and was less than 0.6.
'LVFXVVLRQ
We recorded the sensory evoked potentials around a wide cortical region that included the visual cortex of the Mongolian gerbil when uni- and multimodal stimuli were presented, to identify the cerebral region involved in sensory integration based on the EP similarities.
The waveform similarity was low in one particular area: 4 mm lateral and 2 mm anterior to lambda (Fig. 3). This result indicates that at that site, the multimodal stimuli evoked cortical processing that did not arise during unimodal stimulation.
This suggests that the visual and auditory information interacted and produced a measurable difference in the evoked potential. This result is consistent with previous reports indicating that the multimodal response is not equivalent to the linear sum of the unimodal responses in the multisensory cortex13). The region in which this similarity was lowest corresponded to V2L in this experiment, based on the brain atlas of the gerbil14). In previous studies of the rat, the lateral secondary visual cortex (V2L) was reported to be one of the multisensory regions that respond to visual and auditory stimuli15). Together with our result, this suggests that V2L is an important area for audiovisual integration in rodents in general.
Neuroanatomical studies have shown that the primary visual cortex of the gerbil is directly connected to several nonauditory sensory cortices, including visual-related areas16). However, it is unclear whether V2L, which was identified as an important area in this and previous studies, is directly connected to the auditory cortex. Further studies are required to identify the neuroanatomical basis of the audiovisual interaction at V2L. It should also be noted that the functional or behavioral significance of this interaction is puzzling and must be addressed in future research.
In conclusion, our data suggest that V2L is a brain region involved in audiovisual interaction in the Mongolian gerbil, and demonstrate that the gerbil can be used as a model animal in which to study audiovisual integration.
5HIHUHQFHV
1) M. Hershenson, “Reaction Time as a Measure of Intersensory Facilitation”, J. Exp. Psychol., 63 [3], 289–293 (1962).
2) S. Sakata, T. Yamamori, and Y. Sakurai, “Behavioral Studies of Auditory-Visual Spatial Recognition and Integration in Rats”, Exp. Brain Res., 159 [4], 409–417 (2004).
3) L. A. Ross, D. Saint-Amour, V. M. Leavitt, D. C. Javitt, and J. J. Foxe, “Do You See What I Am Saying?
Exploring Visual Enhancement of Speech Comprehension in Noisy Environments”, Cereb. Cortex, 17 [5], 1147–1153 (2007).
4) M. T. Wallace, R. Ramachandran, and B. E. Stein, “A Revised View of Sensory Cortical Parcellation”, Proc.
Natl. Acad. Sci., 101 [7], 2167–2172 (2004).
5) C. Kayser, C. I. Petkov, and N. K. Logothetis, “Visual Modulation of Neurons in Auditory Cortex”, Cereb.
Cortex, 18 [7], 1560–1574 (2008).
6) K. I. Kobayasi, Y. Suwa, and H. Riquimaroux,
“Audiovisual Integration in the Primary Auditory Cortex of an Awake Rodent”, Neurosci. Lett., 534 [1], 24–29 (2013).
7) D. W. Royal, B. N. Carriere, and M. T. Wallace,
“Spatiotemporal Architecture of Cortical Receptive Fields and Its Impact on Multisensory Interactions”, Exp. Brain
Res., 198 [2–3], 127–136 (2009).
8) J. K. Bizley, F. R. Nodal, V. M. Bajo, I. Nelken, and A. J.
King, “Physiological and Anatomical Evidence for Multisensory Interactions in Auditory Cortex”, Cereb.
Cortex, 17 [9], 2172–2189 (2007).
9) C. Kayser, C. I. Petkov, M. Augath, and N. K. Logothetis,
“Integration of Touch and Sound in Auditory Cortex”, Neuron, 48 [2], 373–384 (2005).
10) Y. Wang, S. Celebrini, Y. Trotter, and P. Barone,
“Visuo-Auditory Interactions in the Primary Visual Cortex of the Behaving Monkey: Electrophysiological Evidence”, BMC Neurosci., 9 [1], 79 (2008).
11) A. Ryan, “Hearing Sensitivity of the Mongolian Gerbil, Meriones Unguiculatis”, J. Acoust. Soc. Am., 59 [5], 1222–1226 (1976).
12) K. I. Kobayasi and H. Riquimaroux, “Classification of Vocalizations in the Mongolian Gerbil, Meriones Unguiculatus”, J. Acoust. Soc. Am., 131 [2], 1622–1631 (2012).
13) D. S. Barth, N. Goldberg, B. Brett, and S. Di, “The Spatiotemporal Organization of Auditory, Visual, and Auditory-Visual Evoked Potentials in Rat Cortex”, Brain Res., 678 [1–2], 177–190 (1995).
14) S. Radtke-Schuller, G. Schuller, F. Angenstein, O. S.
Grosser, J. Goldschmidt, and E. Budinger, “Brain Atlas of the Mongolian Gerbil (Meriones Unguiculatus) in CT/MRI-Aided Stereotaxic Coordinates”, Brain Struct.
Funct., 221 [1], 1-272 (2016).
15) J. Hirokawa, M. Bosch, S. Sakata, Y. Sakurai, and T.
Yamamori, “Functional Role of the Secondary Visual Cortex in Multisensory Facilitation in Rats”, Neuroscience, 153 [4], 1402–1417 (2008).
16) J. U. Henschke, T. Noesselt, H. Scheich, and E. Budinger,
“Possible Anatomical Pathways for Short-Latency Multisensory Integration Processes in Primary Sensory Cortices”, Brain Struct. Funct., 220 [2], 955–977 (2015).