JHOSPITALIST network
「腎結石症疑いには
、
エコーか
CT
か」
2016
年年6⽉月29⽇日
担当者 筑波⼤大学附属病院 総合診療療科
五⼗十野博基
Ultrasonography versus Computed Tomography
for Suspected Nephrolithiasis
N Engl J Med 2014;371:1100-‐10.
PMID: 25229916
水戸協同病院モデル:!
チーフレジデントからみた!
症例:
43歳男性
主訴:右下腹部痛
現病歴:受診前日の昼、結婚式に参加した。
18時頃よ
り腹痛を自覚した。下痢・嘔吐なし。腹痛は右下腹部痛
で数十分周期で数十分続く痛み。VAS
9/10。受診当日
排便あり。疼痛続くため、朝
ERを受診した。
アレルギーなし、
内服:降圧薬、糖尿病の薬
既往歴:DM
(+),HT(+),HL(+),不整脈なし
5年前に左尿路結石で入院あり。
バイタル:BT
36.3℃、BP104/67mmHg、HR 86 reg
冷汗あり、腹部圧痛なし、CVA叩打痛なし、
尿検査:尿潜血
3+
‣疑問
結石の既往があり、血尿もある。
尿管結石症を第一に疑う。
EBMの実践 5 steps
Step1 疑問の定式化(PICO)
Step2 論文の検索
Step3 論文の批判的吟味
Step4 症例への適用
Step5 Step1-4の見直し
Step 1疑問の定式化(PICO)
P:
尿尿管結⽯石疑い
I:
腹部エコー、レントゲン
C:
腹部CT
Step 2論論⽂文の検索索②
1次研究(primary studies)PubMedを利利⽤用
"Nephrolithiasis"[Mesh] AND
("ultrasonography"[Subheading] OR
"ultrasonography"[All Fields] OR
"ultrasonography"[MeSH Terms]) AND
Randomized Controlled Trial[ptyp]
29
件中1件⽬目に
T h e ne w e ngl a nd jou r na l o f m e dicine
n engl j med 371;12 nejm.org september 18, 2014
1100
Original Article
The authors’ full names, academic degrees, and affiliations are listed in the Appendix. Address reprint requests to Dr. Smith-Bindman at rebecca.smith-bindman@ucsf .edu.
N Engl J Med 2014;371:1100-10. DOI: 10.1056/NEJMoa1404446
Copyright © 2014 Massachusetts Medical Society.
BACKGROUND
There is a lack of consensus about whether the initial imaging method for patients with suspected nephrolithiasis should be computed tomography (CT) or ultrasonog-raphy.
METHODS
In this multicenter, pragmatic, comparative effectiveness trial, we randomly assigned patients 18 to 76 years of age who presented to the emergency department with suspected nephrolithiasis to undergo initial diagnostic ultrasonography performed by an emergency physician (point-of-care ultrasonography), ultrasonography per-formed by a radiologist (radiology ultrasonography), or abdominal CT. Subsequent management, including additional imaging, was at the discretion of the physician. We compared the three groups with respect to the 30-day incidence of high-risk diagnoses with complications that could be related to missed or delayed diagnosis and the 6-month cumulative radiation exposure. Secondary outcomes were serious adverse events, related serious adverse events (deemed attributable to study par-ticipation), pain (assessed on an 11-point visual-analogue scale, with higher scores indicating more severe pain), return emergency department visits, hospitalizations, and diagnostic accuracy.
RESULTS
A total of 2759 patients underwent randomization: 908 to point-of-care ultrasonog-raphy, 893 to radiology ultrasonogultrasonog-raphy, and 958 to CT. The incidence of high-risk diagnoses with complications in the first 30 days was low (0.4%) and did not vary according to imaging method. The mean 6-month cumulative radiation exposure was significantly lower in the ultrasonography groups than in the CT group (P<0.001). Serious adverse events occurred in 12.4% of the patients assigned to point-of-care ultrasonography, 10.8% of those assigned to radiology ultrasonography, and 11.2% of those assigned to CT (P = 0.50). Related adverse events were infrequent (inci-dence, 0.4%) and similar across groups. By 7 days, the average pain score was 2.0 in each group (P = 0.84). Return emergency department visits, hospitalizations, and diag-nostic accuracy did not differ significantly among the groups.
CONCLUSIONS
Initial ultrasonography was associated with lower cumulative radiation exposure than initial CT, without significant differences in high-risk diagnoses with com-plications, serious adverse events, pain scores, return emergency department visits, or hospitalizations. (Funded by the Agency for Healthcare Research and Quality; ClinicalTrials.gov number, NCT01451931.)
ABS TR ACT
Ultrasonography versus Computed
Tomography for Suspected Nephrolithiasis
R. Smith-Bindman, C. Aubin, J. Bailitz, R.N. Bengiamin, C.A. Camargo, Jr., J. Corbo, A.J. Dean, R.B. Goldstein, R.T. Griffey, G.D. Jay, T.L. Kang, D.R. Kriesel,
O. J. Ma, M. Mallin, W. Manson, J. Melnikow, D.L. Miglioretti, S.K. Miller, L.D. Mills, J.R. Miner, M. Moghadassi, V.E. Noble, G.M. Press, M.L. Stoller,
V.E. Valencia, J. Wang, R.C. Wang, and S.R. Cummings
The New England Journal of Medicine
Downloaded from nejm.org at UNIVERSITY OF TSUKUBA LIBRARY on April 7, 2015. For personal use only. No other uses without permission. Copyright © 2014 Massachusetts Medical Society. All rights reserved.
研究デザイン
前向き、無作為化試験で、盲検化はされてい
ない研究である。⽶米国15の多施設で⾏行行われ
た。論論⽂文の概要は、
P 腎結石症の疑いで救急受診
I 救急医によるベッドサイドでの腹部エコー
C 放射線科による腹部エコー
C 腹部単純CT
O Primary①診断の遅れ/見落としの結果、合併症を伴う
高リスク疾患と
30日以内に診断
②6ヶ月以内の総被曝量
背景
ベッドサイドでの超音波検査
(
Point-‐of-‐Care US
)(POCUS)が
様々な領域で注目されている。腎結石診断のほか、外傷
の
FASTや、新しいところではショックの鑑別にRUSH
Exam(Pump-‐Tank-‐Pipesを評価)
Emerg Med J. 2013 Jan;30(1):3-‐8.
N Engl J Med 2011;364:749-‐57.
to as “the tank.” Placement of the probe in the sub-xiphoid position, along both the long and short axis of the inferior vena cava (IVC), will allow correct determination of the size of the vessel. Looking at the respiratory dynamics of the IVC will provide an assessment of the patient’s volume status to answer the clinical question, “how full is the tank?”33–38 The clinician can also place a
trans-ducer on the internal jugular veins to view their size and changes in diameter with breathing to further assess volume.39,40Also included in
evalu-ation of the tank is an assessment of the lung, pleural cavity, and abdominal cavities for pathology that could signal a compromised vascular volume. Integration of lung ultrasound techniques can quickly allow the clinician to iden-tify a pneumothorax, which in the hypotensive patient may represent a tension pneumothorax requiring immediate decompression. Tension pneumothorax presumably limits venous return into the heart due to increased pressure within the chest cavity.41,42 The lung can also be
exam-ined for ultrasonic B lines, a potential sign of volume overload and pulmonary edema.43,44 The
clinician can further examine the thoracic cavity for a pleural effusion. Last, the clinician can perform a FAST exam (Focused Assessment with Sonography in Trauma examination), to look for fluid in the abdomen, indicating a source for “loss of fluid from the tank.”
The third and final part of the shock ultrasound protocol is evaluation of the large arteries and
veins of the body, referred to as “the pipes.” Clini-cians should answer the clinical question “are the pipes ruptured or obstructed” by first evaluating the arterial side of the vascular system to specifi-cally examine the abdominal and thoracic aorta for an aneurysm or dissection. Next the clinician should turn to evaluation of the venous side of the vascular system. The femoral and popliteal veins can be examined with a high frequency linear array transducer for compressibility. Lack of full venous compression with direct pressure is highly suggestive of a deep venous thrombosis (DVT).45–47Presence of a venous thrombus in the
hypotensive patient may signal a large pulmonary thromboembolus.
RUSH Protocol: Step 1—Evaluation of the Pump
Focused echocardiography is a skill that is readily learned by the EP and the use of this application has been supported by a recent consensus docu-ment developed by colleagues in Emergency Medicine and Cardiology.48 Imaging of the heart
usually involves 4 views. The traditional views of the heart for bedside echocardiography are the parasternal long- and short-axis views, the subxi-phoid view, and the apical 4-chamber view (Fig. 1). The parasternal views are taken with the probe positioned just left of the sternum at inter-costal space 3 or 4. The subxiphoid 4-chamber view is obtained with the probe aimed up toward
Table 1
Rapid Ultrasound in SHock (RUSH) protocol: ultrasonographic findings seen with classic shock states
RUSH
Evaluation Hypovolemic Shock Cardiogenic Shock Obstructive Shock Distributive Shock
Pump Hypercontractile heart
Small chamber size
Hypocontractile heart Dilated heart Hypercontractile heart Pericardial effusion Cardiac tamponade RV Strain Cardiac thrombus Hypercontractile heart (early sepsis) Hypocontractile
heart (late sepsis) Tank Flat IVC
Flat jugular veins Peritoneal fluid (fluid loss) Pleural fluid (fluid loss) Distended IVC Distended jugular veins Lung rockets (pulmonary edema)
Pleural fluid (effusions) Peritoneal fluid (ascites) Distended IVC Distended jugular veins Absent lung sliding (pneumothorax)
Normal or small IVC (early sepsis) Peritoneal fluid
(peritonitis) Pleural fluid
(empyema)
Pipes Abdominal aneurysm Aortic dissection
Normal DVT Normal
Abbreviations: DVT, deep venous thrombosis; IVC, inferior vena cava; RV, right ventricle.
The RUSH Exam 257
背景
腎結石症疑いへの腹部
CTの使用頻度は10年で10倍
しかし、
CTが予後改善に繋がるかは不明
コスト、被曝、時間の問題もある
Acad Emerg Med. 2011 July ; 18(7): 699–707
Ultrasound Q. 2012 Sep;28(3):227-‐33
腎結石症の疑いがある患者に対する初回画
像検査法は、
CT と超音波検査のどちらにす
‣ Inclusion criteria
• 2011
年年10⽉月から2013年年2⽉月
• 18-‐76
歳で腹痛、側腹部痛あり
•
救急医が腎結⽯石を除外するために画像を
‣Exclusion criteria
•
重⼤大な他の診断のリスクが⾼高いと医師が判断し
た場合(例例えば胆嚢炎、⾍虫垂炎、⼤大動脈瘤、腸
管の病気)
•
妊婦
•
肥満:男性129kg以上、⼥女女性113kg以上
•
⽚片腎、腎移植後、透析中
‣介⼊入 IntervenVon
• Point-‐of-‐care ultrasound
(
ベッドサイドエコー)
:
トレーニングを受けた救急医が施⾏行行
• Radiology ultrasound
:ガイドライン
‣⽐比較 Comparison
Outcome
:Primary Endpoints
①診断過誤あるいは診断の遅れに関連して起こり得る,合併
症を伴う高リスク診断
high-‐risk diagnoses with complica_ons
that could be related to missed or delayed diagnoses
具体的には、腹部大動脈瘤の破裂、敗血症を呈する肺炎、膿
瘍または敗血症を呈する憩室炎、腸管虚血または穿孔、腎梗
塞、膿瘍を呈する腎結石、尿性敗血症または菌血症を呈する
腎盂腎炎、壊死を有する卵巣捻転、虚血のある大動脈解離と
定義
②6ヶ月以内の総被曝量
③総コスト(まだ調査中で、今回は述べられていない)
追加の画像検査 を含むその後の管理は医師の判断に任せた
.
Outcome
:Secondary Endpoints
重篤な有害事象、試験参加による重篤な有害事象
疼痛、救急再受診、入院、痛み、腎結石の診断精度
重篤な有害事象とは、死亡、重症、入院が必要、障害を
きたす、早期に診断していれば避けられた薬物治療、手術
その他インターベンション。
患者は、ランダム化から
3,7,30,90日後に、これらoutcome
評価のため来院し、健康状態や受けた医療に関して構造
化面接で評価された。
‣倫倫理理的配慮
全ての患者へのICと倫倫理理委員会の承認を得てい
る。
Commibee on Human Research and the ins_tu_onal
review board at each par_cipa_ng site approved the
study. All par_cipants gave wriben informed
治療療に関する論論⽂文のユーザーズガイド
①結果は妥当か
介⼊入群と対照群は同じ予後で開始したか
患者はランダム割り付けされていたか
ランダム化割り付けは隠蔽化(concealment)されていたか
既知の予後因⼦子は群間で似ていたか=base lineは同等か
研究の進⾏行行とともに
、
予後のバランスは維持されたか
研究はどの程度度盲検化されていたか(⼀一重〜~四重盲検)
研究完了了時点で両群は
、
予後のバランスがとれていたか
追跡は完了了しているか=追跡率率率・脱落落率率率はどうか
患者はIntention to treat解析されたか
介入群と対照群は同じ予後で開始
したか
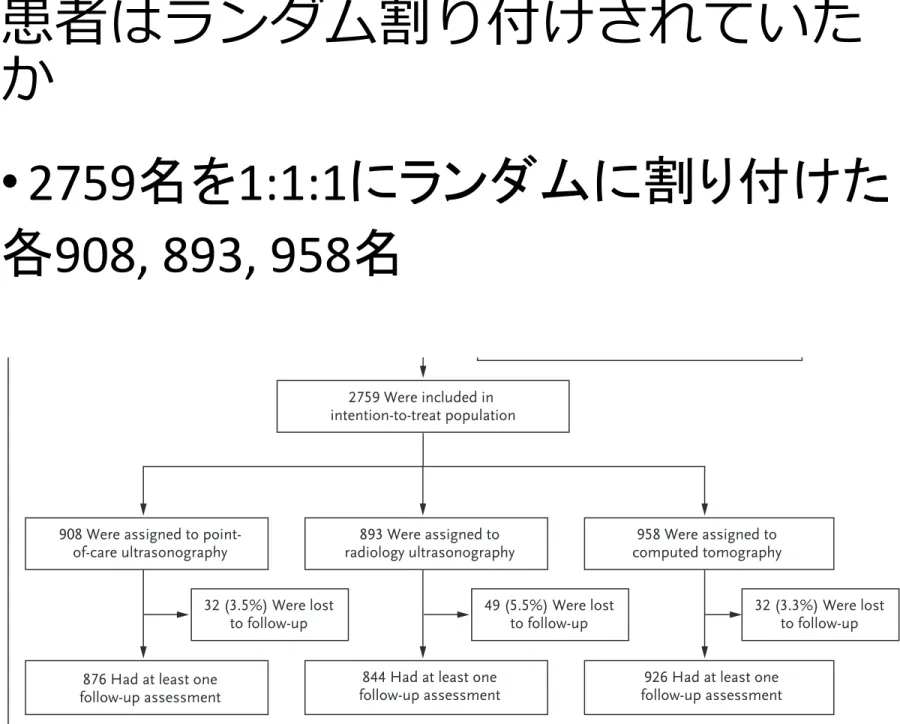
患者はランダム割り付けされていた
か
•
2759名を1:1:1にランダムに割り付けた
各
908, 893, 958名
1103
ultrasonography vs. ct for suspected nephrolithiasis
n engl j med 371;12 nejm.org september 18, 2014
groups of 5% for events with a prevalence of 10%, 0.34% for events with a prevalence of 0.5%, and 0.14 SD for radiation exposure. Our target sam-ple size was 2500 patients. We used SAS software, version 9.4, for all the analyses.
R esults
Patients
We screened 3638 patients, of whom 3100 were considered to be eligible. A total of 2776 patients underwent randomization; however, 17 of those patients were excluded before the baseline data collection (Fig. 1), with the result that data were collected for 2759 patients (89% of eligible pa-tients). We randomly assigned 908 patients to point-of-care ultrasonography, 893 to radiology ultrasonography, and 958 to CT (Fig. 1). The base-line characteristics of the study population are shown in Table 1. The mean pain scores at enroll-ment and the proportion of patients admitted
di-rectly to the hospital from the emergency depart-ment did not differ significantly among the groups, suggesting that the severity of illness was simi-lar in the three groups. A total of 113 patients (4.1%) were lost to follow-up, with no significant variation according to study group (Fig. 1).
The medical history, laboratory values, and physical examination findings for the enrolled patients and the emergency department physi-cians’ assessment of the likelihood of various di-agnoses are shown in Table 2. There were no significant differences according to study group. Overall, 41.6% of the patients had a history of kidney stones, 63.3% had hematuria, and 52.5% had costovertebral-angle tenderness, whereas a small minority had physical examination findings suggestive of acute cholecystitis (1.3%) or appen-dicitis (3.6%) or were judged by the enrolling physician to be at high risk for aortic aneurysm (0.8%), appendicitis (3.1%), or bowel obstruction or ischemia (3.6%).
Figure 1. Screening, Randomization, and Follow-up.
2776 Underwent randomization 3638 Patients were assessed for eligibility
229 Were ineligible
309 Declined to participate before eligibility confirmed 324 Were eligible, but declined to participate
2759 Were included in intention-to-treat population
17 Withdrew before any data collected 1 Underwent point-of-care ultrasonography 8 Underwent radiology ultrasonography 8 Underwent computed tomography
908 Were assigned to
point-of-care ultrasonography computed tomography958 Were assigned to
32 (3.3%) Were lost to follow-up 32 (3.5%) Were lost
to follow-up 49 (5.5%) Were lostto follow-up 876 Had at least one
follow-up assessment
926 Had at least one follow-up assessment 893 Were assigned to
radiology ultrasonography
844 Had at least one follow-up assessment
The New England Journal of Medicine
Downloaded from nejm.org at UNIVERSITY OF TSUKUBA LIBRARY on April 7, 2015. For personal use only. No other uses without permission. Copyright © 2014 Massachusetts Medical Society. All rights reserved.
ランダム割り付けは隠蔽化され
ていたか
Ranuni関数を用いた乱数表を使用
Randomiza_on was performed with the use of
the RANUNI func_on in SAS sodware at the
既知の予後因⼦子は群間で似ていたか
1104
T h e ne w e ngl a nd jou r na l o f m e dicine
n engl j med 371;12 nejm.org september 18, 2014
High-Risk Diagnoses with Complications
High-risk diagnoses with complications during the first 30 days after randomization were recorded in 11 patients (0.4%) — 6 patients (0.7%) assigned to point-of-care ultrasonography, 3 (0.3%) assigned to radiology ultrasonography, and 2 (0.2%) as-signed to CT — with no significant difference according to study group (P = 0.30) (Table 3). Additional information on the patients who had high-risk diagnoses with complications is provided in Table S2 in the Supplementary Appendix.
Radiation Exposure
Over the course of the 6-month study period, the average cumulative radiation exposures were sig-nificantly lower in patients assigned to point-of-care ultrasonography and radiology
ultrasonogra-phy than in those assigned to CT (10.1 mSv and 9.3 mSv, respectively, vs. 17.2 mSv; P<0.001). This dif-ference is attributable to the imaging performed at the baseline emergency department visit (Table 3).
Serious Adverse Events
There were no significant differences among the study groups in the number of patients with serious adverse events (Table 3): 113 of 908 pa-tients (12.4%) assigned to point-of-care ultraso-nography, 96 of 893 (10.8%) assigned to radiology ultrasonography, and 107 of 958 (11.2%) assigned to CT (P = 0.50). A total of 466 serious adverse events occurred in these 316 patients; 426 (91.4%) were hospitalizations during the follow-up peri-od, and 123 (26.4%) involved surgical treatment or complications of urinary stone disease.
Characteristic Point-of-Care Ultrasonography (N = 908) Radiology Ultrasonography (N = 893) Computed Tomography (N = 958)
Female sex — no. (%) 443 (48.8) 416 (46.6) 472 (49.3)
Age Mean — yr 40.1±12.4 40.4±12.8 40.7±12.8 Distribution — no. (%) 18–30 yr 250 (27.5) 240 (26.9) 253 (26.4) 31–40 yr 222 (24.4) 223 (25.0) 231 (24.1) 41–50 yr 223 (24.6) 217 (24.3) 225 (23.5) 51–64 yr 197 (21.7) 191 (21.4) 221 (23.1) 65–76 yr 16 (1.8) 22 (2.5) 28 (2.9)
Race or ethnic group — no. (%)†
Non-Hispanic white 369 (40.6) 369 (41.3) 390 (40.7) Black 236 (26.0) 213 (23.9) 241 (25.2) Asian 35 (3.9) 39 (4.4) 51 (5.3) Native American 12 (1.3) 8 (0.9) 18 (1.9) Pacific Islander 1 (0.1) 1 (0.1) 4 (0.4) Hispanic 218 (24.0) 224 (25.1) 226 (23.6) Mixed or other 32 (3.5) 33 (3.7) 23 (2.4) Data missing 5 (0.6) 5 (0.6) 5 (0.5)
Self-reported pain score‡ 8.3±2.0 8.0±2.4 8.1±2.2
Hospital admission directly from emergency
department — no. (%) 73 (8.0) 77 (8.6) 86 (9.0)
* Plus–minus values are means ±SD. The data exclude the 17 patients who withdrew from the study after randomization but before any baseline data were collected. There were no significant differences among the groups in any characteris-tic listed here.
† Race or ethnic group was self-reported.
‡ Pain was assessed on an 11-point visual-analogue scale, with higher scores indicating more severe pain. Table 1. Baseline Characteristics of the Study Participants.*
The New England Journal of Medicine
Downloaded from nejm.org at UNIVERSITY OF TSUKUBA LIBRARY on April 7, 2015. For personal use only. No other uses without permission. Copyright © 2014 Massachusetts Medical Society. All rights reserved.
‣2群間に差はない
(Table1の下部にno significantと記載)
• 女性約半数、白人4割、4割に腎結
石既往、6割に血尿、5割に
CVA叩打
痛あり
差とは違うが、
• 心血管リスクの高い患者が少なそう
である。糖尿病は1割で、高血圧が3
割、他は不明
•
40歳以下の若年者が半数で、65歳
以上は
2%しかいない
研究の進行とともに
、
予後のバラ
ンスは維持されたか
研究はどの程度度盲検化されて
いたか
• 盲検化は、患者・医療者ともにされていな
い
•
Pa_ents and providers were aware of the
imaging method to which the pa_ents had
been assigned.
研究完了時点で両群は
、
予後の
バランスがとれていたか
追跡は完了了しているか
患者は、ランダム割り付けされた集団において解析さ
れたか
•
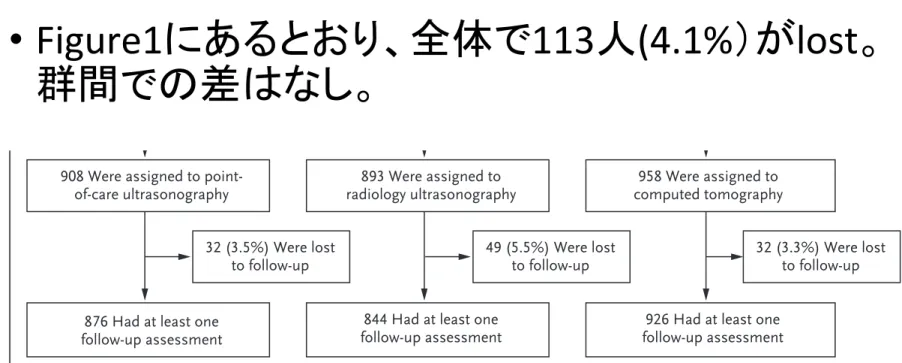
Figure1にあるとおり、全体で113人(4.1%)がlost。
群間での差はなし。
• 解析はinten_on-‐to-‐treat principle
1103ultrasonography vs. ct for suspected nephrolithiasis
n engl j med 371;12 nejm.org september 18, 2014
groups of 5% for events with a prevalence of 10%, 0.34% for events with a prevalence of 0.5%, and 0.14 SD for radiation exposure. Our target sam-ple size was 2500 patients. We used SAS software, version 9.4, for all the analyses.
R esults
Patients
We screened 3638 patients, of whom 3100 were considered to be eligible. A total of 2776 patients underwent randomization; however, 17 of those patients were excluded before the baseline data collection (Fig. 1), with the result that data were collected for 2759 patients (89% of eligible pa-tients). We randomly assigned 908 patients to point-of-care ultrasonography, 893 to radiology ultrasonography, and 958 to CT (Fig. 1). The base-line characteristics of the study population are shown in Table 1. The mean pain scores at enroll-ment and the proportion of patients admitted
di-rectly to the hospital from the emergency depart-ment did not differ significantly among the groups, suggesting that the severity of illness was simi-lar in the three groups. A total of 113 patients (4.1%) were lost to follow-up, with no significant variation according to study group (Fig. 1).
The medical history, laboratory values, and physical examination findings for the enrolled patients and the emergency department physi-cians’ assessment of the likelihood of various di-agnoses are shown in Table 2. There were no significant differences according to study group. Overall, 41.6% of the patients had a history of kidney stones, 63.3% had hematuria, and 52.5% had costovertebral-angle tenderness, whereas a small minority had physical examination findings suggestive of acute cholecystitis (1.3%) or appen-dicitis (3.6%) or were judged by the enrolling physician to be at high risk for aortic aneurysm (0.8%), appendicitis (3.1%), or bowel obstruction or ischemia (3.6%).
Figure 1. Screening, Randomization, and Follow-up.
2776 Underwent randomization 3638 Patients were assessed for eligibility
229 Were ineligible
309 Declined to participate before eligibility confirmed 324 Were eligible, but declined to participate
2759 Were included in intention-to-treat population
17 Withdrew before any data collected 1 Underwent point-of-care ultrasonography 8 Underwent radiology ultrasonography 8 Underwent computed tomography
908 Were assigned to
point-of-care ultrasonography computed tomography958 Were assigned to
32 (3.3%) Were lost to follow-up 32 (3.5%) Were lost
to follow-up 49 (5.5%) Were lostto follow-up 876 Had at least one
follow-up assessment
926 Had at least one follow-up assessment 893 Were assigned to
radiology ultrasonography
844 Had at least one follow-up assessment
The New England Journal of Medicine
Downloaded from nejm.org at UNIVERSITY OF TSUKUBA LIBRARY on April 7, 2015. For personal use only. No other uses without permission. Copyright © 2014 Massachusetts Medical Society. All rights reserved.