1.はじめに
PM テフラ層は富山県氷見地域の鮮新統阿尾層に挟 在する珪長質テフラである(渡辺,1990)。PMテフラ 層は新潟県の浜忠層に挟在する善久院パミス質テフラ 層(Znpテフラ層:Kurokawa and Tomita,1998),愛知 県及び三重県の東海層群に挟在する大田テフラ層(中 山・吉川,1995),房総半島に分布する三浦層群安野層 中のAn85テフラ層(千葉県立中央博物館,1993,1995, 1996)などと対比され,我が国における第一級の鮮新 世広域テフラであると認識されている(Kurokawa and Tomita,1998;黒川,2005;Tamura et al., 2008)。 PM テフラ層を含む氷見地域の鮮新統(阿尾層とそ の上位の薮田層)の古地磁気層序は伊藤・渡辺(1997) によって報告されている。それによると,PM テフラ 層の残留磁化は正極性であり,PM テフラ層は Gilbert Chronozone中の正極性卓越部(4.18–5.23 Ma: Cande and Kent,1995)に対比されている。しかし,PMテフラ層 に対比される大田テフラ層からは逆極性の残留磁化が 報告されている(中山・吉川,1990;Nakayama et al.,
1995)。An85テフラ層も,古地磁気層序(新妻,1976) と浮遊性有孔虫化石層序(Oda,1977)から Gilbert Chronozone上部の逆極性部(3.58–4.18 Ma: Cande and Kent, 1995)に対比される(里口ほか,2005)。また,里 口ほか(2005)は安野層の堆積速度を仮定することに よって An85 テフラ層の年代を約 3.9 Ma と推定してい る。PM テフラ層のフィッション・トラック(FT)年 代は3.9±0.2 Maであり(渡辺・檀原,2001),An85テ フラ層の推定年代と一致する。しかし,PM テフラ層 の古地磁気層序年代(上記)はこの約3.9 Maという年 代と微妙ではあるが整合的ではない。また,阿尾層の 古地磁気層序と珪藻化石層序の対応関係についても再 検討の必要性が指摘されている(伊藤・渡辺,1997)。 PM テフラ層の古地磁気を再検討するために,今回 筆者はPM テフラ層から試料を採取し残留磁化を測定 した。その結果,PM テフラ層の古地磁気について新 たな事実が明らかになった。
富山県氷見地域に分布するPMテフラ層の古地磁気方位
星 博幸
理科教育講座(地球科学)Paleomagnetic Direction of the PM Tephra Bed in the Himi Area,
Toyama Prefecture, Central Japan
Hiroyuki HOSHI
Department of Science Education (Geology), Aichi University of Education, Kariya 448-8542, Japan
The PM tephra bed, a thick (~10 m), felsic tephra deposit in the Pliocene sedimentary sequence in the Himi area, has been sampled for determining its paleomagnetic direction. Ten oriented cores were collected from the uppermost fine-grained vitric ash portion at one locality, and stepwise alternating-field and thermal demagnetiza-tions were performed for 20 cylindrical specimens in order to isolate remanent magnetization components. More than half of the specimens had a single magnetic component with a northerly and down direction close to the present geomagnetic field direction (i.e., normal polarity). However, six samples, which also provided a normal polarity linear component, displayed a directional change along a great circle during stepwise demagnetization, indicating the presence of another higher coercivity/unblocking temperature component. Application of the great circle method disclosed the component with a SSW and up direction (i.e., reversed polarity). A previous study has reported that the PM tephra bed is normally magnetized; however, the author interprets that the normal polarity direction is most likely a secondary component and the primary magnetization has reversed polarity. This interpretation is concordant with tephrostratigraphic investigations suggesting that the PM tephra bed is correlated to the reversely magnetized tephras found in several areas of central Japan.
2.試 料
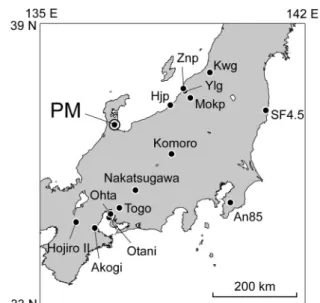
試料採取は,Kurokawa and Kanke(2003)がPMテフ ラ層の岩相を記載した氷見市阿尾地区の露頭(36°53′
01″N,136°58′50″E)で行った(Fig. 1)。Kurokawa and Kanke(2003)によると,この露頭のPMテフラ層は層 厚約10 mで,下位よりユニットA1(細礫とパミスが密 集する火砕岩,厚さ約25 cm),ユニットA2 (シルト岩 の偽礫とパミスを多量に含む火砕岩,厚さ約120 cm), ユニットB(極粗粒砂サイズからシルトサイズまで級 化を示す凝灰岩,最大径5 cm程度のパミスを含む)に 区分される。PMテフラ層最上部(ユニットB最上部) は,弱い平行葉理がみられ,最大約2 cmのパミスが点 在するシルトサイズの軟質凝灰岩であり,この層準か ら直径 25 mm の定方位コアを 10 本採取した。コアの 定方位付けには磁気コンパスを使用した。コア採取で は露頭表面に現れているパミスを避けるように注意し たが,いくつかのコアには最大 1 cm を超えるパミス が含まれていた。コアを実験室に持ち帰り,岩石カッ ターで高さ22 mmの円筒形測定試料(以下,試料と呼 ぶ)を2個または3個切り出した。その際も試料にパミ スが含まれないように注意したが,それでも 2個の試 料には数 mm から 1 cm 程度のパミスが含まれている ことを確認した。 この露頭の地層は緩く傾斜しているが,層理面が不 明瞭であったため走向・傾斜を正しく測定することが 困難であった。そこで,渡辺(1990)の地質図に示さ れている走向・傾斜及び地層分布を地質図学の方法で 解析し,この露頭の地層の走向・傾斜として N30°E, 8°SEという推定値を得た。本研究ではこの走向・傾斜 を用いて残留磁化方位の傾動補正を行う。
3.残留磁化
残留磁化測定は,高知大学海洋コア総合研究セン ターの古地磁気・岩石磁気実験室(磁気シールドルー ム)に設置されているパススルー型超電導磁力計(2G 760R)を用いて行った。測定では 1 本のコアから 2 個 の試料を選び,1個に段階交流消磁(AFD:パススルー で最高80 mTまで)を,もう1個に段階熱消磁(ThD: 空気中で最高620℃まで)を施した。ThDでは,試料の 熱変質をチェックするために,各消磁ステップで初期 磁化率も測定した。測定後,残留磁化ベクトルの変化 を調べるために消磁結果を直交投影図と等積投影図に 示した。直交投影図上で直線的な残留磁化成分が認め られた場合は,Kirschvink(1980)の主成分解析によっ てその方位を決定した。その際,最大角偏差(MAD) が 10° 未満の結果を採用した。また,段階消磁の進行 に伴って方位が変化し,等積投影図上で弧状の軌跡を 描いた試料については,Kirschvink(1980)の方法に よって最適消磁大円の極を決定した。 自然残留磁化(NRM)強度は,パミスを含有する2 個の試料を除くと 0.1 × 10⁻³~ 0.4 × 10⁻³ A/mであった (Table 1)。パミスを含む2試料(4bt,9bt)はこれらよ りも1桁大きな強度を示した。 測定したすべての試料から直線的な残留磁化成分が 分離された(Table 1,Fig. 2)。パミスを含む2試料を除Fig. 1. Map showing the type localities of the PM tephra bed and other correlative local tephras in central Japan after Kurokawa (2005).
Table 1. Paleomagnetic data from the PM tephra bed in the Himi area, Toyama Prefecture.
Specimen Demag J (10–3A/m) D (°) I (°) A (°) P (°) 1a 1ct 2a 2bt 3a 3bt 4a 4bt* 5a 5bt 6a 6bt 7a 7bt 8a 8bt 9a 9bt* 10a 10bt AF TH AF TH AF TH AF TH AF TH AF TH AF TH AF TH AF TH AF TH 0.28 0.17 0.18 0.13 0.15 0.13 0.19 8.18 0.26 0.20 0.26 0.23 0.39 0.35 0.29 0.26 0.32 1.16 0.35 0.30 0.6 11.1 16.1 8.3 10.3 1.5 13.5 54.1 4.1 9.5 16.0 359.8 354.4 7.6 2.4 16.5 14.1 86.0 15.5 10.0 59.3 61.1 61.0 57.1 53.7 55.6 49.8 1.0 64.0 53.8 51.8 53.4 49.9 48.8 55.1 49.2 60.3 12.7 48.7 51.3 112.3 186.1 128.5 264.5 169.3 146.2 9.1 42.0 23.4 18.6 32.1 36.5
Demag, demagnetization (AF, alternating field; TH, thermal); J, in-tensity of natural remanent magnetization; D and I, declination and inclination of linear component determined by least square line fit; A and P, azimuth and plunge of pole to remagnetization plane determined by least square fit; samples with asterisk exhibited high intensities and inconsistent linear component directions due to contamination of pum-ice fragments.
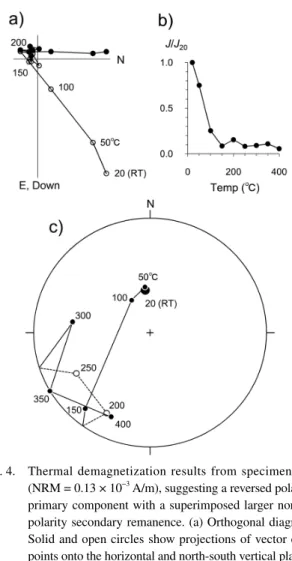
くと,これらの直線成分はその場の状態(in situ)にお いて北寄りで下向き,すなわち地心軸双極子磁場を仮 定したときの方位(偏角 D=0°,伏角I=56.3°)に類 似する正極性の方位を示した(Fig. 3)。AFDではNRM 方位から最大消磁レベルである80 mTまでの範囲(Fig. 2a),ThD では室温(NRM 方位)または 50℃から 200 または250℃までの範囲(Figs. 2b,4a)でこれらの直 線成分が認められた。これらの直線成分は,ほぼ原点 に向かって強度が減少するケース(Fig. 2b),及び原 点からやや外れて減少するケース(Fig. 4a)の両方が あった。ThDでは,直線成分が分離された後,残留磁化 ベクトルが原点付近で不規則な挙動を示した。なお, ThDにおいて初期磁化率の変化はほとんど認められな かった。これらの直線成分(n=18)のin situ平均方位 はD=8.5°,I=54.8°であり,Fisher(1953)の95%信
Fig. 2. Representative stepwise demagnetization results showing a single linear remanent magnetization component. These orthogonal plots display projections of vector endpoints onto the horizontal (solid circle) and north-south vertical (open circle) planes. (a) Al-ternating field (AF) demagnetization data from specimen 1a, representing a normal polarity component through all demagnetiza-tion steps from 0 to 80 mT. The natural remanent magnetizademagnetiza-tion (NRM) intensity is 0.28 × 10⁻³ A/m. (b) Thermal demagnetization
results from specimen 10bt, showing a normal polarity component in the range from room temperature (RT) to 250 °C, followed by an erroneous behavior near the origin. The NRM intensity is 0.30 × 10⁻³ A/m. (c) Thermal results of specimen 4bt, indicating a
distinct linear component with a northeast and nearly horizontal direction in the range from 450 to 620 °C. This unexpected direc-tion stems from a visible pumice fragment contained in the specimen (see text). The NRM intensity is 8.18 × 10⁻³ A/m, an order
of magnitude higher than the other specimens.
Fig. 3. Lower hemisphere equal area projection showing di-rections of linear components determined by the least square analysis of stepwise demagnetization results. Circles = low coercivity/unblocking temperature ponents. Squares = high unblocking temperature com-ponents in two specimens containing large pumice frag-ments (4bt, 9bt). Cross = geocentric axial dipole field direction. See Table 1 for data.
Fig. 4. Thermal demagnetization results from specimen 3bt (NRM = 0.13 × 10⁻³ A/m), suggesting a reversed polarity
primary component with a superimposed larger normal polarity secondary remanence. (a) Orthogonal diagram. Solid and open circles show projections of vector end-points onto the horizontal and north-south vertical planes, respectively. (b) Normalized remanence intensity (J/J20)
versus demagnetization temperature. (c) Equal area pro-jection of the remanence direction. Solid (open) circles indicate directions in the lower (upper) hemisphere. Note that, from room temperature (RT) to 200 °C, the direction changed systematically so that it moved along a great circle; above 200 °C it showed erratic behavior.
頼限界円の半径(α95)は2.7°,精密度パラメータ(k) は 171.7 となった。この平均方位を上記の走向・傾斜 (N30°E,8°SE)を用いて傾動補正すると D=19.9°,I = 57.0° となる。この方位は伊藤・渡辺(1997)が報 告した傾動補正後の方位(D=14.7°,I=66.6°,α95= 7.8°,k=96.0)と似ている。 パミスを含む2試料にPhDを適用した結果,560℃以 上に主たるアンブロッキング温度を持つ単一の直線成 分が認められた(Fig. 2c)。その方位はパミスを含まな い試料の直線成分方位とは明らかに異なり(Table 1), 正磁極期または逆磁極期に地磁気永年変化の範囲で期 待される方位とも大きく異なっている。残留磁化強度 がパミスを含まない試料よりも1桁大きい(上記)こ とも考慮すると,これら2試料の直線成分方位はパミ スの残留磁化(熱残留磁化と思われる)にほぼ支配さ れたものであり,テフラ堆積時あるいはその後に獲得 されたその場の古地磁気方位を示すものではないと考 えられる。 いくつかの試料は段階消磁の進行に伴って方位が変 化し,等積投影図上で弧状の軌跡を描いた。代表例 を Fig. 4 に示す。例外なくこれらの試料は現在の地磁 気方位と類似した NRM 方位(正極性)を持ち,消磁 の進行に伴って残留磁化方位が大円に沿うように変化 し(直交投影図では原点からやや外れて減少する直 線成分として現れる),2 試料は 200 ~ 250℃で上向き の方位になった。こうした方位変化はより高いアンブ ロッキング温度・高い保磁力の残留磁化成分が存在す ることを意味し,その成分の方位を決定するために McFadden and McElhinny(1988)の大円法を試みた。 6試料について決定された最適消磁大円(極をTable 1 に示した)から,in situ 平均方位としてD = 192.6°,I = –48.5°,α95= 6.6°,k = 173.0 という結果が得られ た(Fig. 5)。これを上記の走向・傾斜を用いて傾動補 正すると D = 201.7°,I = –50.3° という逆極性の方位 となる(α95と k は変化しない)。大円法で平均方位を 求める場合,直線成分方位の有無によって結果の確度 (accuracy)が左右され,直線成分方位が複数ある場合 とまったくない場合とでは平均方位に数十度にも達す る違いが生じることがある(McFadden and McElhinny, 1988)。今回の平均方位は最適消磁大円だけを使って 決定されたものであるため,方位の取り扱いには注意 を要するが,それでも高アンブロッキング温度・高保 磁力の成分が逆極性であることは間違いないと考えら れる。 今回の測定によって,PM テフラ層は正極性の残留 磁化成分だけでなく逆極性の残留磁化成分も記録して いることが判明した。正極性成分は傾動補正前の方位 が正磁極期の地心軸双極子磁場方位と似ていること, 及び比較的低い保磁力と低いアンブロッキング温度を 示すことから,地層傾動後に獲得された二次磁化と 考えられる。逆極性成分は正極性成分よりも高い保磁 力とアンブロッキング温度を示し,これが PM テフラ 層の初生的な残留磁化であると筆者は判断する。PM テフラ層の初生的な残留磁化が逆極性であることは, PMテフラ層が大田テフラ層や An85 テフラ層といっ た逆極性の残留磁化を持つテフラ層に対比されるとい うテフラ分析結果と整合する。
4.謝 辞
産業技術総合研究所の渡辺真人氏には,PM テフラ 層の露頭についてご教示頂いた。5.文 献
Cande, S. C. and Kent, D. V., 1995, Revised calibration of the geomag-netic polarity timescale for the Late Cretaceous and Cenozoic. Jour. Geophys. Res., 100, 6093–6095.
千葉県立中央博物館,1993,三浦層群中部鍵層集Ⅰ(1992年版). 千葉県立中央博物館,124 p. 千葉県立中央博物館,1995,三浦層群上部鍵層集Ⅰ(1994年版). 千葉県立中央博物館,77 p. 千葉県立中央博物館,1996,三浦層群上部鍵層集Ⅱ(1995年版). 千葉県立中央博物館,83 p.
Fisher, R., 1953, Dispersion on a sphere. Proc. Roy. Soc. London, Ser. A, 217, 295–305.
伊藤康人・渡辺真人,1997,富山県氷見地域に分布する新第三
Fig. 5. Reversed polarity site mean direction (open square) and its 95% confidence limit (shaded oval) calculated with the great circle method of McFadden and McElhinny (1988), shown in the geographical (in situ) coordinate. Remagnetization great circles (solid gray, lower hemi-sphere; dashed gray, upper hemisphere) were deter-mined by least square analysis of remanence vectors (solid circle, lower hemisphere; open circle, upper hemi-sphere) that changed systematically during the course of stepwise demagnetization.
系の古地磁気層序.地調月報,48,339–346.
Kirschvink, J. L., 1980, The least squares lines and plane and the analy-sis of palaeomagnetic data. Geophys. Jour. Roy. Astr. Soc., 62, 699–718.
黒川勝己,2005,テフラ学入門―野外観察から地球環境史の復 元まで―.地学団体研究会,205 p.
Kurokawa, K. and Kanke, K., 2003, Stratigraphic section of the Znp Te-phra Bed: a Pliocene submarine pumiceous gravity flow in Niigata region, central Japan. Mem. Fac. Educ. Human Sci., Niigata Univ., 5, 11–25.
Kurokawa, K. and Tomita, Y., 1998, The Znp-Ohta Ash: an early Plio-cene widespread subaqueous tephra deposit in central Japan. Jour. Geol. Soc. Japan, 104, 558–561.
McFadden, P. L. and McElhinny, M. W., 1988, The combined analysis of remagnetization circles and direct observations in palaeomag-netism. Earth Planet. Sci. Lett., 87, 161–172.
中山勝博・吉川周作,1990,東海層群の古地磁気層序.地質雑, 96,967–976.
中山勝博・吉川周作,1995,鮮新統広域テフラ層である大田テ フラ層の堆積過程(予報).地球科学,49,406–418. Nakayama, K., Yoshikawa, S. and Ito, T., 1995, Magnetostratigraphy of
the Late Cenozoic Tokai Group in central Japan and its sedimento-logic implications. Jour. Southeast Asian Earth Sci., 12, 95–104. 新妻信明,1976,房総半島における古地磁気層位学.地質雑,
82,163–181.
Oda, M., 1977, Planktonic foraminiferal biostratigraphy of the Late Cenozoic sedimentary sequence, central Honshu, Japan. Sci. Rep. Tohoku Univ., 2nd ser. (Geol.), 48, 1–72.
里口保文・樋口裕也・黒川勝己,2005,東海層群に挟在する大 田テフラ層と三浦層群のテフラ層との対比.地質雑,111, 74–86.
Tamura, I., Yamazaki, H. and Mizuno, K., 2008, Characteristics for the recognition of Pliocene and early Pleistocene marker tephras in central Japan. Quat. Int., 178, 85–99.
渡辺真人,1990,富山県氷見・灘浦地域の新第三系の層序―と くに姿累層とその上位層との間の時間間隙について―.地 質雑,96,915–936. 渡辺真人・檀原 徹,2001,富山県氷見・灘浦地域の新第三系の 年代層序の再検討.地質学会第108年大会演旨,224. (2011年8月1日受理)