I
n the treatment of oral squamous cell carcinoma (OSCC), patients with clinically diagnosed cervical lymph node (LN) metastases are subjected to radical neck dissection or modified radical neck dissection.The existence of extranodular spread (ENS) influences the method selection [1].
In previous studies, the sensitivity and specificity of computed tomography (CT) for predicting ENS were reported to be about 81% and 73% [2], and those of MRI about 74% and 72% [3]. Another study reported that 60-min 18F-fluorodeoxyglucose positron emission tomography (18F-FDG PET/CT) was useful for predict- ing ENS, with sensitivity and specificity of 85% and
CopyrightⒸ 2020 by Okayama University Medical School.
http ://escholarship.lib.okayama-u.ac.jp/amo/
Original Article
The Diagnostic Capacity of Pre-treatment
18F-FDG PET/CT for Predicting the Extranodular Spread of Lymph Node Metastases
in Patients with Oral Squamous Cell Carcinoma
Ryuichiro Fukuharaa,b*, Takayoshi Shinyac,d, Shogo Fukumac, Nanako Ogawac, Yoshihisa Masaokac, Takehiro Tanakae, Hidenori Marunakaf, Tadashi Ariokag,
Takao Hirakic, Mitsumasa Kajig, and Susumu Kanazawac
aDepartment of Radiology, Okayama University Graduate School of Medicine, Dentistry and Pharmaceutical Sciences, Departments of bPediatric Radiology, cRadiology, ePathology, fOtolaryngology-Head & Neck Surgery, gRadiology,
Okayama Diagnostic Imaging Center, Okayama University Hospital, Okayama 700-8558, Japan,
dDepartment of Radiology, Kawasaki Medical School General Medical Center, Okayama 700-8505, Japan
The aim of this study was to evaluate the ability of pretreatment 90-min 18F-fluorodeoxyglucose positron emis- sion tomography/computed tomography (18F-FDG PET/CT) to predict the extranodular spread of lymph node metastases in oral squamous cell carcinoma. We retrospectively reviewed the cases of 56 patients who under- went pretreatment 18F-FDG PET/CT and surgery with neck dissection. Maximum standardized uptake value, metabolic tumor volume, and total lesion glycolysis were measured for the 56 primary sites and maximum standardized uptake value was measured for 115 lymph node levels. Extranodular spread was present at 9 lymph node levels in 7 patients. Significant differences were found in metabolic tumor volume and total lesion glycolysis of the primary site, and in lymph node maximum standardized uptake value, between patients with and without extranodular spread (p<0.05). Combining primary site total lesion glycolysis and lymph node maximum standardized uptake volume at their respective optimal cutoffs, the sensitivity, specificity, and accu- racy for predicting extranodular spread were 89%, 92%, and 92%, respectively. Pretreatment 18F-FDG PET/CT is useful for predicting extranodular spread in patients with oral squamous cell carcinoma. The combined use of primary site total lesion glycolysis and lymph node maximum standardized uptake value showed greater pre- dictive value than either predictor singly.
Key words: 18F-fluorodeoxyglucose positron emission tomography/computed tomography, extranodular spread, metastasis, oral squamous cell carcinoma
Received September 18, 2019 ; accepted November 20, 2019.
*Corresponding author. Phone : +81-90-1330-5085; Fax : +81-86-235-7316
E-mail : [email protected]. (R. Fukuhara) Conflict of Interest Disclosures: No potential conflict of interest relevant to this article was reported.
88%, respectively, using a maximum standardized uptake (SUVmax) value of 2.25 as the cutoff for LN [4].
However, the detection of cervical LNs with an SUVmax of 2.25 is clinically difficult, because adjacent tissues or substances to which the 18F-FDG are also taken up, such as plaque in the carotid artery, have SUVmax values within the same range [5].
In contrast, measuring the 18F-FDG uptake of the primary site (PS) is relatively easy. Moreover, previous reports have demonstrated the utility of measuring the PS 18F-FDG uptake for predicting LN metastases in patients with primary lung carcinoma and OSCC in whom the 18F-FDG uptake to metastatic LNs was nega- tive [6,7]. Furthermore, several recent papers revealed that metabolic tumor volume (MTV) and total lesion glycolysis (TLG) were more useful prognostic markers compared to SUVmax [7-10].
We hypothesized that the evaluation of the 18F-FDG accumulation at the PS could be another potential pre- dictor of ENS in patients with OSCC. To the best of our knowledge, the correlation between ENS and the 18F- FDG uptake at the PS, and the possibility of diagnosing ENS by evaluating the 18F-FDG accumulation at the PS have not been clarified. Moreover, no report has assessed the utility of 90-min 18F-FDG PET/CT for the prediction of LN metastases in OSCC.
In this retrospective study, we compared four parameters collected by pretreatment with 90-min 18F- FDG PET/CT—SUVmax for PS (SUV-PS), MTV for PS (MTV-PS), TLG for PS (TLG-PS), and SUVmax of LN itself (SUV-LN)—for their ability to predict ENS in OSCC.
Materials and Methods
Patient population. We retrospectively reviewed the medical records of 56 patients with newly diagnosed OSCC who underwent pretreatment 18F-FDG PET/CT for initial staging between August 2010 and November 2016 (28 males, 28 females; age [mean ± SD], 70.43±
13.40; range, 23-92 years). All patients underwent resection of the primary tumor and neck dissection with curative intent, and histological diagnosis of the primary tumor and lymph nodes was performed.
Seventeen patients underwent comprehensive neck dis- section, and 39 patients underwent selective neck dis- section (Level 1, n=11; Level 2, n=1; Level 1-2, n=2;
Level 1-3, n=14; Level 1-4, n=11). Exclusion criteria
were a previous history of malignancy within 5 years, induction chemotherapy, and a serum glucose level of more than 150 mg/dl prior to the radiotracer injection.
Data were obtained from medical records, including clinicopathological variables and treatment. Tumors were staged according to the TNM Classification of Malignant Tumors, 8th edition [11]. The study was approved by the institutional review board of our hospi- tal and the requirement of informed consent was waived (1811-012).
18F-FDG PET/CT procedures and analysis of PET/
CT images. All 18F-FDG PET/CT examinations were performed using an integrated PET/CT scanner (Biograph 16; Siemens Medical Solution USA, Knoxville, TN, USA) at a diagnostic imaging center adjacent to our institution. After fasting for at least 5 h, the patients received an intravenous injection of 3.7 MBq/kg 18F-FDG. At our institution, PET image acquisition is routinely started 90 min after injection of
18F-FDG, with the patient in a relaxed supine position.
First, a total-body low-dose CT scan for the calculation of attenuation correction was performed, using a stan- dardized protocol involving 120 kV, auto mA mode, rotation time of 0.5 sec, pitch of 0.8, section thickness of 3 mm, and scan field from the head to the mid-thigh level. Immediately thereafter, PET imaging consisting of 6-8 bed positions with 2.4 min per position over the same region was performed. The PET images were reconstructed with an ordered-subset expectation max- imization iterative reconstruction algorithm.
Integrated, co-registered PET/CT images were obtained using a workstation that enables image fusion and analysis (syngo. via; Siemens Medical Solution USA). For semi-quantitative analyses of 18F-FDG uptake, the images were evaluated by 2 nuclear medi- cine physicians, by consensus. A volume of interest was drawn semi-automatically over the PS and all measur- able dissected cervical LN levels on an axial slice. If 18F- FDG uptake was perceptible in a cervical LN, the SUVmax in the cervical LN was measured to minimize partial-volume effects [12,13]. If multiple nodes in the same LN level were measurable, the highest SUVmax value among them was adopted as the representative SUVmax of the LN level. For calculating MTV and TLG, the threshold values were set at an SUV of 2.5, based on the results of previous studies [8,9,14]. The semi-quantitative values of SUV-PS, MTV-PS, TLG-PS and SUV-LN were calculated automatically.
Statistical analyses. All analyses were performed using IBM SPSS Statistics (version 22; IBM Corp., Armonk, NY, USA). The Mann-Whitney U test was used to analyze differences in SUV-PS, MTV-PS, TLG-PS, or SUV-LN between the groups with and without ENS. Receiver operating characteristic (ROC) curve analysis of such semi-quantitative parameters was performed to differentiate the tumors with ENS from those without ENS, and to differentiate the LN levels with ENS from those without ENS. P values <0.05 were considered statistically significant.
Results
Characteristics of patients and oral squamous cell carcinoma. Table 1 shows the patients’ characteris- tics. Seven out of 56 patients had 9 LNs with patholog- ically proven ENS in 115 dissected LN levels. The pri- mary tumor size ranged from 12 to 85 mm, with most lesions being <50 mm in the long axis diameter.
Figures 1 and 2 show representative 18F-FDG PET/CT images of OSCC with and without ENS.
Standardized uptake value, metabolic tumor vol- ume, and total lesion glycolysis. Table 2 shows the SUV-PS, MTV-PS, TLG-PS, and SUV-LN values in the study groups. The SUV-PS (mean±SD) values in patients with and without ENS were 16.84±4.95 and
12.54±5.98, the MTV-PS values in patients with and without ENS were 27.05±12.25 ml and 14.09±13.36 ml, and the TLG-PS values in patients with and without ENS were 153.03±68.13 g and 80.85±111.30 g, respec- tively. The SUV-LN values in patients with and without ENS were 8.18±4.43 and 2.69±2.37. Significant inter- group differences were found in MTV-PS, TLG-PS, and SUV-LN (all p<0.05) but not in SUV-PS (p=0.12).
The areas under the ROC curve (AUCs) for SUV-PS, MTV-PS, TLG-PS, and SUV-LN were 0.684 (p=0.12, 95% CI 0.534-0.834), 0.812 (p=0.008, 95% CI 0.697- 0.937), 0.816 (p=0.007, 95% CI 0.676-0.956), and
Table 1 Characteristics of 56 patients
Variables Patients
with ENS Patients
without ENS Age (years)
Mean±SD/Range 67.3±22.8/23-89 70.9±11.4/35-91
Sex Male/Female 1/6 27/22
Primary site location
Gingiva 4 22
Tongue 2 15
Floor of mouth 1 6
Buccal mucosa 0 6
Pathologic T stage (UICC 8th)
T1 0 12
T2 0 20
T3 2 3
T4 5 14
Tumor size (mm)
Mean±SD/Range 41.7±19.5/17-85 27.0±10.2/12-60 Lymph node size (mm)
Mean±SD/Range 18.1±9.8/10-44 9.6±3.6/4-23 ENS, extranodular spread; SD, standard deviation; UICC 8th, TNM classification of malignant tumors, 8th edition, by UICC.
A B
C D
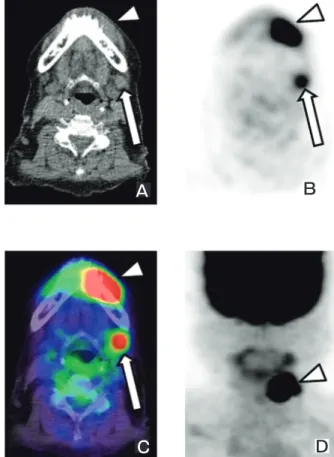
Fig. 1 An 89-year-old woman with left lower gingival squamous cell carcinoma and level I cervical lymph node metastasis with extranodular spread. Axial computed tomography (CT) (A) shows soft tissue density in the primary site (arrowhead) and an enlarged level I lymph node (arrow). Positron emission tomography (PET) (B), positron emission tomography/computed tomography (PET/
CT) (C), and maximum intensity projection (MIP) (D) images show high 18F-FDG uptake of the primary site (SUVmax, MTV, and TLG were 28.54, 25.19ml, and 178.53g, respectively) and lymph node (SUVmax was 8.85), which is easy to distinguish from adjacent tissues.
0.932 (p<0.001, 95% CI 0.882-0.982) with the optimal cut-off values of 13.46, 19.56 ml, 106.26 g, and 3.37, respectively (Fig.3A,3B). The sensitivity, specificity, and accuracy for predicting ENS using these cut-off values were 86%, 78%, and 80% for MTV-PS, and 86%, 78%, and 80% for TLG-PS, respectively. The sensitivity, specificity, and accuracy of SUV-LN levels for predicting ENS were 100%, 84%, and 86% using the optimal cut-off value.
A predictor combining TLG in the primary tumor
and SUVmax in lymph nodes. TLG-PS showed a higher AUC than SUV-PS or MTV-PS, and SUV-LN demonstrated the highest AUC among all parameters.
Combining the two criteria—namely, considering a TLG-PS greater than 106.26 g and an SUV-LN greater than 3.37—resulted in sensitivity, specificity, and accu- racy of 89%, 92%, and 92%, respectively, for the pre- diction of ENS.
Table 2 Comparison of the measured parameters between the ENS and the non-ENS groups
ENS group non-ENS group p value* Primary site
SUVmax 16.84±4.95 12.54±5.98 0.12 (13.16-28.54) (3.38-29.15)
MTV (ml) 27.05±12.25 14.09±13.36 0.006 (11.75-54.57) (0.99-83.12)
TLG (g) 153.03±68.13 80.85±111.30 0.005 (52.34-289.91) (2.89-759.97)
Lymph node
SUVmax 8.18±4.43 2.69±2.37 <0.001 (3.37-19.5) (1.08-17.02)
ENS, extranodular spread; SUVmax, maximum standardized uptake value; MTV, metabolic tumor volume; TLG, total lesion glycolysis. The data are represented as mean±standard deviation, data in parentheses are the range.
*P value: comparison of semiquantitative values between the ENS and non-ENS groups (Mann-Whitney U-test).
A B
C D
Fig. 2 A 90-year-old woman with right tongue squamous cell carcinoma and level II cervical lymph node metastasis without extra- nodular spread. Axial computed tomography (CT) (A) shows slightly higher density of the primary site (arrowhead) than the other side, and a conspicuous level II lymph node (arrow). Positron emission tomography (PET) (B), positron emission tomography/computed tomography (PET/CT) (C), and maximum intensity projection (MIP) (D) images show intense 18F-FDG uptake to the primary site (SUVmax, MTV, and TLG of the primary site were 16.73, 12.97ml, and 77.54g, respectively) and intense 18F-FDG uptake of the lymph node (SUVmax, 2.94). The SUVmax of the primary site was relatively high, but the MTV and the TLG of the primary site and the SUVmax of the lymph node were below the cutoff values of the present study.
1.0 0.8 0.6 0.4 0.2 0.0
Sensitivity
0.0 0.2 0.4 0.6 0.8 1.0
1-Specificity
SUVmax MTV TLG
Fig. 3A Receiver operating characteristics (ROC) curves for patients with ENS according to maximum standardized uptake value (SUVmax), metabolic tumor volume (MTV), and total lesion glycol- ysis (TLG) of the primary site show the discrimination achieved by each parameter in the extranodular spread (ENS) group and the non-ENS groups.
Discussion
Several previous studies have investigated the utility of SUVmax measured by 18F-FDG PET/CT for predict- ing LN metastases in patients with OSCC [15-17].
MTV is a measure of the volume of the tumor display- ing 18F-FDG uptake, and thus quantifies the overall tumor burden, and is theoretically a better predictor of outcome than the SUVmax [18]. TLG represents the metabolic activity throughout the entire tumor above a minimum threshold designed to exclude the back- ground activity [19]. Therefore, volume-based param- eters such as MTV and TLG may reflect the metabolic burden of the active tumor more accurately than SUVmax and thus could be better surrogate imaging markers of tumor biology [7,20,21].
The first finding in the present study was that MTV-PS, TLG-PS, and SUV-LN were useful parame- ters to predict LNs with ENS in our study population.
In a previous study [4], ENS could be predicted using a SUV-LN cut-off value of 2.25, with 85% sensitivity and 88% specificity. However, in clinical practice, detecting cervical LNs with an SUVmax of 2.25 is difficult, because adjacent tissues or substances to which the 18F- FDG are also taken up have SUVmax values within the same range [5]. In contrast, MTV-PS and TLG-PS can be easily measured in clinical practice. Moreover, the combined use of TLG-PS and SUV-LN exhibited a
higher performance for predicting ENS than the use of either parameter alone, with 89% sensitivity, 92% spec- ificity, and 92% accuracy. Therefore, these results sug- gest that measuring TLG-PS in addition to SUV-LN on pretreatment 18F-FDG PET/CT could be both feasible and useful to predict LNs with ENS in patients with OSCC.
The second finding of our study is that the optimal cut-off value of SUV-LN was 3.37, with 100% sensitiv- ity, 84% specificity, and 86% accuracy in predicting ENS, and an AUC value of 0.932±0.05. In a previous study [4] of OSCC patients with 71 dissected LN levels, the SUV-LN in the tumors with ENS was greater than that in those without ENS, and the difference was sig- nificant. The ROC curve analysis of SUV-LN in the same study showed an AUC of 0.864±0.045 and an optimal SUVmax cut-off value of 2.25, with 85% sensi- tivity and 88% specificity. In our study, we achieved excellent diagnostic capacity by setting the SUV-LN cut-off value at 3.37. In clinical practice, it is relatively easy to detect LNs with an SUVmax greater than 3.37, even when surrounded by adjacent normal tissue with physiological uptake. The difference in diagnostic per- formance of SUV-LN between our study and the previ- ous study [4] could be due to the difference in the PET acquisition time point. PET image acquisitions were started at 90 min after injection of 18F-FDG in the pres- ent study and at 60 min after injection in the previous study [4]. Another previous research on 2-h dual-time- point 18F-FDG PET demonstrated that head and neck malignant tumors had a mean SUV increase of 12%
between the 1-h (early) and the 2-h (late) phases, and that the 18F-FDG uptake to inflammation and normal tissue had meanwhile decreased [22]. Another recent report revealed that the 18F-FDG uptake to most normal cervical tissue decreases as time proceeds within 3 h after 18F-FDG injection [23]. These results suggest that 90-min PET acquisition with SUV-LN measurement is superior to 60-min PET acquisition for the prediction of ENS in OSCC, and that the contrast between metastatic LNs with ENS and surrounding normal tissue might be better on 90-min than 60-min PET images.
This study has several limitations. First, it is inher- ently limited by its retrospective nature. Second, the study population was relatively small, especially in terms of patients having tumors with ENS. Finally, PET image acquisition was performed only at 90 min and not at 60 min. A multi-institutional trial using a
1.0 0.8
0.6
0.4 0.2
0.0
Sensitivity
0.0 0.2 0.4 0.6 0.8 1.0
1-Specificity
Fig. 3B Receiver operating characteristics (ROC) curves for lymph nodes with ENS according to the maximum standardized uptake value (SUVmax) of the lymph node show the performance of the discrimination between the extranodular spread (ENS) group and the non-ENS groups.
larger patient population with 90-min dual-time-point
18F-FDG PET/CT may provide a clearer picture and more confident assessment of the ability of 90-min 18F- FDG PET/CT to predict ENS in patients with OSCC.
In conclusion, the findings of the present study demonstrate that the assessment of 18F-FDG MTV-PS and TLG-PS could be a useful and highly accurate tool for predicting ENS in patients with OSCC. The 90-min
18F-FDG PET/CT is potentially more useful than the 60-min 18F-FDG PET/CT for predicting ENS by evalu- ating the 18F-FDG accumulation to LNs. Specifically, on 90-min 18F-FDG PET/CT, a TLG-PS cut-off value of 106.26 g, combined with a SUV-LN cut-off value of 3.37, demonstrated excellent diagnostic performance in identifying lymph nodes with ENS in OSCC patients.
References
1. Shaha AR: Radical neck dissection. Oper Tech Gen Surg (2004) 6:
72-82.
2. Steinkamp HJ, van der Hoeck E, Bock JC and Felix R: The extra- capsular spread of cervical lymph node metastasis: diagnostic value of computed tomography. Rofo (1999) 170: 457-462.
3. Steinkamp HJ, Beck A, Werk M, Rademaker J and Felix R: Extra- capsular spread of cervical lymph node metastasis: diagnostic value of magnetic resonance imaging. Rofo (2002) 174:50-55.
4. Joo YH, Yoo IR, Cho KJ, Park JO, Nam IC and Kim MS: Extra- capsular spread and FDG PET/CT correlations in oral squamous cell carcinoma. Int J Oral Maxillofac Surg (2013) 42: 158-163.
5. Purohit BS, Ailianou A, Dulguerov N, Becker CD, Ratib O and Becker M: FDG PET/CT pitfalls in oncological head and neck imaging. Insights Imaging (2014) 5:585-602.
6. Al-Sarraf N, Aziz R, Gately K, Lucey J, Wilson L, McGovern E and Young V: Pattern and predictors of occult mediastinal lymph node involvement in non-small cell lung cancer patients with nega- tive mediastinal uptake on positron emission tomography. Eur J Cardiothorac Surg (2008) 33:104-109.
7. Ryu IS, Kim JS, Roh JL, Cho KJ, Choi SH, Nam SY and Kim SY: Prognostic significance of preoperative metabolic tumour vol- ume and total lesion glycolysis measured by 18F-FDG PET/CT in squamous cell carcinoma of the oral cavity. Eur J Nucl Med Mol Imaging (2014) 41:452-461.
8. Lee P, Weerasuriya DK, Lavori PW, Quon A, Hara W, Maxim PG, Le QT, Wakelee HA, Donington JS, Graves EE and Loo BW Jr:
Metabolic tumor burden predicts for disease progression and death in lung cancer. Int J Radiat Oncol Biol Phys (2007) 69: 328-333.
9. Chung MK, Jeong HS, Park SG, Jang JY, Son YI, Choi JY, Hyun SH, Park K, Ahn MJ, Ahn YC, Kim HJ, Ko YH and Baek CH: Metabolic tumor volume of [18F]-fluorodeoxyglucose positron emission tomography/computed tomography predicts short-term outcome to radiotherapy with or without chemotherapy in pharyn- geal cancer. Clin Cancer Res (2009) 15:5861-5868.
10. Chen HH, Chiu NT, Su WC, Guo HR and Lee BF: Prognostic value of whole-body total lesion glycolysis at pretreatment FDG PET/CT in non-small cell lung cancer. Radiology (2012) 264:
559-566.
11. Brierley JD, Gospodarowicz MK and Wittekind C eds, TNM classi-
fication of malignant tumors eighth edition. Wiley, Hoboken (2017).
12. Soret M, Bacharach LS and Buvat I: Partial-volume effect in PET tumor imaging. J Nucl Med (2007) 48:932-945.
13. Hatt M, Le Pogam A, Visvikis D, Pradier O and Cheze Le Rest C:
Impact of partial volume effect correction on the predictive and prognostic value of baseline 18F-FDG PET images in esophageal cancer. J Nucl Med (2012) 53: 12-20.
14. Seol YM, Kwon BR, Song MK, Choi YJ, Shin HJ, Chung JS, Cho GJ, Lee JC, Lee BJ, Wang SG, Kim HJ, Kim WT, Kim SJ and Yun EY: Measurement of tumor volume by PET to evaluate prognosis in patients with head and neck cancer treated by chemo- radiation therapy. Acta Oncol (2010) 49: 201-208.
15. Kyzas PA, Evangelou E, Denaxa-Kyza D and Ioannidis JP: 18F- Fluorodeoxyglucose Positron Emission Tomography to evaluate Cervical Node Metastases in Patients With Head and Neck Squamous Cell Carcinoma: A Meta-analysis. J Natl Cancer Inst (2008) 100:712-720.
16. Roh JL, Ryu CH, Kim JS, Lee JS, Choi SH, Nam SY and Kim SY: Clinical significance of intrathoracic lesions detected by 18F-fluorodeoxyglucose positron emission tomography in the man- agement of patients with head and neck cancer. Oral Oncol (2007) 43: 757-763.
17. Ng SH, Yen TC, Chang JT, Chan SC, Ko SF, Wang HM, Lee LY, Kang CJ, Wong AM and Liao CT: Prospective study of [18F]- fluorodeoxyglucose positron emission tomography and computed tomography and magnetic resonance imaging in oral cavity squa- mous cell carcinoma with palpably negative neck. J Clin Oncol (2006) 24: 4371-4376.
18. Romesser PB, Qureshi MM, Shah BA, Chatburn LT, Jalisi S, Devaiah AK, Subramaniam RM and Truong MT: Superior prognos- tic utility of gross and metabolic tumor volume compared to stan- dardized uptake value using PET/CT in head and neck squamous cell carcinoma patients treated with intensity-modulated radiother- apy. Ann Nucl Med (2012) 26: 527-534.
19. Larson SM, Erdi Y, Akhurst T, Mazumdar M, Macapinlac HA, Finn RD, Casilla C, Fazzari M, Srivastava N, Yeung HW, Humm JL, Guillem J, Downey R, Karpeh M, Cohen AE and Ginsberg R:
Tumor treatment response based on visual and quantitative changes in global tumor glycolysis using PET-FDG imaging. The visual response score and the change in total lesion glycolysis.
Clin Positron Imaging (1999) 2:159-171.
20. Hwang SH, Cho A, Yun M, Choi YD, Rha SY and Kang WJ:
Prognostic value of Pretreatment Metabolic Tumor Volume and Total Lesion Glycolysis Using 18F-FDG PET/CT in Patients With Metastatic Renal Cell Carcinoma Treated With Anti-Vascular Endothelial Growth Factor -Targeted Agents. Clin Nucl Med (2017) 42: 235-241.
21. Salavati A, Duan F, Snyder BS, Wei B, Houshmand S, Khiewvan B, Opanowski A, Simone CB 2nd, Siegel BA, Machtay M and Alavi A: Optimal FDG PET/CT volumetric parameters for risk stratification in patients with locally advanced non-small lung cell cancer: results from the ACRIN 6668/RTOG 0235 trial. Eur J Nucl Med Mol Imaging (2017) 44:1969-1983.
22. Hustinx R, Smith RJ, Benard F, Rosenthal DI, Machtay M, Farber LA and Alavi A: Dual time point fluorine-18 fluorodeoxyglu- cose positron emission tomography: a potential method to differen- tiate malignancy from inflammation and normal tissue in the head and neck. Eur J Nucl Med (1999) 26:1345-1348.
23. Cheng G, Alavi A, Lim E, Werner TJ, Del Bello CV and Akers SR: Dynamic changes of FDG Uptake and Clearance in Normal Tissues. Mol Imaging Biol (2013) 15:345-352.