Study on the Mode of Action of Saccharin as a Plant Activator of Disease Resistance
2019, September Le Thi Phuong
Graduate School of Environmental and Life Science (Doctor’s Course)
OKAYAMA UNIVERSITY
Abstract of Thesis
Plant activators, also referred to as plant resistance activators or elicitors, are compounds that lead to the improved plant protection to pathogen attacks by inducing the plant’s own defense mechanisms. Unlike common toxic fungicides that directly target pathogens, resulting in drug resistance development of pathogens, side effects on non-target organisms, and polluted foods and environment, plant activators do not pose such the problems. Chemically induced resistance by plant activators can provide another useful option for practical crop protection, contributing to reduction of toxic pesticide usage. In the current study, we attempt to elucidate the molecular mechanism and efficacy of two compounds saccharin and PBZ acting as plant activators of effective defenses against some bacterial and fungal pathogens in both dicot and monocot plants.
Saccharin was previously proved to be one of the metabolites of probenazole (PBZ) in plants and acts as a plant activator. Our tests on phytotoxicity of saccharin in Arabidopsis thaliana and wheat plants have shown that saccharin exhibits no or moderate negative effects on the plant growth when applied at low concentrations up to 1 mM, regardless of application methods as foliar spraying or root drenching. We also confirmed that saccharin up to 10 mM had no direct antimicrobial activity on the growth of bacterium Pseudomonas syringae pv. tomato DC3000 (Pto DC3000) and other fungal pathogens by in vitro test. On the basic of these results we decide to use saccharin at 1 mM, along with PBZ at 0.1 mM as a positive control, for further analyses.
To elucidate the mechanism underlying saccharin- and PBZ-induced resistance we used the pathosystem of dicot model plant Arabidopsis thaliana and different bacterial and fungal pathogens. Exogenous application of saccharin and PBZ to the wild-type Arabidopsis plant triggered resistance to a hemibiotrophic bacterium Pto DC3000, but not to a necrotrophic bacterium Pectobacterium carotovorum subsp. carotovorum, and a hemibiotrophic fungus Colletotrichum higginsianum, and in the case of necrotrophic fungus Botrytis cinerea, they enhanced susceptibility. Analysis of gene expression profile revealed that activation of SA-regulated genes (PR1, PR2) and the concomitant suppression of JA-regulated genes (LOX2, VSP2, PDF1.2) by saccharin and PBZ might be the contributing event which accounted for induced resistance to Pto DC3000 and increased susceptibility to Botrytis cinerea. Consistently, analysis of Arabidopsis mutants
impaired in SA- and JA-signaling showed diminished resistance in NahG and npr1, but not in jar1 plants pretreated with saccharin or PBZ. Together, these results suggest that saccharin and PBZ induce resistance in Arabidopsis against Pto DC3000 mainly via activation of SA-signaling leading to suppression of JA/ET- signaling and vice versa.
Moreover, both saccharin and PBZ upregulated expression of other defense-related genes (ALD1, PRX34, PAD3, FRK1) and accelerated deposition of callose in Arabidopsis plants, suggesting the additive roles of multiple defense outcomes in resistance to Pto DC3000.
Next, we demonstrate that pretreatment of wheat seedlings with saccharin or PBZ results in a significant reduction in powdery mildew disease caused by Blumeria graminis f. sp. tritici. At 7 dpi, the less severe symptoms on saccharin-or PBZ-pretreated leaves were indicated by a reduced number of pustules approximately by 70% and 50% in the first and second leaves, respectively, as compared to those on the control leaves. In addition, the protective effect of saccharin and PBZ was maintained for at least 11 days after inoculation under high pressure of infection. Transcriptional analysis revealed expression profile of 15 defense-related genes. Indeed, saccharin and PBZ induced expression of multiple defense-related genes in wheat seedlings such as PR genes (PR1.1, PR2, PR4, CHI3, CHI4), genes associated with SA signaling and biosynthesis (NPR1 and PAL), genes involved in JA biosynthesis (LOX, AOS), wheat chemically induced genes (WCI2, WCI3), and a transcription factor encoding gene (WRKY72a/b). The induced expression of those defense genes in infected/ uninfected wheat seedlings pretreated with saccharin or PBZ substantially contributed to resistance to the powdery mildew fungus B.
graminis.
Our study on resistance induced by saccharin and PBZ in Arabidopsis and wheat plants against certain bacterial and fungal pathogens complement the current knowledge on the efficacy and the mode of action of saccharin and PBZ, which may be of interest to developers of plant defense activators and researchers working on immunity in both dicot and monocot plants. Saccharin can be expected to be used as an alternative eco-friendly protectant for reducing the use of agrochemicals in disease control by specific pathogens.
Acknowledgments
First and foremost, I would like to thank my PhD supervisor, Prof. Kazuhiro Toyoda, for his guidance and encouragement that I received from him throughout my study. I will never forget his kindness and generosity to support my academic activities and to fulfill the PhD project.
My sincere thanks also go to the former supervisor of my master’s degree, Emeritus Prof. Tomonori Shiraishi whose original idea helped to form the topic of my PhD project.
He is the one who taught me the very first lessons about molecular plant pathology as well as experimental skills and techniques.
I would like to acknowledge my two PhD co-supervisors, Prof. Yuki Ichinose and Asso. Prof. Yoshiteru Noutoshi, for giving me many critical and valuable comments which helped to improve my research and widen my knowledge. I am also thankful to Asso. Prof. Mikihiro Yamamoto and Dr. Hidenori Matsui for all of their supporting comments and many help during my study.
Many students from Laboratory of Plant Pathology and Genetic Engineering and Vietnamese friends also have my appreciation for helping me to learn my way around the lab and making my time studying and living in Okayama an enjoyable experience.
I would like to thank the Ministry of Education, Culture, Sports, Science and Technology of Japan (MEXT) for their financial support during my doctoral course.
Finally, I extend my deepest gratitude to my family for their unconditional loves, patience, and support for all of my pursuits. I save my endless love for my dearly beloved little son, Nhat Nam who is the main source of motivation, balance, and perspective, that I have had in my life.
Table of Contents
Abstract of Thesis………..…...……i
Acknowledgements………..……..………...…..iii
List of Tables………...…………...v
List of Figures………...………..……….…….v
List of Appendices……….……….…….………vi
Abbreviations………..…….………...vi
Chapter 1 General introduction: Induced disease resistance in plants………1
1. Plant immune system………..2
2. Induced resistance (IR)………...3
3. Saccharin: From an artificial sugar to a plant activator………7
4. Objectives of this study……….10
Chapter 2 Mode of action of saccharin in Arabidopsis plant ……….……12
Abstract………13
1. Introduction………... 14
2. Materials and methods………..17
3. Results………..…… 23
4. Discussion……….34
5. Supplementary information………..40
Chapter 3 Mode of action of saccharin in wheat ……….44
Abstract………45
1. Introduction ………..46
2. Materials and methods………..…48
3. Results and Discussion………..51
4. Supplementary information………..60
Chapter 4 General discussion and conclusions………63
1. Phytotoxicity and antimicrobial activity of saccharin………...64
2. Saccharin and PBZ induce Arabidopsis resistance to Pto DC3000 via conditioning an antagonism between SA- and JA-signaling……….65
3. Wheat resistance to Blumeria graminis triggered by saccharin and PBZ is associated with the activation of multiple defense-related genes………67
References………...69
Appendices………...………….. 76
List of Tables
Table 1-1 Review on other relevant studies on saccharin as a plant activator of defense responses………....11 Table 2-1 Summary information for primer sequences used for qRT-PCR………..21 Table 3-1 Summary information for wheat defense genes and primer sequences used for qPCR………..50
List of Figures
Fig. 1-1. Metabolic fate of probenazole in rice plant………..8 Fig. 2-1 Expression of defense-related genes after chemical treatment. ………..25 Fig. 2-2 Saccharin conferred resistance in Col-0 against Pto DC3000, but not Pcc……..27 Fig. 2-3 Saccharin and PBZ failed to reduce disease severity by pathogenic fungi C.
higginsianum and B. cinerea. ……….28 Fig. 2-4 Expression of defense-related genes during DC3000 infection………...30 Fig. 2-5 Saccharin induced resistance in jar1, but not in NahG and npr1 plants…………32 Fig. 2-6 Callose deposition induced by saccharin and PBZ.….………33 Fig. S2-1 Effect of saccharin on the growth of Arabidopsis plants. ……….40 Fig. S2-2 Effect of saccharin on the growth of Pto DC3000……….41 Fig. S2-3 Effect of saccharin on expression of SA- and JA/ET-responsive genes and penetration during infection by C. higginsianum.…….………..42 Fig. 3-1 Chemical structures of saccharin and probenazole (PBZ). ……….46 Fig. 3-2 Saccharin and PBZ reduced disease symptom caused by B. graminis.…………52 Fig. 3-3 Expression profiling of wheat defense-related genes by saccharin and PBZ….54 Fig. 3-4 Change in gene expression of wheat in response to B. graminis……….58 Fig. S3-1 Effect of saccharin doses and application methods on the growth of wheat seedlings.……….……….………..60 Fig. S3-2 Foliar application of saccharin reduced disease development of B. graminis...61 Fig. S3-3 The development of powdery mildew fungus B. graminis on wheat seedlings.62 Fig. 4-1 Graphical abstract depicts the mode of action of saccharin in the induction of defenses in the model plant Arabidopsis thaliana.……….…….65
List of Appendices
Appendix 1 Medium recipes for of pathogen culture………76 Appendix 2 Staining of fungal infected leaves with trypan blue………..78 Appendix 3 How to indicate the concentration of fungal suspension and bacterial culture……….80 Appendix 4 Examination of saccharin toxicity on the growth of fungal and bacterial pathogens……….……….………..82 Appendix 5 Callose detection by staining with aniline blue……….84 Appendix 6 Analysis of gene expression……….……….86
Abbreviations
ANOVA - analysis of variance A. thaliana - Arabidopsis thaliana bp - base pair
B. cinerea/ Bc - Botrytis cinerea B. graminis/ Bg - Blumeria graminis cfu/CFU - colony-forming units Cont - control
C. higginsianum/ Ch - Colletotrichum higginsianum Ct - cycle threshold
DMSO - dimethyl sulfoxide dpi - days post-inoculation ET - ethylene
ETI - effector triggered immunity Fig - figure
hpi - hours post-inoculation hpt - hours post-treatment IR - induced resistance
ISR - induced systemic resistance JA - jasmonic acid
KB - King's B LB - Luria-Bertani
mins - minutes OD - optical density
PAMPs - pathogen-associated molecular patterns PRRs - pattern recognition receptors
PBZ - probenazole
Pcc - Pectobacterium carotovorum subsp. carotovorum
Pto DC3000/ DC3000 - Pseudomonas syringae pv. tomato DC3000 PR - pathogenesis-related
qRT-PCR - quantitative real-time polymerase chain reaction ROS - reactive oxygen species
Saccharin - sodium saccharin dihydrate SA - salicylic acid
secs - seconds
SD - standard deviation
SAR - systemic acquired resistance
Chapter 1
General introduction: Induced disease resistance in plants
1. Plant immune system
To survive natural invading pathogens, plants have evolved many defense mechanisms which consist of constitutive and inducible defenses. Constitutive defenses or preexisting defenses, such as physical barriers (waxy cuticles, cell walls) and antimicrobial chemicals (phytoanticipins), serve as the first line of plant protection even in the absence of pathogens (Agrios 2005). Meanwhile, inducible defenses are triggered as a consequence of specific recognition of pathogen-derived molecules by host plant receptors (Jones and Dangl 2006).
In regard to inducible immune, plants respond to pathogens using a two-branched innate immune system which is comprehensively illustrated in a zigzag model proposed by Jones and Dangl (2006). Accordingly, the first branch of immune system utilizes transmembrane pattern recognition receptors (PRRs) (e.g. kinase flagellin sensing 2) that respond to pathogen-associated molecular patterns (PAMPs) (e.g. flagellin from Gram- negative bacteria), resulting in PAMP-triggered immunity (PTI). However, successful pathogens deploy effectors which can interfere with PTI and result in effector-triggered susceptibility (ETS) or basal defense. If a given effector is recognized by NB-LRR protein encoded by most resistance (R)-gene, effector-triggered immunity (ETI) is established as the second branch of plant immune. The activation of PTI or ETI is often associated with the ROS generation, expression of defense-related genes, production of antimicrobial compounds, and hypersensitive cell death response at the infection site, resulting in plant disease resistance and restricts pathogen growth (Coll et al. 2011; Bindschedler et al.
2006; Torres 2010). So far, 100s-1000s of genes typically respond to defense induction have been revealed, together with 10 recognized classes of pathogenesis-related (PR) genes (Bektas and Eulgem 2015).
Both ETI and PTI are also known to utilize a complex network of phytohormone signaling pathways, such as salicylic acid (SA), jasmonic acid (JA) and ethylene (ET) (Glazebrook 2005; Pieterse et al. 2012; Yi et al. 2014). It is now clear that infection with pathogens results in changes in the level of SA, JA or ET (Bari and Jones 2009). While SA- and JA-signaling acts antagonistically in most cases of defense activation, JA- and ET-signaling appears to function synergistically (Glazebrook 2005; Pieterse et al. 2012).
The outcomes of antagonistic cross-talk between SA- and JA/ET-signaling often leads to the host resistance against a certain pathogen group or a distinct pathogen with a particular parasitic habit such as the biotrophs feed on living host tissue, and the necrotrophs kill host tissue and feed on the death (Bostock 2005; Glazebrook 2005). Collectively, effective defenses against biotrophic pathogens largely rely on activation of defense responses regulated by SA-dependent pathway, whereas those against necrotrophic pathogens are mainly associated with JA-mediated signaling (Glazebrook 2005; Thomma et al. 1998). Though, evidence of synergistic interactions between SA- and JA- signaling for conditioning host resistance has also been reported (Bari and Jones 2009). In addition, the lifestyles of different pathogens are not always clearly assigned as pure biotrophs or necrotrophs, particularly in the case of bacterial pathogens (Kraepiel and Barny 2016).
Therefore, the positive or negative cross-talk between SA and JA/ET pathways may be regulated depending on the specific host-pathogen interaction (Glazebrook 2005).
2. Induced resistance (IR)
In addition to local responses limited to pathogen-infected tissues which are presentative for PTI, basal defense and ETI, plants can also adapt systemic immunity which includes two major types of induced resistance: systemic acquired resistance (SAR) and induced systemic resistance (ISR) (Pieterse et al. 1998; van Wees et al. 2000). Besides the direct
activation of defenses, inducible resistance can also lead to the so-called defense priming, resulting in stronger elicitation of those defenses following pathogen attack (Walters et al.
2013). Induced resistance in the plant can be triggered by biotic and abiotic stimuli such as virulent or avirulent pathogens, usage of biocontrol agents, and application of natural or synthetic compounds (Beckers and Conrath 2007).
Systemic acquired resistance (SAR)
SAR can be initiated by local compatible or incompatible interactions or application of SAR-inducing chemicals such as SA and its analogs. This highly desirable resistance helps to protect plants from a broad-spectrum of related or unrelated pathogens in uninfected tissues and organs (Gao et al. 2014). SAR tends to be long-lasting for a period of weeks to months, but is rarely complete, with most inducing agents reducing disease by between 20 and 85% (Fu and Dong 2013; Walters et al. 2013a). In addition, resistance against biotrophs is associated with activation of SA-dependent signaling and SAR (Glazebrook 2005).
The generation of multiple signals at the local and distal sites of elicitation is involved in SAR, which can be typical, for example, an increase of SA levels and enhanced expression of several classical PR genes (Fu and Dong 2013). Some of these PR genes many of which encode PR proteins with antimicrobial activity, such as PR1, PR2, and PR5 serve as robust markers for this systemic immune response (Bektas and Eulgem 2015). In the current concept of the plant immune system, the onset of pathogen- induced SAR is triggered upon local activation of a PTI or ETI responses (Pieterse et al.
2014). Even though the local and systemic accumulation of SA is critical for SAR induction, this hormone is proved not to serve as a general mobile signal for SAR.
Nonexpressor of PR genes1 (NPR1), a transcription coactivator, is widely accepted as a
master regulator of plant defense required for induction of a large set of PR gene, local defense, and SAR. NPR1 translocates to the nucleus when SA accumulation causes changes in cellular redox potential. Wu et al. (2012) reported that NPR1 serves as a receptor for SA. However, contradictory findings suggest that SA might be perceived by the NPR1 paralogs NPR3 and NPR4, which function as SA receptors in a SA- concentration-dependent manner and as E3 ligases that mediate the degradation of NPR1 (Fu et al. 2012). Recently, Ding et al (2018) have revealed that NPR3/NPR4 serves as transcriptional corepressors for SA-responsive genes and SA inhibits their activities to promote the expression of downstream immune regulators. The study further indicated that both NPR1 and NPR3/NPR4 are bona fide SA receptors, but play opposite roles in transcriptional regulation of SA-induced defense gene expression (Ding et al. 2018).
Induced systemic resistance (ISR)
Systemic immunity can be triggered by certain strains of non-pathogenic plant growth- promoting rhizobacteria (PGPR) and fungi (PGPF) leading to induced systemic resistance (ISR) against a broad range of pathogens and insect herbivores. There is a wide variety of PGPR and PGPF including Pseudomonas, Bacillus, Trichoderma, and mycorrhiza species which can sensitize plant immune system for enhanced defense (Walters et al.
2013b; Pieterse et al. 2014).
Unlike SAR, induction of ISR is not associated with the accumulation of SA and PR proteins or PR transcripts in systemic tissues. However, both SAR and ISR require NPR1 as a common regulator of their signaling pathways. It was demonstrated that JA and ET are central players in the regulation of rhizobacteria-mediated ISR, therefore (Glazebrook, 2001). In accordance with its dependency on JA and ET signaling, ISR was
associated with activation of JA/ET-regulated genes and was shown to be effective against necrotrophic pathogens and insect herbivores (Pieterse et al. 2014).
Defense priming
Defense priming is regarded as an intrinsic adaptive part of biologically and chemically induced resistance. Indeed, priming is the plant state of preparing its defensive system for a faster and/or stronger activation of cellular defenses upon invasion, resulting in an enhanced level of resistance. Defense priming, therefore, represents a form of plant immunological memory (Conrath et al. 2002; Mauch-Mani et al. 2017). Compared to constitutively activated resistance, priming generally results in low fitness costs under pathogen pressure and appears to be a common and favorite feature of the plant’s immunity system (Hulten et al. 2010; Conrath et al. 2006). It is proposed that signaling proteins and transcriptional regulators involved in expression of priming remain inactive in enemy-free conditions but provide the plant with the capacity to react with an accelerated defense response upon perception of a pathogen- or insect-derived stress signal (Pieterse et al. 2014).
Synthetic compounds of induced resistance
Plant activators, also referred to as plant resistance activators or plant resistance inducers or elicitors, are compounds that lead to improved protection to pathogen attacks by inducing the plant’s own defense mechanisms (Bektas and Eulgem 2015; Alexandersson et al. 2016).
Unlike common fungicides that directly target pathogens, resulting in the development of drug resistance due to repeatedly exposure, plant activators do not pose such the problem.
According to the Fungicide Resistance Action Committee (FRAC), synthetic chemicals that have been defined as host defense inducers are categorized as code P1,
such as acibenzolar‐S‐methyl (ASM; BTH; BionR; ActigardR); code P2, such as probenazole (PBZ; OryzemateR); and code P3, such as tiadinil (TDL; V-getR) and isotianil (StoutR) (FRAC, 2018; Valerie Toquin et al. 2012). In addition, all of them appear to act as functional analogs of SA and are regarded as SAR inducing compounds (Bektas and Eulgem 2015). Although various synthetic compounds have been identified as plant activator, few of them have reached commercialization due to their phytotoxic effects (Noutoshi et al. 2012; Oostendorp et al. 2001). Such the various resistance-inducing compounds that have been used for studies on the plant immune system were carefully reviewed by Oostendorp et al. (2001) and Bektas and Eulgem (2015).
3. Saccharin: From an artificial sugar to a plant activator
Saccharin was accidentally discovered in 1879 by an American researcher, Constantin Fahlberg when he forgot to wash his hands after working with chemical reactions in the lab and found that his lunch bread tasted unusually sweet (Cohen 1986). Since then, saccharin has been used as a non-caloric artificial sugar to sweeten countless foodstuffs all over the world for it is approximately 300-450 times sweeter than table sugar.
Saccharin is not very soluble in water, and so it is most commonly used in the form of its sodium or calcium salt (Lawrence 2003).
Saccharin is an active metabolite of probenazole
The starting point to address the new role of saccharin as an activator of plant defenses against pathogens would be traced back to the research by Uchiyama et al. (1973), who reported saccharin as one of the active metabolites of probenazole through an analysis of absorption, translocation and metabolism of probenazole in rice plant.
According to Uchiyama et al. (1973), probenazole absorbed by the plants was quickly converted to the metabolite in the following sequence: probenazole → allyl o- sulfamoylbenzoate → saccharin → N-D-glucopyranosyl saccharin. In water, probenazole decomposed rapidly to allyl o-sulfamoylbenzoate which was slowly hydrolyzed to give saccharin (Fig. 1-1). Additionally, the plants were likely to uptake an appreciable amount of allyl o-sulfamoylbenzoate, while detectable amount of probenazole in the plant was only trace. From this study results, the authors postulated that allyl o-sulfamoylbenzoate and saccharin play an important role in the plant defenses as principal active ingredients, which together contribute to the efficacy of probenazole in the field.
Although saccharin (in the form of sodium salt) exhibited almost the same inhibitory effect against rice blast on potted plants in the greenhouse, their efficiency was inferior to probenazole in the field. Possibly, the relative rates of the compounds through the plant membrane as influenced by the polarity of the compounds might be a contributing factor (Uchiyama et al. 1973).
Fig. 1-1. Metabolic fate of probenazole in rice plant. Probenazole is metabolically or non- metabolically converted to allyl o-sulfamoylbenzoate, saccharin and N-D-glucopyranosyl saccharin (Uchiyama et al. 1973).
Known mode of action of saccharin in plant defenses
So far, there is ample evidence showing SAR-inducing activity of saccharin which is previously reported in both dicots and monocots, mainly against (hemi)biotrophic pathogens (Boyle and Walters, 2005, 2006; Koganezawa et al. 1998; Nakashita et al.
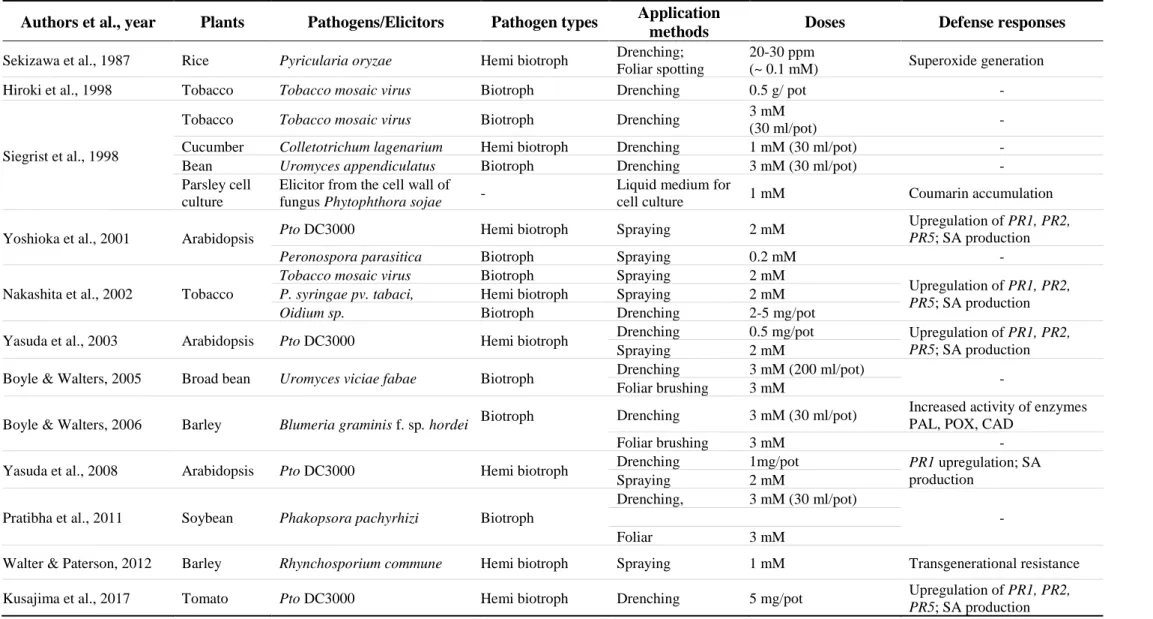
2002; Srivastava et al. 2011; Yoshioka et al. 2001). Table 1-1 provides a brief overview of relevant studies on the efficacy of saccharin as a plant activator of defenses in different host-pathogen systems.
In Arabidopsis and tobacco, saccharin and PBZ were proved to activate salicylic acid (SA)-mediated signaling pathway which is accompanied by the accumulation of SA and expression of PR genes (Nakashita et al. 2002; Yoshioka et al. 2001). Unlike BTH that activate the SA-signaling at the downstream of SA accumulation, saccharin and PBZ act at the upstream of SA induction. However, these compounds induce accumulation of mRNAs from SA-marker genes (PR1, PR2 and PR5) and they all require NPR1 as a common regulator (Lawton et al. 1996; Yoshioka et al. 2001).
Generally, the distinctive role of SA- and JA-signaling and the marker genes associated with systemic acquired resistance (SAR) is not well defined in monocots (De Vleesschauwer et al. 2013; Yoshioka et al. 2001). While saccharin and PBZ were reported to function upstream of salicylic acid (SA) in dicots, little is known about the mechanism of saccharin- and PBZ-induced resistance in monocots. Through an analysis of superoxide generation in rice seedlings, Sekizawa et al. (1987) reported that application of sodium saccharin to rice changed the compatible to incompatible combination of blast fungus races with a rice cultivar. Moreover, a comparison between the enhancing effects of saccharin and N-methylsaccharin on ROS in rice plants also suggests that the location of the biologically active group in the saccharin molecule is situated in its imide group, as methylation of the imide blocks the enhancing ability (Sekizawa et al. 1987). In
addition, Boyle and Walters (2006) showed that saccharin-induced resistance of barley to powdery mildew fungus Blumeria graminis might be somewhat related to the increase in peroxidase and cinnamyl alcohol dehydrogenase activities. A study by Iwai et al. (2007) also revealed that SA is involved in PBZ-induced resistance as a defense signal in adult rice leaves but not in young leaves.
4. Objectives of this study
In modern agriculture, application of chemical pesticides is one of the main strategies which has been employed to combat crop pathogens. However, this method of crop protection also remains many problems in terms of drug resistance development of pathogens, side effects on non-target organisms, and polluted foods and environment.
Chemically induced resistance by plant activators can provide another useful option for practical crop protection, resulting to reduce the amount of toxic pesticides.
To explore the use of candidate compounds acting as plant activators, understanding their efficacy as well as the molecular mechanism underlying defense induction in the laboratory is essentially needed. In the current study, we examine two known compounds saccharin and PBZ in the laboratory conditions with the objectives as follows:
1. To further elucidate the mode of action and the effectiveness of saccharin and its parental compound PBZ in the model dicotyledonous plant Arabidopsis thaliana against bacteriaPseudomonas syringae pv. tomato DC3000 and Pectobacterium carotovorum subsp. carotovorum and fungi Botrytis cinerea and Colletotrichum higginsianum.
2. To examine the efficacy of saccharin and PBZ in resistance induction against the powdery mildew fungus Blumeria graminis f. sp. tritici in the monocotyledonous crop Triticum aestivum (bread wheat) and to analyze expression profiles of wheat resistance- associated genes affected by both compounds.
Table 1-1 Review on other relevant studies on saccharin as a plant activator of defense responses Authors et al., year Plants Pathogens/Elicitors Pathogen types Application
methods Doses Defense responses
Sekizawa et al., 1987 Rice Pyricularia oryzae Hemi biotroph Drenching;
Foliar spotting
20-30 ppm
(~ 0.1 mM) Superoxide generation Hiroki et al., 1998 Tobacco Tobacco mosaic virus Biotroph Drenching 0.5 g/ pot -
Siegrist et al., 1998
Tobacco Tobacco mosaic virus Biotroph Drenching 3 mM
(30 ml/pot) -
Cucumber Colletotrichum lagenarium Hemi biotroph Drenching 1 mM (30 ml/pot) -
Bean Uromyces appendiculatus Biotroph Drenching 3 mM (30 ml/pot) -
Parsley cell culture
Elicitor from the cell wall of
fungus Phytophthora sojae - Liquid medium for
cell culture 1 mM Coumarin accumulation Yoshioka et al., 2001 Arabidopsis Pto DC3000 Hemi biotroph Spraying 2 mM Upregulation of PR1, PR2,
PR5; SA production
Peronospora parasitica Biotroph Spraying 0.2 mM -
Nakashita et al., 2002 Tobacco
Tobacco mosaic virus Biotroph Spraying 2 mM
Upregulation of PR1, PR2, PR5; SA production P. syringae pv. tabaci, Hemi biotroph Spraying 2 mM
Oidium sp. Biotroph Drenching 2-5 mg/pot
Yasuda et al., 2003 Arabidopsis Pto DC3000 Hemi biotroph Drenching 0.5 mg/pot Upregulation of PR1, PR2, PR5; SA production Spraying 2 mM
Boyle & Walters, 2005 Broad bean Uromyces viciae fabae Biotroph Drenching 3 mM (200 ml/pot) Foliar brushing 3 mM -
Boyle & Walters, 2006 Barley Blumeria graminis f. sp. hordei Biotroph Drenching 3 mM (30 ml/pot) Increased activity of enzymes PAL, POX, CAD
Foliar brushing 3 mM -
Yasuda et al., 2008 Arabidopsis Pto DC3000 Hemi biotroph Drenching 1mg/pot PR1 upregulation; SA production
Spraying 2 mM Pratibha et al., 2011 Soybean Phakopsora pachyrhizi Biotroph
Drenching, 3 mM (30 ml/pot)
- Foliar 3 mM
Walter & Paterson, 2012 Barley Rhynchosporium commune Hemi biotroph Spraying 1 mM Transgenerational resistance Kusajima et al., 2017 Tomato Pto DC3000 Hemi biotroph Drenching 5 mg/pot Upregulation of PR1, PR2,
PR5; SA production
Chapter 2
Mode of action of saccharin in Arabidopsis plant
Modified from: Antagonism between SA- and JA- signaling conditioned by saccharin in Arabidopsis thaliana renders resistance to a specific pathogen
Full-length article
Journal of General Plant Pathology (2019, in press).
Le Thi Phuong1,2, Aprilia Nur Fitrianti1, Mai Thanh Luan1,2, Hidenori Matsui1, Yoshiteru Noutoshi1, Mikihiro Yamamoto1, Yuki Ichinose1, Tomonori Shiraishi1,3 and Kazuhiro Toyoda1*
1Laboratory of Plant Pathology and Genetic Engineering, Graduate School of Environmental and Life Science, Okayama University, 1-1-1 Tsushima-naka, Kita-ku, Okayama 700-8530, Japan.
2Hong Duc University, No 565 Quang Trung Street, Dong Ve Ward, Thanh Hoa-city, Vietnam.
3Present address: Research Institute of Biological Sciences (RIBS), Okayama, 7549-1 Yoshikawa, Kibichuo-cho, Kaga-gun, Okayama 716-1241, Japan.
*Corresponding author: Kazuhiro Toyoda, Ph.D.
Abstract
Saccharin is one of the metabolites of probenazole (PBZ) in plants and acts as a plant activator. Our study of the mechanism underlying saccharin-induced systemic acquired resistance in Arabidopsis thaliana suggests an antagonistic interaction between salicylic acid (SA)- and jasmonic acid (JA)-signaling as revealed through gene expression analyses.
In wild-type plants (Col-0) exposed to saccharin over a time course, there was a consistent increase in callose deposition and in expression of SA marker genes, PR1 and PR2, which coincided with a decrease in expression of JA marker genes such as VSP2, LOX2 and PDF1.2. Actually, pretreatment of Col-0 with saccharin or PBZ conferred resistance to Pseudomonas syringae pv. tomato DC3000, but not to Pectobacterium carotovorum subsp. carotovorum, Botrytis cinerea, and Colletotrichum higginsianum. Enhanced expression of SA- and JA-marker genes as well as the augmented deposition of callose, were evidently observed when challenged by virulent DC3000 in saccharin-pretreated plants. Consistently, pretreatment of saccharin and PBZ with SA- and JA-defective mutants showed diminished resistance in NahG and npr1 mutant, but not in jar1 mutant plants, suggesting that saccharin and PBZ induce resistance in Arabidopsis against Pto DC3000 mainly via activation of SA-signaling leading to suppression of JA/ET- signaling and vice versa. Collectively, an antagonism between SA- and JA-signaling conditioned by saccharin renders resistance to a specific pathogen in Arabidopsis.
Keywords: Induced resistance, Jasmonic acid (JA), Saccharin, Salicylic acid (SA), Signaling, Probenazole (PBZ).
1. Introduction
Throughout the process of co-evolution and interaction, both the plants and pathogens develop their own strategic mechanisms to overcome each other for their benefits. Plants rely on a sophisticated immune system to weaken or terminate pathogen attacks, which comprises of PAMP-triggered immunity (PTI) as the first branch of immune responses and effector-triggered immunity (ETI) as the second branch (Jones and Dangl 2006;
Zipfel 2009). During PTI and ETI, a variety of immune responses are triggered including hypersensitive response (HR) (Coll et al. 2011), generation of reactive oxygen species (ROS) (Bindschedler et al. 2006; Torres 2010), production of anti-microbial phytoalexins (Schuhegger et al. 2006), deposition of callose (Ellinger and Voigt 2014) and transcriptional re-programming to activate defense-related genes (Cecchini et al. 2015).
Both ETI and PTI are known to utilize common phytohormone signaling pathways including salicylic acid (SA), jasmonic acid (JA) and ethylene (ET) (Glazebrook 2005;
Pieterse et al. 2012; Yi et al. 2014). While SA- and JA-signaling acts antagonistically in most cases of defense activation, JA- and ET-signaling appears to function synergistically (Glazebrook 2005; Pieterse et al. 2012). The outcomes of antagonistic cross-talk between SA- and JA/ET-signaling often leads to the host resistance against a certain pathogen group or a distinct pathogen with a particular parasitic habit (e.g., biotrophs, hemibiotrophs and necrotrophs) (Bostock 2005). In general, effective defenses against biotrophic pathogens largely rely on activation of defense responses regulated by SA- dependent pathway, whereas those against necrotrophic pathogens are mainly associated with JA-mediated signaling (Glazebrook 2005; Thomma et al. 1998).
Plant immune responses can be evoked by a various source of stimuli such as pathogen attacks, application of biocontrol agents, and natural or synthetic compounds (Beckers and Conrath 2007). Although various synthetic compounds have been
discovered as plant activator, few of them have reached commercialization due to their phytotoxic effects (Noutoshi et al. 2012; Oostendorp et al. 2001). One of the most effective and commercially available plant activators is probenazole (3-allyloxy-1,2- benzisothiazole-1,1-dioxide; PBZ), a synthetic compound which has been used for over four decades for controlling rice blast diseases (Watanabe et al. 1977). Some of the immune responses like the oxidative burst (Iwata et al. 1980; Sekizawa et al. 1985) and increased accumulation of SA and PR proteins (Iwai et al. 2007) are evidently enhanced by PBZ. PBZ converts into saccharin metabolically in plants or physically in the aqueous medium; therefore, it is tempting to postulate that saccharin plays an important role as one of the principal active ingredients (Boyle and Walters 2005; Oostendorp et al. 2001;
Uchiyama et al. 1973).
The application of saccharin changes the compatible to incompatible interaction of blast fungus races and a rice cultivar, possibly owing to an augmented superoxide generation (Sekizawa et al. 1987). Saccharin, but not probenazole activated cultured parsley cells for an enhanced elicitor-mediated furanocoumarin accumulation in response to fungal cell wall elicitors (Siegrist et al. 1998). Both PBZ and saccharin activate expression of PR genes and development of systemic acquired resistance (SAR) in tobacco and Arabidopsis plants, upstream of SA accumulation (Nakashita et al. 2002;
Yasuda et al. 2008; Yoshioka et al. 2001). So far, there is ample evidence that shows the potential of saccharin to activate SAR in both mono- and dicots mostly against (hemi)biotrophic pathogens including fungi, bacteria and viruses. For example, treatment with saccharin enhanced resistance in Arabidopsis against Peronospora parasitica, in tobacco against Oidium sp. and tobacco mosaic virus (TMV) (Koganezawa et al. 1998;
Nakashita et al 2002), in broad bean against Uromyces viciae-fabae (Boyle and Walters 2005), in barley against Blumeria graminis f. sp. hordei (Boyle and Walters 2006), and in
soybean against Phakopsora pachyrhizi (Srivastava et al. 2011). Interestingly, when parental barleys are treated with saccharin, the state of induced resistance is transmitted to the progeny and helps to resist against hemibiotrophic fungus Rhynchosporium commune (Walters and Paterson 2012).
Even though the mode of action of saccharin for the induction of plant immune responses has been characterized to some extent, it remains to be additionally elucidated.
The purpose of this study is thus to further clarify the molecular mechanism of plants underlying saccharin-induced immune responses, and to point out again the cautions on the use of saccharin or similar chemical(s) for plant disease control.In this study, we investigated the effect of saccharin and its parental compound, PBZ, on immune responses of Arabidopsis plants before and during pathogen infection. We report that saccharin and PBZ induce resistance to a hemibiotrophic bacterium Pseudomonas syringae pv. tomato DC3000 (Pto DC3000; DC3000), but not to a necrotrophic bacterium, Pectobacterium carotovorum subsp. carotovorum (Pcc), a necrotrophic fungus, Botrytis cinerea (Bc), and a hemibiotrophic fungus, Collectotrichum higgisianum (Ch). Rapid activation of SA-regulated genes and the concomitant suppression of JA-regulated genes by saccharin and PBZ may be the contributing event which accounts for the induced resistance to Pto DC3000 and the increased susceptibility to Bc. In addition, we observed a diminished resistance to Pto DC3000 in NahG and npr1 mutant, but not in jar1 mutant plants pretreated with saccharin and PBZ. Our present results together suggest that saccharin- and PBZ-treated Arabidopsis plants triggered resistance against Pto DC3000 probably via activation of SA-signaling, resulting in suppression of JA/ET-signaling and vice versa. Combined with other findings that both saccharin and PBZ upregulated expression of other defense-related genes and accelerated deposition of callose in Arabidopsis plants, we demonstrate an antagonistic interaction between SA- and JA-
signaling conditioned by saccharin renders resistance to a specific pathogen in Arabidopsis.
2. Materials and methods Plants
Seeds of Arabidopsis thaliana were sown on water-swelled Jiffy-7 peat pellets (AS Jiffy Products, Oslo, Norway) and grown for 2 weeks, and the seedlings were transferred to small plastic pots containing Supermix-A soil (Sakata Seed Co., Ltd., Yokohama, Japan) mixed with vermiculite in ratio 1:1. Seedlings were grown in the growth room at 22C, with a 10 h light/14 h dark cycle at 11.8 Wm-2 for additional 3-4 weeks before use. The mutants, salicylic acid (SA)-deficient NahG transgenic line (Delaney et al. 1994), npr1- 2 (Cao et al. 1997) and jar1-1 mutant impaired in JA-signaling (Staswick and Tiryaki 2004) were used to evaluate the role of saccharin in induced resistance in Arabidopsis, with a particular focus on the antagonism between SA- and JA-mediated signaling pathways. The NahG transgenic plant and mutants jar1 and npr1‐2 were in the A. thaliana Col‐0 background.
Pathogens
Pseudomonas syringae pv. tomato DC3000NalR (Pto DC3000) was cultivated on/in King's B (KB) medium at 28°C as described previously (Ishiga and Ichinose 2016).
Pectobacterium carotovorum subsp. carotovorum (Pcc) strain Pc1 were cultivated at 28°C on/in Luria-Bertani (LB) medium (Haque et al. 2015). Agar at 1.5% (w/v) was added when cultivated on solid medium. Antibiotic nalidixic acid was used for selection at a final concentration of 50 µg/ml. For use in preparation of the inoculum, bacteria were plated and grown on solid medium, then scraped off the plate. Bacteria were then
suspended and diluted in distilled water to appropriate concentrations. Fungal pathogens, Collectotrichum higginsianum (Ch) and Botrytis cinerea (Bc) were cultured on potato dextrose agar (PDA) (Becton, Dickinson and Company, USA) at 23°C in the dark (with blue light for Bc). Conidia of cultures grown for 10 days were suspended in distilled water for Ch or in 1% Maltose Sabouroud Broth for Bc by gentle scraping and were filtered through sterile cheesecloth to remove hyphae.
Chemicals
Sodium saccharin dihydrate (saccharin) and probenazole (PBZ) were purchased from Wako Pure Chemical Industries (Osaka, Japan). Saccharin was dissolved in distilled water.
PBZ was dissolved in dimethyl sulfoxide (DMSO) to give a stock concentration of 20 mM. The stock solution was diluted with distilled water to give a final concentration of 0.1 mM, thus containing 0.5% (v/v) DMSO. PBZ was used as a positive control that induces SA-dependent resistance throughout experiments.
Phytotoxicity in planta and anti-bacterial effect in vitro of saccharin
To assess saccharin phytotoxicity, 6-week-old Col-0 plants were treated with water (control) or saccharin solution ranging from 0.1-10 mM by foliar spraying with a hand- pump spray bottle (until dews evenly form on leaf surface) or by drenching 10 ml of test solution into soil. The plant growth (leaf size, shape, and color) after treatment were carefully observed (supplementary Fig. S2-1).
To assess the direct antibacterial effect of saccharin, Pto DC3000 was grown at 28°C on KB liquid medium with shaking to reach OD600 = 1 (or 5 × 10⁸ colony-forming units (cfu)/ml). Ten microliters of bacterial suspension were diluted with 3 ml of fresh KB medium, then 3 µl of the diluted bacterium was placed into 3 ml of KB medium
containing water or saccharin of 0.1, 1 or 10 mM at final concentrations. The OD600 value was measured in a course of 5 days using Biochrom WPA Colorimeter CO7500 (Biochrom Ltd., Cambridge, UK). Similarly, bacteria were gently scraped off from plate culture, suspended in distilled water and diluted to OD600 = 10-5 and 10-4 (5 × 10 cfu/ml and 5 × 10² cfu/ml). Droplets of 10 µl diluted bacterium were plated onto KB agar plate containing saccharin at indicated concentrations. The number of bacteria was determined by counting the colonies (see Appendix 4 for further details). Three replicates were made for each treatment (supplementary Fig. S2-2).
Chemical treatments and inoculation bioassays
Arabidopsis plants were pretreated for 2 days with/ without either saccharin or PBZ, then challenged with bacterial or fungal pathogens on 3 fully expanded, rosette leaves per plant.
After inoculation, plants were placed under high humidity in a plastic container covered with a clear lid. Pto DC3000 infection assay was done as described previously by Katagiri et al. (2002). Briefly, bacterial suspension (OD600 = 0.0001 or 5 × 10⁴ cfu/ml) was infiltrated from the abaxial side into a sample leaf using a 1 ml syringe without a needle.
Leaves were considered diseased when showing chlorosis and necrosis (Katagiri et al.
2002). For counting bacterial proliferation, three infected leaves were harvested from one plant among three biological replicates at days post-inoculation (dpi), and two leaf discs were obtained from one leaf using a Biopsy Punch (0.5 cm in diameter; KAI Medical, Seki City, Gifu Prefecture, Japan). A total of 6 leaf discs from one plant was combined to make one biological sample, then crushed by zirconia beads in distilled water using a Micro Smash M-100 (Tomy Seiko Co., Ltd., Tokyo, Japan). Appropriate dilutions were made and plated on a fresh KB agar plate. The number of bacteria was determined by counting colonies (see Appendix 3 for further details).
For the Pcc infection assay, selected leaves were punctured with a pipette tip and inoculated with 10 μl liquid culture of Pcc (OD600 = 0.01 or 4 × 10⁶ cfu/ml) at injured sites according to Hsiao et al. (2017). Photos of bacterial soft rot symptom on infected leaves were taken at 1 and 2 dpi, and lesion area was measured at 1 dpi. For Ch and Bc infection assay, 10 µl of spore suspension (2 × 10⁵ spores/ml) were spotted onto the adaxial side of leaves. Infection by Ch was observed microscopically at 3 dpi for appressoria and infection hyphae formation. Symptoms and lesion area on leaves by Ch or Bc were assessed at 4 to 5 dpi. Lesion area caused by tested pathogens was calculated using the ImageJ software (https://imagej.net).
Analysis of gene expression by quantitative reverse transcriptase-polymerase (qRT- PCR)
For the assessment of induced gene expression over the time course, wild-type plants were treated with saccharin or PBZ for 3, 6, 12, 24, 48 and 72 hours prior to RNA extraction. The water-treated plants were used as a control. For the assessment of gene expression during bacterial infection, plants were pretreated with either saccharin or PBZ for 2 days and subsequently inoculated with Pto DC3000 (OD600 = 0.0001) for 12 and 24 hours before RNA extraction. The water-treated and uninoculated plants were used as a control.
The plant material was fixed in liquid nitrogen and then crushed using zirconia beads in a Micro Smash M-100 (Tomy Seiko Co., Ltd). RNA was extracted using a Total Plant RNA Miniprep Purification Kit (GMbiolab Co, Ltd. Taichung City, Taiwan) according to the manufacturer’s protocol. Sample quality was assessed using gel electrophoresis and measured using the spectrophotometer NanoDrop 1000UV/Vis (Thermo Fisher Scientific, Waltham, MA, USA). Total RNA (0.5 µg of each sample) was
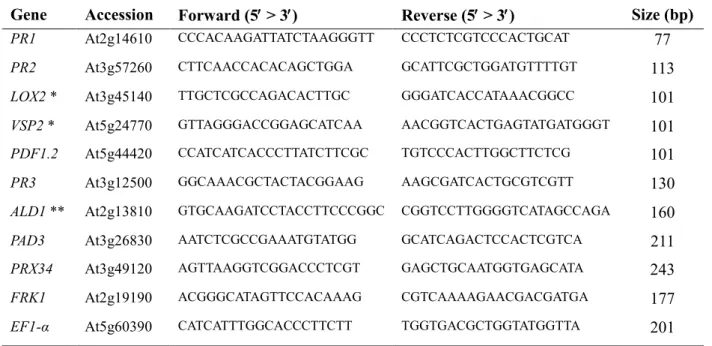
reverse-transcribed at 42C to synthesize cDNA in a reaction mixture (10 l) containing 10 U of RNase inhibitor (Promega, Madison, WI, USA), 1 mM dNTPs, 0.4 µg of oligo(dT)12-18 and 2.5 U of AMV reverse transcriptase (Takara Bio, Otsu, Japan), followed by heat inactivation at 60C for 10 min. cDNA was amplified in 10 µl of reaction volume containing 5 µl of KAPA SYBR FAST Universal qPCR Master Mix (KAPA Biosystems, Boston, MA, USA) and 100 nM of each gene-specific primer set, listed in Table 2-1.
Table 2-1 Summary information for primer sequences used for qRT-PCR
Gene Accession Forward (5 > 3) Reverse (5 > 3) Size (bp) PR1 At2g14610 CCCACAAGATTATCTAAGGGTT CCCTCTCGTCCCACTGCAT 77 PR2 At3g57260 CTTCAACCACACAGCTGGA GCATTCGCTGGATGTTTTGT 113 LOX2 * At3g45140 TTGCTCGCCAGACACTTGC GGGATCACCATAAACGGCC 101 VSP2 * At5g24770 GTTAGGGACCGGAGCATCAA AACGGTCACTGAGTATGATGGGT 101 PDF1.2 At5g44420 CCATCATCACCCTTATCTTCGC TGTCCCACTTGGCTTCTCG 101 PR3 At3g12500 GGCAAACGCTACTACGGAAG AAGCGATCACTGCGTCGTT 130 ALD1 ** At2g13810 GTGCAAGATCCTACCTTCCCGGC CGGTCCTTGGGGTCATAGCCAGA 160 PAD3 At3g26830 AATCTCGCCGAAATGTATGG GCATCAGACTCCACTCGTCA 211 PRX34 At3g49120 AGTTAAGGTCGGACCCTCGT GAGCTGCAATGGTGAGCATA 243 FRK1 At2g19190 ACGGGCATAGTTCCACAAAG CGTCAAAAGAACGACGATGA 177 EF1-α At5g60390 CATCATTTGGCACCCTTCTT TGGTGACGCTGGTATGGTTA 201
* Fujimoto et al. (2015), ** Navarova et al. (2012)
The quantitative PCR reactions were performed on a Shimadzu GVP-9600 Gene Detection System (Shimadzu, Kyoto, Japan) using the following amplification program:
an initial incubation cycle of 95°C for 3 minutes, 50 cycles at 95°C for 3 seconds, 60°C for 30 seconds, 1 ending cycle at 72°C for 2 minutes and a final melt curve analysis. The resulting qRT-PCR data, cycle threshold (Ct) values, were used to calculate the relative mRNA abundance according to the cycle threshold method (Livak and Schmittgen 2001). The values were normalized to those of the reference gene EF1-α and expressed
relative to the water-treated control sample. The detailed procedure for analysis of gene expression is described in Appendix 6.
Callose detection by aniline blue staining
For the assessment of saccharin-induced callose deposition over the time course, Col-0 plants were treated with/ without saccharin for 3, 6, 12, 24, 48 and 72 h prior to leaf harvest for aniline staining. The water-treated plants were used as a control. For measurement of callose deposition during bacterial infection, plants were pretreated with either saccharin or PBZ for 2 days and subsequently infected with Pto DC3000 (OD600 = 0.0001) for 24 and 48 h prior to aniline staining. In situ detection of callose was performed as described previously by Survila et al. (2016) with minor modifications. Briefly, leaves were harvested and placed in sterile 6-well plates, then washed with acetic acid:ethanol (1:3, by vol.) at room temperature for 6 h to destain chlorophyll from the leaves, followed by 70% (v/v) ethanol for 2 hours, and finally water for 2 h twice. Leaves were stained with 0.5% (w/v) aniline blue (Nacarai Tesque, Tokyo, Japan) in 0.1 M potassium phosphate buffer (pH 9) for at least 1 hour in the dark, transferred to 50% glycerol (Sigma) and examined under Olympus IX70 inverted fluorescent microscope (Olympus, Tokyo, Japan) equipped with excitation filter 400-440 nm and emission filter 475 nm. The number of callose deposits (per 1 mm2) was calculated using the ImageJ software (see Appendix 5 for further details).
Light microscopy
The inoculated leaves were fixed with a mixture of ethanol and acetic acid (24:1, v/v) and decolorized with the same mixture at room temperature overnight and stained with 0.5%
(w/v) cotton blue (Nacarai Tesque, Tokyo, Japan) before observation. The samples were
observed with differential interference contrast (DIC) microscopy (Olympus BX60, Olympus) as described previously (Suzuki et al. 2017).
Statistical analysis
Statistical analyses were performed using the KyPlot 5.0 statistic software (KyensLab Inc., Tokyo, Japan) with tools for Student’s t-test for the two means, Tukey’s test and Dunnett’s test for the multiple comparisons of means. Statistical significance was considered when p < 0.05. Data are presented as mean ± standard deviation (SD). All experiments were repeated at least three times with similar results and a representative result was presented.
3. Results
Expression of defense-related genes by saccharin and PBZ
The effect of saccharin and PBZ on expression of 10 defense-related genes was analyzed in Arabidopsis wild-type plants (Fig. 2-1). Expression was assessed for PR1 and PR2, which are markers of SA-signaling; LOX2 and VSP2, which are markers of JA signaling;
and PR3 and PDF1.2, which are indicators of JA/ET-signaling (Seo et al. 2016). Other examined genes include ALD1 (AGD2-Like Defense Response Protein1) which encodes an L-lysine alpha-aminotransferase functioning in the pipecolic acid biosynthetic pathway, where it catalyzes the biochemical conversion of lysine to epsilon-amino-alpha- ketocaproic acid(Navarova et al. 2012; Song et al. 2004); PAD3 (Phytoalexin deficient 3) which encodes the cytochrome P450 enzyme 71B15 catalyzing the final step in camalexin biosynthesis (Schuhegger et al. 2006); PRX34 (Peroxidase), which is one of key apoplastic peroxidase genes responsible for ROS generation (Bindschedler et al.
2006; Zhao et al. 2019); and FRK1 (Flg22-induced receptor-like kinase1) which is a molecular marker for MAMP responses during PTI (Yeh et al. 2015).
Both saccharin and PBZ induced the early accumulation of transcripts of SA- signaling genes (PR1, PR2) at around 3 and 6 hours post-treatment (hpt). Expression levels of PR1 and PR2 consistently increased over time in plants treated with saccharin and PBZ, with peaks at 72 hpt (Fig. 2-1a, b). This result is in agreement with the previous findings by Yoshioka et al. (2001) that PBZ and saccharin activated the expression of SA- signaling genes (PR1, PR2, and PR5) in Arabidopsis within 6 h and 48 h after treatment.
In contrast, expression of JA and JA/ET signaling marker genes was significantly suppressed by saccharin and PBZ within the time course in the cases of LOX2 and VSP2 or at the later points in time in the case of PDF1.2 (Fig. 2-1c-e). PR3 did not seem to respond to both saccharin and PBZ over the time course of treatment (Fig. 2-1f). In addition, expression of ALD1, PAD3, PRX34, and FRK1 was significantly upregulated by saccharin and PBZ, with peaks at around 24 - 48 hpt. However, transcript levels of these 4 genes were quickly dropped or even not detected at 72 hpt (Fig. 2-1g-j).
Fig. 2-1 Expression of defense-related genes after chemical treatment. Col-0 plants were sprayed with water (as a control), saccharin (1 mM) or PBZ (0.1 mM), then leaves were harvested at indicated points in time after treatment and subjected to qPCR. Transcriptional levels of SA marker genes (a, b), JA-marker genes (c, d), JA/ET marker genes (e, f) and other defense-related genes (g-j) were analyzed. The expression value of genes was normalized using EF1-α as an internal standard and expressed relative to average levels in the control (set at 1). Expression level
is plotted on a log10 scale for a-b (insets) and d-f. Data present the average ± SD from the triplicate reaction in each experiment. Asterisks indicate significant differences from the control at each time point. Dunnett’s test, *p < 0.05, **p < 0.01, ***p < 0.001.
Saccharin and PBZ enhanced resistance to bacterium Pto DC3000, but not to Pcc We examined whether the exogenous application of saccharin and PBZ can induce disease resistance to a hemibiotrophic bacterium, Pto DC3000, and a necrotrophic bacterium, Pcc, in Col-0 plants. As shown in Fig. 2-2a, saccharin and PBZ reduced the disease severity caused by Pto DC3000, but not by Pcc (Fig. 2-2c). Three days post- inoculation (dpi), plants pretreated with saccharin or PBZ showed less severe disease symptoms (yellowish) as compared to those pretreated with water (necrosis and water- soaked) (Fig. 2-2a). The less severe symptoms were accompanied by the reduced growth of Pto DC3000. Bacterial proliferation in leaves pretreated with saccharin and PBZ was significantly reduced at 24 hpi and 48 hpi by approximately 10% and 30%, respectively, as compared with the control (Fig. 2-2b). In contrast to the case of Pto DC3000, pretreatment of saccharin and PBZ failed to reduce disease severity caused by bacterium Pcc. Soft rot lesion area was slightly higher in saccharin and PBZ treatment; however, there was no significant difference when compared to the control (Fig. 2-2c, d).
Fig. 2-2 Saccharin conferred resistance in Col-0 against DC3000, but not Pcc. Col-0 plants were pretreated for 2 days with water (as a control), saccharin (1 mM), or PBZ (0.1 mM), then three leaves of each plant (red arrows) were inoculated with DC3000 by infiltration (OD600 = 0.0001) or with Pcc by droplet (OD600 = 0.01). a Disease symptoms caused by DC3000 at 3 dpi. b Leaf discs were harvested at 0, 1 and 2 dpi and the bacterial growth was measured by counting the number of cfu. c Disease symptoms caused by Pcc at 1 and 2 dpi. d The lesion area (mm2) on leaves were measured at 1 dpi using the software ImageJ. Bars present the mean values (± SD) of colony-forming units (cfu) per cm2 or lesion area in mm2. Asterisks indicate significant differences from the control. Dunnett’s-test, *p < 0.05, **p < 0.01, ***p < 0.001.
Saccharin and PBZ failed to protect Arabidopsis from fungal pathogens
Given that saccharin and PBZ induced resistance to Pto DC3000, but not to Pcc, we examined whether the same effect can be observed with fungal pathogens, namely Ch, a
hemibiotroph causing anthracnose disease, and Bc, a necrotroph causing gray mold.
Expectedly, pretreatment with saccharin and PBZ to Col-0 plants failed to reduce disease severity caused by both fungal pathogens (Fig. 2-3a-d). Ahead of infection, symptoms caused by Ch seemed to remain similar between treatments at 5 dpi (Fig. 2-3c, d). On the other hand, inoculation with Bc caused increased susceptibility accompanied with severer symptoms and higher lesion area in the leaves pretreated with saccharin and PBZ at 4 dpi (Fig. 2-3a, b).
Fig. 2-3 Saccharin and PBZ failed to reduce disease severity by pathogenic fungi Ch and Bc. Col- 0 plants were pretreated for 2 days with water (as a control), saccharin (1 mM) or PBZ (0.1 mM), then inoculated with Ch or Bc at concentration of 5 × 10⁵ spores/ml a, b Lesion area (4 dpi) and disease symptoms (5 dpi) caused by Bc. c, d Lesion area and disease symptoms caused by Ch at 5 dpi. The lesion area (mm2) on leaves was calculated by the software ImageJ. Bars present the mean values (± SD) of lesion area in mm2. Asterisks indicate significant differences from the control. Dunnett’s-test, *p < 0.05, **p < 0.01.
Expression of defense-related genes during bacterial infection
In order to gain more insight into the mechanism of SAR induced by saccharin and PBZ, we examined expression of the same set of genes during Pto DC3000 infection in Col-0 plants with or without two compounds (Fig. 2-4). Expression of SA-signaling marker genes (PR1, PR2) was typically induced by Pto DC3000 within 12 and 24 hpi in water- pretreated plants, but was more strongly enhanced in plants pretreated with saccharin or PBZ (Fig. 2-4a, b). Expression of JA-responsive genes (VSP2, LOX2) and a JA/ET- responsive gene (PDF1.2), on the other hand, was found to be significantly enhanced at 24 hpi by Pto DC3000 in plants pretreated with water, but it was suppressed in plants pretreated with saccharin or PBZ (Fig. 2-4c-e). Our result of activation of JA-responsive genes by Pto DC3000 is consistent with the finding of Brooks et al. (2005) that Pto DC3000 strongly induced expression of LOX2 and PDF1.2 at 24 hpi through secretion of phytotoxin coronatine.
Pretreatment with saccharin and PBZ to Col-0 plants also enhanced expression of other defense-related genes (Fig. 2-4g-j). Marked up-regulated expression was observed at 12 and 24 hpi for ALD1 and PRX34 and at 12 hpi for PAD3 and FRK1 in plants pretreated with saccharin and PBZ, suggesting the involvement of these genes in induced resistance to Pto DC3000. At 24 hpi, the enhanced expression of PAD3 and FRK1 faded or was abolished since there were no significant differences in expression between the treatments (Fig. 2-4h, i).
Fig. 2-4 Expression of defense-related genes during DC3000 infection. Col-0 plants were pretreated with water (as a control), saccharin (1 mM) or PBZ (0.1 mM) for 2 days, then inoculated with DC3000 by infiltration (OD600 = 0.0001). Leaves were harvested at 12, 24 hpi and subjected to qPCR. The water-treated and uninoculated plants were used as a control. The expression value of genes was normalized using EF1-α as an internal standard and expressed relative to average levels in the control (set at 1). Expression level is plotted on a log10 scale for PR1, PR2 and PDF1.2. Data present the average ± SD from the triplicate reaction in each
experiment. Asterisks indicate significant differences from water-treated and inoculated plants.
Student’s t-test,*p < 0.05, **p < 0.01, ***p < 0.001.
Absence of SA compromised saccharin- and PBZ-induced resistance
To further confirm which phytohormone is involved in SAR induced by saccharin and PBZ, Arabidopsis mutants impaired in SA- or JA- signaling pathways were tested for the ability to induce resistance. Saccharin and PBZ pretreatment did not protect transgenic NahG and npr1 plants against Pto DC3000, but enhanced resistance in both Col-0 and jar1 plants (Fig. 2-5). In contrast, a significant reduction in bacterial proliferation at 2 dpi in Col-0 and jar1 plants was observed when pretreated with either saccharin or PBZ as compared to the plants pretreated with water. Consistently, NahG and npr1 plants allowed a higher number of bacterial proliferation, eventually causing severe disease symptoms (Fig. 2-5a, b).
Saccharin and PBZ induced callose deposition in Arabidopsis
Callose is a -1,3-glucan cell wall polymer with some 1,6-branches which is deposited between the plasma membrane and the cell wall to act as a physical barrier to stop or slow invading pathogens (Voigt 2014; Xin and He 2013). Here, we observed cytologically that callose deposition in plants treated with saccharin and PBZ was detectable as early as 24 h after treatment and peaked at around 48-72 hpt (Fig. 2-6a, b). In addition, callose deposition was also increased upon infection by Pto DC3000 in control-treated plants, but was further augmented in plants pretreated with saccharin or PBZ (Fig. 2-6c, d).
Fig. 2-5 Saccharin induced resistance in jar1, but not in NahG and npr1 plants. Plants were pretreated for 2 days with water (as a control), saccharin (1 mM) or PBZ (0.1 mM), then three leaves of each plant (red arrows) were challenged by DC3000 infiltration (OD600 = 0.0001). a Disease symptoms of representative plants were photted at 3 dpi. b Leaf discs were harvested at 2 dpi and assessed for bacterial growth by counting the number of colonies. Bars present the mean values (± SD) of colony-forming units (cfu) per cm2. Asterisks indicate significant differences from the control. Dunnett’s-test, ***p < 0.001.
Fig. 2-6 Callose deposition induced by saccharin and PBZ. Col-0 plants were sprayed with water (as a control), saccharin (1 mM) or PBZ (0.1 mM), then leaves were harvested at indicated points in time after treatment (a, b), or 2-day-pretreated leaves were challenged by DC3000 infiltration (OD600 = 0.0001) and then harvested at 24 and 48 hpi (c, d). Harvested leaves were stained with aniline blue and examined for callose deposition. a, c Visualized callose deposits under a fluorescent microscope. b, d Number of callose deposits was calculated by the software ImageJ.
Bars present the mean values (± SD) of the number of callose deposits per 1 mm2. Asterisks indicate significant differences from the control at each time point. Dunnett’s-test, *p < 0.05, **p
< 0.01, ***p < 0.001. Scale bar, 500 µm. nd, not detectable.