INVITED PAPER
Special Section on Emerging Technologies on Ambient Sensor Networks toward Future GenerationE ff ective Application of ICT in Food and Agricultural Sector — Optical Sensing is Mainly Described —
Takaharu KAMEOKA†a)andAtsushi HASHIMOTO†,Nonmembers
SUMMARY This paper gives an outline of key technologies necessary for science-based agriculture. In order to design future agriculture, present agriculture should be redesigned based on the context of smart agriculture that indicates the overall form of agriculture including a social system while the present precision agriculture shows a technical form of agriculture only.
Wireless Sensor Network (WSN) and the various type of optical sensors are assumed to be a basic technology of smart agriculture which intends the harmony with the economic development and sustainable agro-ecosystem.
In this paper, the current state and development for the optical sensing for environment and plant are introduced.
key words: ICT, optical sensing, infrared spectroscopy, fluorescent X-ray spectroscopy, visible spectroscopy, agricultural products
1. Introduction
To achieve a stable supply of high quality crops, measure- ment of the nutritional state of crops during cultivation and the optimum response to that state are very important. Par- ticularly, in the case of a plant factory, which attracts at- tention from the viewpoints of food issues, safety and se- curity of food, etc., measurement and control of the nutri- tional state of crops is essential, in contrast to the case of outdoor-grown farming. Plants absorb essential elements in the form of inorganic nutrients from their roots with water, and the balance of these essential elements in them plays a large role in their nutritional state. Therefore, future Agri- cultural WSN has to equip various plant sensors to obtain the plant vigor information while the WSN in the present stage mainly covers the weather and soil conditions[1].
Understanding the change in the balance of elements at the level of field cultivation is very important in crop culti- vation, and acquiring the correct information on the balance of elements enables control of the amount of fertilizer and the plant’s environment. Focusing on the relation between recent unstable climate and crops, it is also very important at the level of field cultivation because external environmental factors such as abnormal climate and air pollution produce a large change in the balance of nutritional state in a plant, leading to a decrease in the yield of crops. We, therefore, decided to survey example applications and possibilities of optical sensing techniques, from X-ray to terahertz (THz) radiation that enable nondestructive, chemical-free, simple, and quick measurement of crops.
Manuscript received February 9, 2015.
Manuscript revised March 25, 2015.
†The authors are with Mie University, Tsu-shi, 514-8507 Japan.
a) E-mail: kameoka@mie-u.ac.jp DOI: 10.1587/transcom.E98.B.1741
2. Spectroscopic Sensing
2.1 Features of Spectroscopic Sensing[2],[3]
Spectroscopic analysis is characterized by comparison with separation analysis. In separation analysis represented by chromatography and electrophoresis, a mixture is basically fractionated to a single chemical species. Conversely, in spectroscopic analysis, the spectrum of a mixture is ac- quired, a desired chemical species is identified from the spectrum information, and its amount is determined spec- trally. Spectroscopic analysis includes absorption, emis- sion, and scattering spectroscopy. Absorption spectroscopy includes many sampling methods (transmission, reflection, diffuse reflection, photoacoustic, etc.). These analysis meth- ods in common have terms of involving the steps of sep- arating and acquiring desired information from mixed in- formation. To conduct spectroscopic analysis, it is essen- tial to understand the chemical discipline, in which multi- variate analysis is applied to chemistry, called chemomet- rics[4], to focus on particular information from mixed in- formation and to analyze its spectrum quantitatively. The strongest features of optical sensing such as spectroscopic measurements are extensive information acquired by large- scale, simultaneous technique measurement using various waveband sources, and the short time required for measure- ment.
In chromatographic measurement, the information eventually acquired is limited by column selection, whereas in spectroscopic measurement, the primary information con- tained in the original spectrum has no lack of information.
That is, “to save spectrum information” has almost the same meaning as “to store a sample.” This feature is a very large advantage in quality measurement and the understanding of the state of plants such as crops. Table 1 shows the main spectroscopic sensing techniques.
2.2 X-ray
To achieve sustainable agriculture with a stable supply of high quality crops and environmental protection in mind, establishment of quick and simple methods for measuring elements in crops is important. Therefore, use of fluorescent X-ray analysis, which enables nondestructive, simultaneous measurement of several elements, attracts attention. Since the wavelength of the fluorescent X-ray corresponds to an Copyright c2015 The Institute of Electronics, Information and Communication Engineers
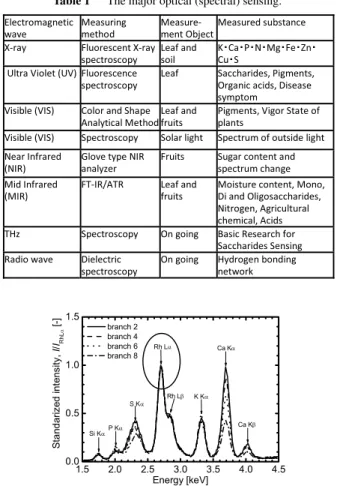
Table 1 The major optical (spectral) sensing.
Fig. 1 Normalized X-ray fluorescence spectrum.
energy difference specific to each element between its inner and outer shells, the constituent elements of a sample can be analyzed by obtaining the fluorescent X-ray energy ex- perimentally[5]. Fluorescent X-ray analysis has been used for the determination of production area and microelement analysis of aroids[6]. Application of fluorescent X-ray anal- ysis to acquire information on elements in leaves of crops are introduced here[7].
Figure 1 shows the fluorescent X-ray spectrum of a leaf of a tomato. This figure shows a spectrum for which the fluorescent X-rays were normalized using the peak inten- sity of RhLα (approximately 2.71 keV) generated by irra- diation. Figure 2 shows the result of comparing the inte- grated intensity of the Ca peak with the analytical value of content in a leaf by plasma emission spectrometry, a stan- dard method of quantitative analysis of elements[7]. The correlation coefficient of Ca between the normalized flu- orescent X-ray intensity and the content in a tomato leaf was 0.976, which showed good linearity, demonstrating that Ca was measured quantitatively. A good correlation was also found with potassium. When fluorescent X-ray spec- troscopic measurement was conducted on raw tomato plant leaves of both blossom-end rot and normal tomato plants, a difference in the balance of Ca in the plant was found be- tween both types of plants; the value for the abnormal plant was smaller than that for the normal plant[7]. In this way,
Fig. 2 Comparison between the dimensionless area intensity with the Ca component value measured by ICP.
an advantage of fluorescent X-ray spectroscopy is real time, large-scale, simultaneous measurement of elements such as K, P, and Fe, the advantage of acquiring information on nu- trient elements in plants by fluorescent X-ray spectroscopy in a farm field being demonstrated.
2.3 Ultra Violet (UV)
With a portable fluorescent measuring system that enables field observation of the plant fluorescence spectrum and a fluorescent lidar system that enables lateral observation, information on the formation and loss of chlorophyll, the main molecule of photosynthesis, can be obtained by laser- induced plant fluorescence, and the increase and decrease in the fluorescence spectra of secondary metabolic prod- ucts, the result of physiological activities, can be mea- sured [8]. To diagnose photosynthesis of tomato vegeta- tion cultivated in a plant factory, Takayama et al.[9]used a chlorophyll fluorescent image measuring system consist- ing of a chlorophyll fluorescent image measuring section containing a charge-coupled device camera with a large light-emitting diode panel light source of 60 cm ×60 cm (λ < 650 nm) for irradiation of excitation light and a long- path filter (λ >700 nm) loaded; a drive section to raise and lower the image measuring section in accord with the height of the tomato vegetation; an analysis/diagnosis section to analyze the measured fluorescent images and diagnose the plant; and a travel section to load these sections and travel on the paths in the plant factory, and measure the tomato plants in the plant factory.
With the usual fluorescence technique, measurement is generally conducted at a single excitation wavelength and fluorescent wavelength to identify the presence of spe- cific substances; several types of substances can be iden- tified with a combination of several excitation wavelengths and fluorescent wavelengths. While aforementioned fluores- cence measurements are simple, it can acquire only less in- formation on the optical properties of active molecules than spectral spectrum measurements. Measurement using an ex- citation /fluorescence matrix that is obtained by scanning continuously both the excitation wavelength and fluores-
cent wavelength and by measuring the fluorescence inten- sity has been attempted[10]. Sugiyama, who gave a name
“fluorescent fingerprint” to this excitation emission matrix, conducted determination of the production area of mango, simultaneous quantitative determination of mycotoxin, and estimation of the mixing ratio of buckwheat and flour by flu- orescent fingerprints created using excitation wavelengths of 200–340 nm and an analysis method using partial least squares regression analysis, demonstrating that fluorescent fingerprints can be applied to food/crops containing various ingredients[11].
2.4 Visible (VIS)
Light in the visible region has been used for evaluation of the state of growth of plants on a daily basis from ancient times. Since red and blue lights are mainly used in photo- synthesis by leaves of plants, leaves appear green. Diagnosis of plants using the color of the leaf has been conducted from the past; in the field of agriculture, single-photon avalanche diode (SPAD) devices[12]are generally used to measure the amount of chlorophyll contained in plant leaves as a SPAD value (a value indicating the content of chlorophyll), which is necessary to know to determine the condition of plants.
Recently, CropSpec[13], a device to measure the state of growth in a noncontact manner using a laser based on a sim- ilar principle, has become available, which is designed as a system which is loaded on a tractor to enable measurement in a large cultivation area and adjustment of the application amount of fertilizer.
With recent high image quality and price reduction in digital cameras, visible images are generally obtained using a general-purpose digital camera. Here, a simple method of acquiring color information of crops in their natural en- vironment is introduced[14],[15]. Since the color of crops originates from endogenous pigment, a secondary metabolic product resulted from metabolism; they reflect information on components such as nutrient and pigment levels and in- formation on cultivation conditions under which the color appears. Color image analysis technology is not only effec- tive for color evaluation, but also for acquisition of informa- tion on shape or size, which is difficult to understand quan- titatively. The red-green-blue (RGB) value of a color image taken with a digital camera can be expressed by means of a power function using the amount of light the elements of the camera receive (received light sensitivity Hm) as the base.
RGB=a·Hmb (1)
where the coefficient a is a parameter characterizing the color of the irradiating light, and the coefficient b is a con- stant. A relation between normalized Hm and normalized RGB value of an obtained image is expressed as a curve irrespective of color in the standard color chart image that contains red, green, and blue criteria for quantitative evalu- ation of color information.
Since coefficient a is a color parameter that can be calculated from the irradiating light information, the RGB
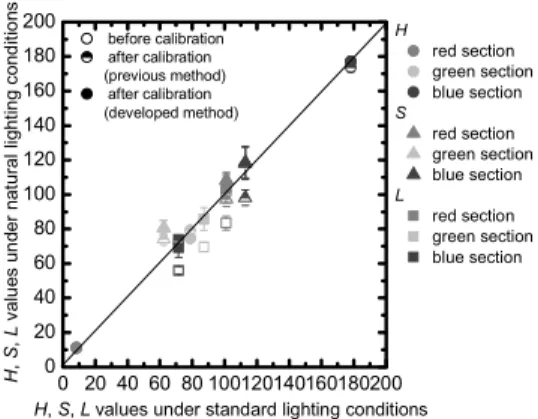
Fig. 3 Color correction result of the color chart image.
value of a color chart can be calculated from Eq. (1) by choosing three wavelengths that characterize natural light.
Therefore, an image taken under natural light can be cor- rected by comparing the RGB value of a calculated virtual color chart image with that of an actual color chart obtained in a reference light source. As shown in Fig. 3, the hue, sat- uration, and lightness values are almost the same between a corrected and reference image, showing that color correc- tion of an image taken under natural light is possible. There is a possibility that evaluation of the state of growth of plants made visually can be analyzed objectively by applying color correction to an image taken under natural light.
2.5 Infrared (IR)
Infrared radiation is used in many fields, and a combina- tion of different names is used in each field[16]. Since this article describes optical sensing of the state of growth of plants, a name in the field of spectroscopy is used. Since most molecules are in the ground state, a transition from the ground state (vibrational quantum number v=0) to the first excited vibrational state (v=1) occurs by absorption of in- frared radiation. Absorption corresponding to this transition is called a fundamental mode. Absorption corresponding to an overtone is generated by a transition to a higher vibra- tionally excited state; however, these transition probabilities are generally low. The absorption intensities of overtones observed in the near infrared region, therefore, are generally very weak.
In a farm field that requires nondestructive, on-the-spot analysis of solid and liquid samples such as soil, water, plants, and fruit, mid-infrared radiation is seldom used, and near-infrared radiation (NIR) is mostly used[17],[18]. The reasons for this are that absorption of samples is strong in the mid-infrared region, and that agricultural samples con- tain plenty of water, which significantly interferes with the measurement. Another reason is that crops are in the com- plex system consisting of many components, therefore, a great many bands are observed in the mid-infrared absorp- tion spectrum, leading to difficulty in spectrum analysis.
With the attenuated total reflection (ATR) method, which has rapidly become popular in recent years; how-
ever, the mid-infrared absorption spectra of solid and liquid substances can be measured comparatively readily. Since the spectrum in the mid-infrared region contains much more information than the spectrum in the near-infrared region, the chance of using mid-infrared spectroscopy in farm fields seems to increase with popularization of the ATR method.
Conversely, features of near-infrared spectroscopy, in which a vibrational transition corresponding to an overtone and a combination tone is observed, permit high permeability into materials and the use of fiber optics. These properties have many advantages in a farm field, such as nondestructive measurement of fruit components using transmitted light.
Since a very complex spectrum with broad band width is ob- tained in the near infrared region, it is essential for analysis of near infrared absorption spectra to extract information us- ing techniques such as chemometrics and two-dimensional correlation spectroscopy[19].
Microelectromechanical systems (MEMS) Fourier transform infrared spectroscopy (FTIR)[20]is introduced as a new device that may become essential for sensing in a farm field, though they are not yet applied technologies in the field. MEMS technology to fabricate mechanically operable structure as well as transistor circuits on a silicon chip by semiconductor microfabrication technology is also used widely for sensor development. Since FTIR can de- tect spectra specific to materials such as water, saccharides [21]and CO2, Hamamatsu Photonics K.K. uses MEMS to develop micro-FTIR having a wide band from near infrared radiation to mid-infrared radiation[22]. The band is just from 1000 to 2000 nm at present because of the constraint of a light source. Future development of a new light source is predicted, so that wide application to field measurements of plants can be expected.
2.6 THz
Terahertz waves are electromagnetic waves in the frequency range 0.3–10 THz and a wavelength region of 1000–30μm, i.e., in the frequency region between light and electric waves. The name terahertz is derived from a fact that this frequency is measured in units of THz; it is a longer wave- length than visible light, and shorter wavelength or higher frequency than electric waves. Electromagnetic waves be- tween visible light and electric waves are also called far in- frared radiation or submillimeter waves as well as terahertz waves, though there is a little difference in the range of def- inition. Development of electromagnetic wave technology in this frequency region has been delayed so far; it has been seldom used not only in basic research but also in industry;
it is why the terahertz region is called an undeveloped elec- tromagnetic territory.
Since information on the terahertz frequency region re- lates to important dynamic behaviors, such as dielectric dis- persion of materials, lattice vibrations, skeletal vibration of molecules, twisting vibrations, and rotations, there is a pos- sibility that it will become a promising technology in ap- plication to agriculture. Since terahertz waves are in the
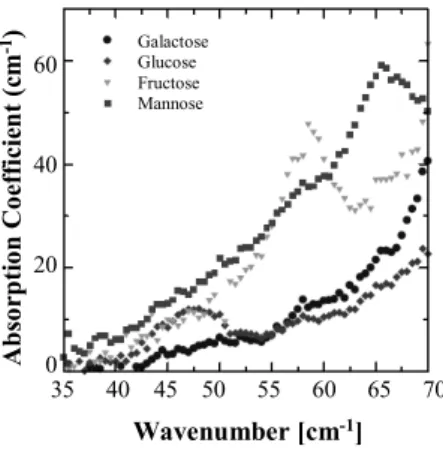
Fig. 4 THz spectra of monosaccharides.
shortest wavelength region showing permeability into ma- terials and they are the longest wavelengths having linearity of the waves, imaging using terahertz waves is one of the most important applied technologies [23]. Figure 4 shows terahertz spectral spectra of sugars that serves as base points of life activities and have functions as information transmit- ters [24]. It shows that there are “fingerprint regions” of sugars in the terahertz frequency region as well as in the mid-infrared region. Terahertz waves also showing perme- ability of the wave is expected to be used for nondestructive testing inside a container or a bag.
3. Application of IR Radiation
3.1 NIR Application
As typical popularized technology using near infrared radi- ation (NIR), there is a nondestructive method for measur- ing sugars of fruit such as orange and apple; two significant developed products using this technology are introduced here. One is a glove-type near infrared spectral sensor de- veloped by Dunamist in the Development Center of Hama- matsu Photonics K.K.; when fruit is just held, high preci- sion field measurement of the spectral spectrum is possible [25]. The other is a measuring instrument based on a new measuring principle called the three-fiber-based diffuse re- flectance spectroscopy (TFDRS) method designed by Indus- trial Technology Center of Nagasaki[26]. This method does not require a continuous spectrum of reflected light, a spec- troscope, or a halogen lamp to provide white light. Since a spectroscope is not used, component costs decrease sig- nificantly, and with no need for a halogen lamp, not only is idling time to stabilize the emission spectrum not required, but also power consumption decreases significantly. As a re- sult, small power source batteries can be used satisfactorily, and further downsizing and weight saving become possible.
3.2 Measuring Method of Nitrate-State Nitrogen
The amount of nitrate-state nitrogen in plants is one of the important nutritional state indexes, and the high promise of
Fig. 5 The spectrum of absorbance difference between the juice and wa- ter and that between the petiole cross section and water.
quantitative determination of nitrate-state nitrogen using the spectrum of leaf stem juice has been confirmed[27]. Mea- surement using juice; however, is troublesome in an actual cultivation field. A method of simply measuring the spec- trum of a cut surface of a leaf stem[28]to acquire spectrum information equivalent to that of juice in a cultivation field is described here.
Figure 5 shows the absorbance spectrum of the cut sur- face of a leaf stem, a supply route of aqueous nitric acid and nutrients. The spectrum of the cut surface of a leaf stem is quite similar to that of aqueous nitric acid at 1350–
1400 cm−1. These measurement results show experimen- tally that infrared radiation spectral measurement of a leaf stem is a simple and quick quantitative method for nitric acid. The aforementioned measuring method is considered effective for cultivation management from the viewpoint of plant physiology.
3.3 Outline of Tasting Robot
When the recent fitness boom and the problem of home care of elderly people are considered, the social needs for real- ization of a partner robot having five senses is expected to increase in future. Mie University and NEC System Tech- nologies, Ltd. developed jointly the world’s first partner robot “health/food advisor robot (tasting robot)” having a
“sense of taste” in July 2006 with support of the new energy and industrial technology development organization [29].
The tasting robot having an infrared sensor analyzes offered food for a few seconds, and gives advice on health and food.
Since there was also an idea and feasibility of letting a robot have a sense of taste, the tasting robot was designed and de- veloped for entertainment value to imitate a sommelier. The tasting robot is NEC’s partner robot PaPeRo[30]with an infrared sensor loaded; arms tailored to the size of PaPeRo were made, and an infrared sensor that plays the role of a human tongue was integrated. It analyzes the infrared ab- sorption spectrum information of food to estimate the type of food based on the presence and content of a characteris- tic component. In addition, the robot gives advice on food and health by matching with the personal body information registered beforehand. The obtained spectrum is processed
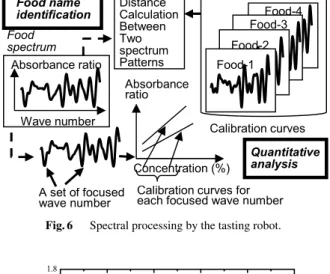
Fig. 6 Spectral processing by the tasting robot.
Fig. 7 pH-dependency of absorbance spectra of G6P.
independently by quantitative analysis based on an analyt- ical curve and by estimation of the type of food based on pattern recognition. Figure 6 shows the schematic view of the process.
Quantitative analysis is made by studying beforehand the concentration dependence of spectral characteristics of the main components of food. In estimation of the type of food, the obtained spectrum is treated as a pattern, and a pattern recognition technique is used to identify and clas- sify food. To do so, it is necessary to accumulate spectra of various foods beforehand and store them with the names of the foods in a dictionary. Then, expansion of the robot to a sommelier robot was attempted, and this new robot was reg- istered in the Guinness Book of World Records 2008[31]as a world’s first sommelier robot.
3.4 Ionic Dissociative Metabolites
The pH-dependency of the MIR spectra in aqueous solu- tion of the organic dissociative materials in metabolic path- way, such as saccharide phosphates (G6P, F6P), adenosine and its phosphates (ATP, ADP AMP), was studied[32]. The series of molar absorbance spectra for these reagents were obtained in pH range of about 2 to 11 with the FT-IR/ATR method. The ATR spectrum of the ionic dissociative ma- terial in the aqueous solutions considerably changes with pH. In Fig. 7 [32], the molar absorbance spectra of G6P aqueous solution with different pH are presented. The pH-
dependency of the ATR absorbance spectrum for an ionic dissociative material XHn in the aqueous solution could be explained by the equilibrium shift among the ionic dissoci- ation components (ionic species).
XHn ←→pK1 XH−n−1+H+←→pK2 XH2n−2− +2H+←→pK3
· · ·←→pKn Xn−+nH+ (2) Henceforth, the spectrum of each ionic species was assumed to be not affected by the hydrogen ion concentration and to satisfy the spectral additivity for the ionic species. Then, the spectrum from which the pure water spectrum was sub- tracted can be decomposed by the assumed spectra of the ionic species, as follows:
Abs(ν,pH)=
n
i=0
ci(pH)Absi(ν) (3)
Here, ν denotes the wavenumber, Abs(ν, pH) is the sub- tracted spectrum per unit molar of the reagent. c,i(pH) are the fraction of the reagent’s total concentration for thei-th ionic species with the charge−i, andAbs,i(ν) are the mo- lar absorbance spectra of thei-th components. According to the theory of dissociation equilibrium, the fraction for thei- th component c,i(pH) can be expressed as a function of pH with the parameters of the dissociation constants pKi. c0(pH)=[XHCn]=1+10pH−pK1+10pH−pK110pH−pK21 +···+10pH−pK1···10pH−pKn
c1(pH)=[XHC−n−1]=1+10pH−pK1+10pH−pK11010pH−pK2pH−pK1+···+10pH−pK1···10pH−pKn
c2(pH)=[XHC2−n−2]=1+10pH−pK1+10pH−pK110pH−pK110pH−pK210pH−pK2+···+10pH−pK1···10pH−pKn
...
(4) Here, C denotes the total concentration of the reagent in the aqueous solution. The dissociation constants pKiof the reagents were found in the literatures[33],[34]. Performing the multiple linear regression analysis by using the model formula in Eqs. (3) and (4), the molar absorbance spectra of ionic species for G6P, as well as corresponding monosac- charide; glucose, were obtained. Two ionic species for G6P were obtained in the pH range measured: G6P−and G6P2−. Using the molar absorbance spectra of the ionic species of the dissociative materials obtained in this procedure, the mo- lar absorbance spectra of the dissociative materials in aque- ous solution for any pH could be reconstructed.
In Fig. 8 [32], the synthesized spectra for G6P at pH 5.78 and pH 7.10 are compared with the observed spectra prepared in these pH values. The agreement of these spectra was fairly well. This suggests that it will be possible to con- struct a quantification system of the concentrations of the organic dissociative materials in varying pH.
3.5 New Developments on Tasting Based on IR Spectro- scopic Analysis
Examples in which wine, a typical favorite beverage, is used
Fig. 8 Comparison of the synthesized spectra for G6P at pH 5.78 and 7.10 with the observed spectra.
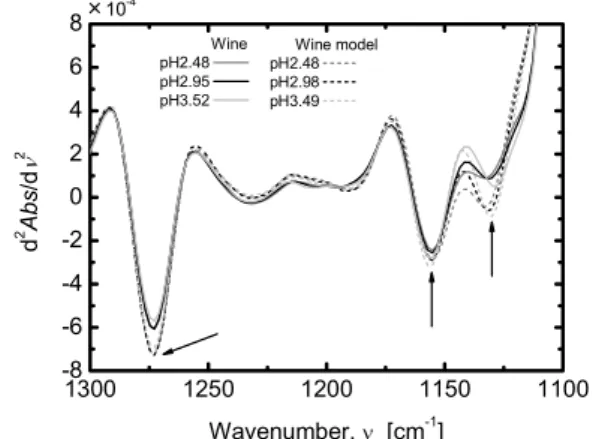
Fig. 9 Spectra of the model wine and the wine with varying pH.
to extract features of food based on infrared spectroscopy in- formation are described[35]. Ionic dissociative components such as organic acids hold the key of taste and quality of wine. A relation between ionic dissociative components and infrared spectroscopy information is described here. Fig- ure 9 shows spectra of wine with pH changed and a wine model prepared by blending the main components (ethanol, glucose, fructose, acetic acid, citric acid, lactic acid, malic acid, succinic acid, and tartaric acid). Increase and decrease of absorption and shifts of a number of peaks are observed near 1130, 1155, and 1272 cm−1in the spectrum of the wine, and their behaviors are the same as those in the spectrum of the wine model. The result of analysis of infrared absorption spectral characteristics of components in the wine model us- ing dissociation equilibrium theory shows that the change in the spectrum of the wine model originates from the organic acids in wine. Then, since the spectrum of wine is simi- lar to that of ethanol, a method of extracting information on components other than ethanol in wine is described.
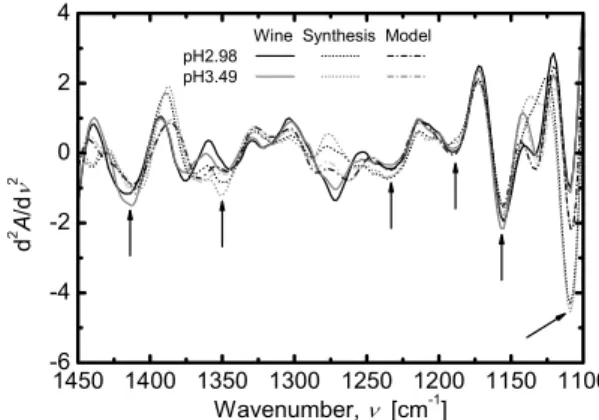
Figure 10 shows spectra of the wine and wine model with spectra of water and ethanol deducted, and the synthe- sized spectrum calculated by considering the concentration and pH of components in the wine model.
The main absorption bands almost agree, and it is seen that information on components specific to the type of wine other than ethanol in wine is extracted. Like this, analysis of the infrared absorption spectrum of wine enables extraction
Fig. 10 Wine, wine model and synthetic spectra with varying pH (the difference between water and the ethanol).
of quality information and identification of the type of wine.
4. Conclusion
These days, when genes are decoded at high speed, estab- lishment of a twinned, phenotypic, exhaustive measuring system is an urgent need[36]. Therefore, interesting re- search on the sensing of functions of plants is introduced.
The stem and trunk of plants have conduit and sieve tubes in them; conduit tubes transport water containing minerals from the roots, and sieve tubes transport starch produced by photosynthesis in the form of aqueous sucrose (aqueous sor- bitol in the case of rosaceous fruit such as apple, pear, and peach). The stem plays the role of a wave guide tube to guide far-red light (>700 nm) obtained from sunlight to the roots. Far-red light delivered to roots regulates the expres- sion of aquaporin genes in roots through a signal transduc- tion system via phytochrome A, and roots under the ground also register light as an environmental signal[37]. In rela- tion to plant phenomics, various visualization technologies for the root zone at the laboratory level have been reported;
the day when the root zone can be monitored in a farm field seems to be approaching[38]. At present, when three- dimensional modeling of structure and functions of plant is about to reach the stage of practical use and expecting that information and communication technology and sens- ing technology introduced here will be integrated together in the near future and arranged as a cultivation management system in a farm field.
Acknowledgments
This work was supported by the Project “Integration re- search for agriculture and interdisciplinary fields,” Ministry of Agriculture, Fisheries and Forests, Japan.
References
[1] T. Kameoka and A. Hashimoto, “A sensing approach to fruit-grow- ing,” Wireless Sensor Networks and Ecological Monitoring, Smart Sensors, Measurement and Instrumentation, vol.3, pp.217–246, Springer Berlin Heidelberg, Berlin, Heidelberg, 2013.
[2] T. Kameoka and A. Hashimoto, “Infrared spectroscopic analysis for agricultural materials and its application,” Agricultural Information Research, vol.12, no.3, pp.167–188, 2003.
[3] A. Hashimoto and T. Kameoka, “Applications of infrared spec- troscopy to biochemical, food, and agricultural processes,” Appl.
Spectrosc. Rev., vol.43, no.5, pp.416–451, 2008.
[4] S. Wold, “Chemometrics; what do we mean with it, and what do we want from it?,” Chemometrics and Intelligent Laboratory Systems, vol.30, pp.109–115, 1995.
[5] R. Jenkins, X-Ray Fluorescence Spectrometry, 2nd ed., Wiley- Interscience, 1999.
[6] A. Otaka, A. Hokura, and I. Nakai, “Determination of trace ele- ments in soybean by X-ray fluorescence analysis and its application to identification of their production areas,” Food Chem., vol.147, pp.318–326, March 2014.
[7] A. Hashimoto, T. Niwa, T. Yamamura, K.-I. Suehara, M. Kanou, T.
Kameoka, T. Kumon, and K. Hosoi, “X-ray fluorescent and mid-in- frared spectroscopic analysis of tomato leaves,” Proc. 2006 SICE-I- CASE International Joint Conference, pp.3559–3562, 2006.
[8] K. Kobayashi, K. Kimpara, F. Kobayashi, T. Ohtani, and Y. Saito,
“Observation of living tomato leaves using a multi-wavelength flu- orescence imaging system,” Proc. 27th Laser Sensing Symposium, pp.148–149, 2009.
[9] K. Takayama, ECPR, vol.31, Cpp.40–45, 2012.
[10] P.G. Coble, S.A. Green, N.V. Blough, and R.B. Gagosian, “Charac- terization of dissolved organic matter in the Black Sea by fluores- cence spectroscopy,” Nature., vol.348, no.6300, pp.432–435, 1990.
[11] K. Fujita, M. Tsuta, M. Kokawa, and J. Sugiyama, “Detection of de- oxynivalenol using fluorescence excitation–emission matrix,” Food and Bioprocess Technology, vol.3, no.6, pp.922–927, 2010.
[12] KONICA MINOLTA, “Chlorophyll Meter SPAD-502Plus,” http://
www.konicaminolta.eu/en/measuring-instruments/products/colour- measurement/chlorophyll-meter/spad-502plus/introduction.html, ac- cessed Jan. 5. 2015.
[13] TOPCON, “CropSpec, on-the-go crop canopy sensor,” http://ag.
topconpositioning.com/ag-products/x20-application-kits/cropspec, accessed Jan. 5. 2015.
[14] A. Hashimoto, K. Suehara, and T. Kameoka, “Quantitative evalua- tion of surface color of tomato fruits cultivated in remote farm using digital camera images,” SICE JCMSI, vol.5, no.1, pp.18–23, 2012.
[15] A. Hashimoto, Y. Toyoshi, K. Suehara, and T. Kameoka, “Quantita- tive color evaluation of digital images based on illuminating spectral Information,” Proc. AFITA 2014, pp.200–207, 2014.
[16] Infrared, “Regions within the infrared,” http://en.wikipedia.org/ wiki/Infrared, accessed Jan. 5. 2015.
[17] T. Fujiwara, “Quality evaluation of composts using near infrared spectroscopy,” Japanese Society of Soil Science and Plant Nutrition, vol.80, no.6, pp.641–646, 2009.
[18] S. Kawano, “Nondestructive quality evaluation of agricultural prod- ucts and food using near infrared (NIR) spectroscopy,” Japanese So- ciety of Agricultural Machinery, vol.75, no.2, pp.67–73, 2013.
[19] Ozaki Laboratory, School of Science and Technology, Kwansei Gakuin University, “Near InfraRed Spectroscopy (NIR),” http://
sci-tech.ksc.kwansei.ac.jp/˜ozaki/en/resproj/research-field/nirtop/, ac- cessed Jan. 5. 2015.
[20] M. Esashi, “Revolution of sensors in micro electro mechanical sys- tems (MEMS),” OYO BUTURI, vol.80, no.3, pp.181–188, 2011.
[21] M. Kanou, A. Hashimoto, and T. Kameoka, “Infrared spectroscopic analysis of food carbohydrates,” in Food Oligosaccharides, eds., J. Mureno and M.L. Sanz, pp.300–319, Wiley-Blackwell, Hoboken, 2014.
[22] Hamamatsu Photonics, “Hamamatsu develops the world’s first MEMS-based, ultra-small FTIR engine for use as embed- ded modules in infrared spectroscopic instruments,” http://www.
hamamatsu.com/jp/en/news/development/2013012916000.html, ac- cessed Jan. 5. 2015.
[23] K. Kawase and H. Ito, “Tera-photonics source:Tunable THz-wave
generation and possible applications,” OYO BUTURI, vol.71, no.2, pp.167–172, 2002.
[24] Y. Ishikawa, H. Minamide, T. Ikari, H. Ito, A. Hashimoto, T.
Kameoka, H. Chaen, and J. Nishizawa, “Observation of dynami- cal interaction modes in THz-region spectra by using terahertz-wave parametric oscillator,” Infrared and Millimeter Waves, Conference Digest of the 2004 Joint 29th International Conference on 2004 and 12th International Conference on Terahertz Electronics, 2004., pp.285–286, 2004.
[25] H. Aoki, “Realization of positive monitoring system for planta- tion management: Development of NIR measurement system for small fruits,” J. Soc. Instrument and Control Engineers, vol.52, no.8, pp.714–717, 2013.
[26] K. Tateishi, “Simple Sugar Content Meter for Measuring Non- Destructive Sugar Content of Fruits and Vegetable,” J. Soc. Instru- ment and Control Engineers, vol.52, no.8, pp.708–713, 2013.
[27] A. Hashimoto, N. Hayashi, K. Suehara, M. Kanou, T. Kameoka, T.
Kumon, and K. Hosoi, “Simple, rapid and non-destructive determi- nation of nitrate nitrogen content using mid-infrared spectroscopic method,” Agricultural Information and IT, pp.235–240, 2008.
[28] A. Hashimoto, D. Kihara, K. Suehara, T. Kameoka, and T. Kumon,
“Simple and rapid measurement of nitrate nitrogen content in plant using mid-infrared spectroscopic method,” Proc. AFITA/WCCA 2012, vol.20, no.4, 2012.
[29] A. Hashimoto, T. Kameoka, and H. Shimazu, Journal of the Virtual Reality Society of Japan, vol.18, no.2, pp.88–92, 2013.
[30] Y. Fujita, “Personal robot PaPeRo,” J. Robot. Mechatron., vol.14, pp.60–63, 2002.
[31] Guinness World Records, Guinness World Records 2008, Guinness Book, London, p.159, 2007.
[32] K. Nakanishi, A. Hashimoto, T. Pan, M. Kanou, and T. Kameoka,
“Mid-infrared spectroscopic measurement of ionic dissociative ma- terials in the metabolic pathway,” Appl. Spectrosc., vol.57, no.12, pp.1510–1516, 2003.
[33] A.E. Martell, R.M. Smith, eds., Critical Stability Constants, Plenum Press, New York, 1974–1989.
[34] Chemical Society of Japan, ed., Kagaku Binrann (Handbook of Chemistry), 4th ed., Maruzen, Tokyo, 1993.
[35] A. Hashimoto, Y. Sugimoto, M. Kanou, K. Suehara, T. Kameoka, K.
Kobayashi, and H. Shimazu, “Mid-infrared spectroscopic analysis on wine characteristics,” Abstract of 10th ICEF (Vina del Mar, April 2008), M21, 2008.
[36] V.C. Vaslis, A. Gay, A. Camargo, and J.H. Doonan, “Challenges of crop phenomics in the post-genomic era,” in Phenomics, ed.
J.M. Hancock, pp.142–171, CRC Press, 2014.
[37] Q. Sun, K. Yoda, and H. Suzuki, “Internal axial light conduction in the stems and roots of herbaceous plants,” J. Exp. Bot., vol.56, no.409, pp.191–203, Jan. 2005.
[38] K. Kobata and S. Honda, “Evaluating plant growth by electrical impedance tomography analysis,” Proc. SICE Annual Conference 2013, pp.1780–1778, 2013.
Takaharu Kameoka holds a Doctor of Agriculture (The University of Tokyo, Japan, 1984). Currently he is working as a Profes- sor of Bioresources, Mie University, Japan. His fields of interest include Agricultural Informat- ics, Bioinformation Engineering, Biochemical Engineering, Food Process Engineering, Opti- cal Spectroscopy of Agricultural Materials and Foods. He is the representative director of “Gen- eral Incorporated Association ALFAE (Area- wide e-Laboratory for Food, Agriculture and Environment)” which is composed of Agricultural ICT specialists. He is a chair of Technical Committee on Ambient Sensing, Division of Measure- ment of SICE (JAPAN).
Atsushi Hashimoto holds a Doctor of Engineering (Tokyo University of Agriculture and Technology, Japan, 1992). Currently he is working as a Professor of Bioinformation and Food Engineering, Mie University, Japan. His fields of interest include Bioinformation, Food, and Agricultural Engineering and Application of Optical Spectroscopy to Quality Sensing in their fields. He is a board member of Japanese Society for Food Engineering, a chief secretary of Division of Applied Optical Radiation, Illu- minating Engineering Institute of Japan, and a steering committee of AL- FAE.