Compilation, application and challenge of
IDE‑JETRO's International Input‑Output tables
著者 Meng Bo, Zhang Yaxiong, Inomata Satoshi
権利 Copyrights 日本貿易振興機構(ジェトロ)アジア
経済研究所 / Institute of Developing
Economies, Japan External Trade Organization (IDE‑JETRO) http://www.ide.go.jp
journal or
publication title
IDE Discussion Paper
volume 375
year 2012‑12‑01
URL http://hdl.handle.net/2344/1203
INSTITUTE OF DEVELOPING ECONOMIES
IDE Discussion Papers are preliminary materials circulated to stimulate discussions and critical comments
Keywords: international input-output, multi-regional, production networks JEL classification: C6, F4, O18, F18, Q21
1. Institute of Developing Economies - JETRO. ([email protected]) 2. China State Information Center.
3. Institute of Developing Economies - JETRO.
IDE DISCUSSION PAPER No. 375
.
Compilation, Application and Challenge of IDE-JETRO’s
International Input-Output Tables
Bo MENG1, Yaxiong ZHANG2, and Satoshi INOMATA3 Dec. 2012
Abstract
International input-output tables are among the most useful tools for economic analysis. Since these tables provide detailed information about international production networks, they have recently attracted considerable attention in research on spatial economics, global value chains, and issues relating to trade in value-added. The Institute of Developing Economies at the Japan External Trade Organization (IDE-JETRO) has more than 40 years of experience in the construction and analysis of international input-output tables. This paper explains the development of IDE-JETRO’s multi-regional input-output projects including the construction of the Asian International Input-Output table and the Transnational Interregional Input-Output table between China and Japan. To help users understand the features of the tables, this paper also gives examples of their application.
The Institute of Developing Economies (IDE) is a semigovernmental, nonpartisan, nonprofit research institute, founded in 1958. The Institute merged with the Japan External Trade Organization (JETRO) on July 1, 1998.
The Institute conducts basic and comprehensive studies on economic and related affairs in all developing countries and regions, including Asia, the Middle East, Africa, Latin America, Oceania, and Eastern Europe.
The views expressed in this publication are those of the author(s). Publication does not imply endorsement by the Institute of Developing Economies of any of the views expressed within.
INSTITUTE OF DEVELOPING ECONOMIES (IDE), JETRO 3-2-2, WAKABA,MIHAMA-KU,CHIBA-SHI
CHIBA 261-8545, JAPAN
©2012 by Institute of Developing Economies, JETRO
No part of this publication may be reproduced without the prior permission of the IDE-JETRO.
1
Compilation, Application and Challenge of IDE-JETRO’s International Input-Output Tables
Meng Bo1)
1) Institute of Developing Economies (IDE) - JETRO, Wakaba 3-2-2, Mihamaku, Chiba, 261-8545, Japan, [email protected]
Zhang Yaxiong2)
2) Department of Economic Forecasting, State Information Center, China Inomata Satoshi3)
3) Institute of Developing Economies (IDE) - JETRO
ABSTRACT
International input-output tables are among the most useful tools for economic analysis.
Since these tables provide detailed information about international production networks, they have recently attracted considerable attention in research on spatial economics, global value chains, and issues relating to trade in value-added. The Institute of Developing Economies at the Japan External Trade Organization (IDE-JETRO) has more than 40 years of experience in the construction and analysis of international input-output tables. This paper explains the development of IDE-JETRO’s multi-regional input-output projects including the construction of the Asian International Input-Output table and the Transnational Interregional Input-Output table between China and Japan. To help users understand the features of the tables, this paper also gives examples of their application.
Keywords: international input-output, multi-regional, production networks 1. Introduction
The Institute of Developing Economies at the Japan External Trade Organization (IDE-JETRO) has constructed the Asian International Input-Output (AIIO) Table for the years 1975, 1985, 1995, 2000, and 20051. These datasets are recognized as a powerful analytical tool for the study of industrial structure and production networks across countries, and are used worldwide.
1 A preliminary version of the 2005 AIIO table was completed in 2011. It will be officially released in 2012.
2
In the last few years, however, some prominent academic institutions and international organizations have launched projects aimed at constructing multiregional input-output (MRIO) tables, as shown in other papers in this volume. This reflects not only an increased demand for international input-output (IIO) data, but also implies a need for differentiation in the products in order to meet a variety of user needs.
One way for an MRIO project to differentiate itself is to broaden its coverage of countries in order to appeal to a wider range of users. However, this entails significant costs, because the more countries the table covers, the more difficult it will be to harmonize constituent national tables into a common format.
Another strategy is to focus on providing more specific regional information for a limited number of countries. IDE pursues this direction with the new Transnational Interregional Input-Output (TIIO) table. This project seeks to link the interregional IO tables of several countries into a single matrix using regional import/export data for individual countries.
This paper explains the development of IDE’s MRIO projects and their evolution along these two different yet complementary approaches. Sections 2 and 3 describe the AIIO and TIIO projects and the basic features of the tables. In section 4, we explore two applications of these datasets: using the AIIO table to measure trade in value-added (TiVA) in the Asia-Pacific region and using the TIIO table to estimate the cross-national transfer of employment opportunities. Section 5 discusses the challenges faced when seeking to upgrade and enhance the database, and section 6 closes the paper by referring to the recent directions of IDE’s MRIO projects.
2. Compilation of Asian International Input-Output Tables
2.1 History of IDE’s AIIO project
The history of IDE’s AIIO project can be divided into four phases. During the first phase (before 1973) several pioneering works explored the basic concepts of IIO tables.
In 1964, Watanabe (1966) proposed the idea of using IIO models to analyze the North-South trade problem. Building upon this idea, in 1965 IDE developed an IIO model covering six regions: North America, Europe, Oceania, Latin America, Asia, and Japan. In 1966 and 1971, IDE constructed IIO models for 10 Asian countries. These tables were subject to a number of limitations, however, such as simple estimation techniques and rough industry sector classification.
3
In the second phase (1973–1977), IDE developed a comprehensive IIO table to explore inter-industry transactions among East Asian countries. In 1973, the Republic of Korea and the five ASEAN countries plus the United States were chosen to be the endogenous member countries, because these countries have close economic relationships with Japan. Had all the countries compiled their national IO tables using a common reference year, the project would have been much easier. At the time, however, Indonesia, Thailand, and Singapore had not yet constructed official IO tables. IDE also lacked the experience necessary to compile a comprehensive IO table. Thus, two preliminary tasks were necessary before the project could begin. The first was to construct national IO tables for the three countries that lacked them, and the second was to compile bilateral IO tables with the countries for which the national tables were already available. Under this project, three national IO tables (Indonesia for 1971, Singapore for 1973, and Thailand for 1975) and three bilateral IO tables (Korea–Japan for 1970, United States–
Japan for 1970, and Philippines–Japan for 1970) were constructed in collaboration with the national statistical offices and research institutes of the countries concerned.
In 1978, IDE entered the third phase (1978–1982) of the IO project, with the aim of constructing a multilateral IO table among the ASEAN countries, Japan, Korea, and the United States for the year 1975. This project consisted of three principal steps. First, existing tables were updated to the year 1975 for Malaysia, the Philippines, Singapore, and the United States. Second, the 1975 bilateral IO tables for Indonesia–Japan, Thailand–Japan, and Korea–Japan were constructed. Finally, these national and bilateral tables were linked together into a single multilateral IO table for 1975. This table was completed in 1983. The 1975 multilateral table has been used for various analyses of East Asian and Southeast Asian industrial structure. It also became the prototype for the subsequent IIO projects.
After the completion of the 1975 IIO tables, IDE soon began the construction of the 1985 IIO table with the aim to expand coverage to more Asia-Pacific countries. China had rapidly increased its external trade with the United States, Japan, and others since the commencement of the Open Door Policy, and had come to play an important role in the Asia-Pacific region, not only as a gigantic market but also as a recipient of investments from neighboring countries. Thus, China and Taiwan were covered in the 1985 multilateral table, making it even more comprehensive than the 1975 version.
Since then, IDE has compiled multilateral tables every 5 years, providing powerful tools for analyzing dynamic structural changes in the Asia-Pacific region.
IDE’s IIO projects involve many participating organizations from different economies.
Most of these organizations are governmental or quasi-governmental statistical
4
institutes. More than 70 experts from 10 different economies have contributed to the compilation of the 2000 AIIO table.2
2.2 Compilation procedure and methodology of the AIIO table
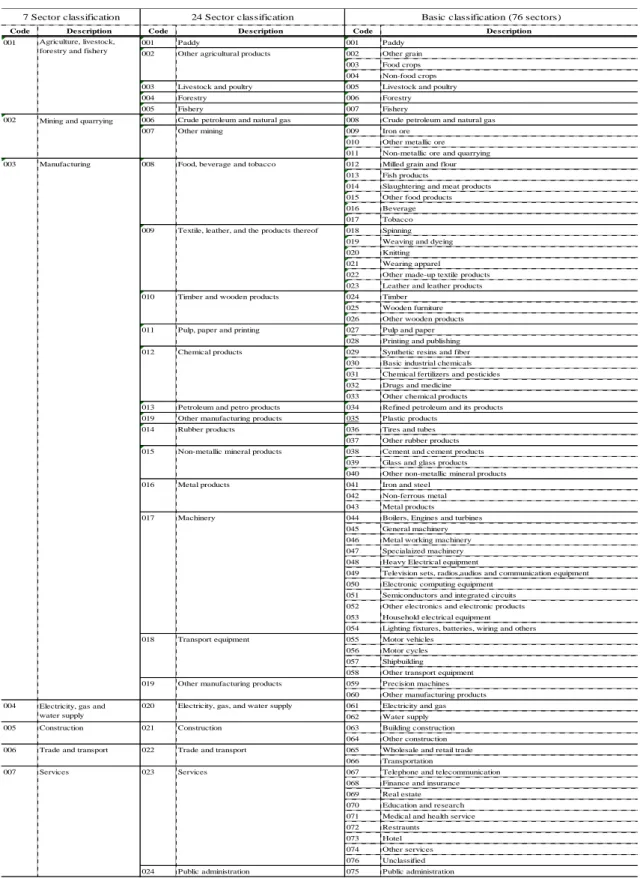
The AIIO table with 10 endogenous economies is outlined in Appendix 1. The 76 industry classification is given in Table A1 in a separate supplementary document.
Broadly speaking, the compilation process of the AIIO table goes through three distinctive phases. What follows is a step-by-step illustration of how the AIIO table is compiled.
2.2.1 Adjustment of presentation format
Despite the fact that IO tables constitute the central apparatus of the System of National Accounts (SNA), the national tables for the individual countries have different features and characteristics, reflecting each country’s economic idiosyncrasies and availability of data. This presents difficulty when compiling IIO tables from each national IO table, since the data should be mutually consistent and comparable between any parts of the whole. Accordingly, one of the most complicated tasks of compilation is the adjustment of the national tables to a common format. In general, detailed, information-rich tables must be conformed to the less-detailed ones, as the other way round would require costly efforts to obtain additional data. Trade-offs between the level of uniformity and the level of information must therefore be made, and hence careful and thorough consideration is necessary when making adjustments.
In 2003–04, a survey was conducted in order to construct a basic set of information to aid in the design of the AIIO common format and adjustment rules. This survey was designed to capture every important aspect of an IO table. The questions are grouped into seven broad categories: benchmark year and recording principles, availability of national tables and supporting tables, valuation, form and coverage, special treatment, public or semi-public sectors, and response to the 1993 SNA. Based on the survey
2 The collaborating institutions in the 2000 AIIO project are: the State Information Center in China;
Statistics Indonesia; the Bank of Korea; the Department of Statistics in Malaysia; the National Statistics Office in the Philippines; Business Research Consultants in Singapore; the Taiwan Research Institute; the National Economic and Social Development Board in Thailand; the Applied Research Institute, Inc. in Japan, and IDE-JETRO. In addition, some statistical experts from Gifu Shotoku Gakuen University (Prof. Sano Takao) and the Ministry of Economy, Trade, and Industry of Japan also provided their help in this project.
5
Table 1: Different features in national IO tables of the 2000 AIIO member economies
China Indonesia Japan Korea Malaysia Taiwan Philippines Singapore Thailand USA
1. Conversion of valuation 1.1 Basic price to producer's price
√
1.2 Private Consumption Expenditure
√ √ √
1.3 Export vectors √ √
1.4 Import matrix/vector √ √ √ √ √
2. Negative entries √
3. Dummy sectors √ √ √ √ √ √
4. Machine-repair √ √ √ √
5. Financial intermediaries √ √ √ √
6. Special treatment of import/export
6.1 Water transportation √
6.2 "Pure import" of gold √
6.3 Re-export √
6.4 Telecommunication √
7. Computer software products √
8. Producers of government services
√ √
results, the different features of national IO tables across countries can be summarized as shown in Table 1 (for detailed explanation, see Appendix 2).
2.2.2 Preparation of sector concordance and supplementary data
(1) Preparation of sector concordance
Each national table has its own industry classification system. In the case of the benchmark tables for the 2000 AIIO table, the number of industry sectors ranges from 98 for the Malaysian table to 517 for the Japanese table. The weights of the industry categories also differ. Countries with large agriculture-based economies have relatively detailed classification of agricultural sectors, whereas industrialized economies have
6
more comprehensive coverage of manufacturing sectors. As such, the sector classification reflects the characteristics of the economy concerned, and a precise conversion system that bridges national codes and AIIO codes is absolutely essential for the compilation of consistent IIO tables.
The system of sector concordance has a tree-like structure, where AIIO classification (the broadest category) is located at the top, and each AIIO code corresponds to one or several national codes. The national codes are subcategorized into the Harmonized System (HS) of Foreign Trade Statistics, which may be further converted to the Standard International Trade Classification (SITC), another classification system for trade data.
If the concordance system has such a clear tree structure, the aggregation of national tables into AIO classification poses no difficulty. The problem arises when a national code is associated with more than one AIIO codes. For example, Singapore’s national code SIO092 “Land transport equipment” corresponds to both AIO055 “Motor vehicles”
and AIO056 “Motorcycles.” We must therefore split the sector at the national IO table level before the aggregation procedure.
(2) Supplementary data
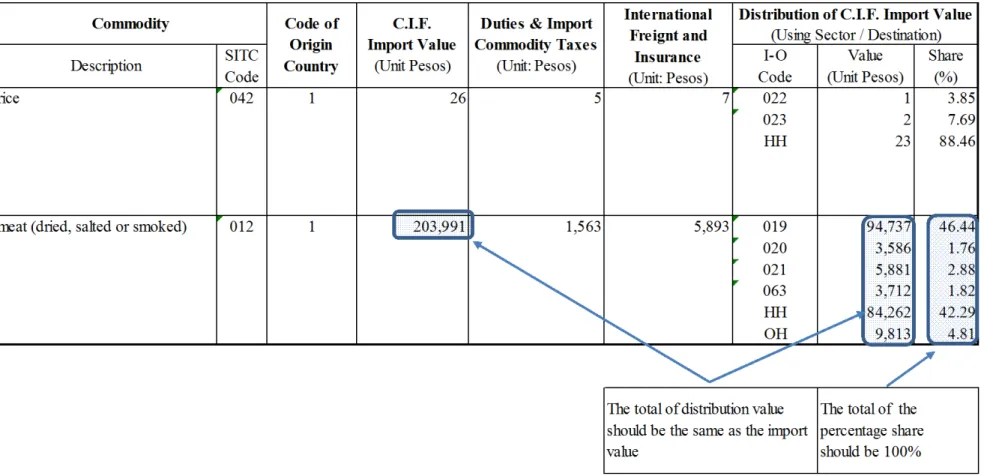
For the compilation of international tables, each country must prepare the following supplementary data according to the AIIO sector classification: a) import data by commodity and economy of origin; b) export data by commodity and economy of destination; c) import duties and commodity taxes by commodity; d) domestic trade margins and freight transport costs (TTM) on exported goods by commodity; e) international freight and insurance data by commodity and economy of origin; and f) other relevant information.
The import and export data can be directly constructed from the Foreign Trade Statistics with the help of the HS (or SITC)–national IO–AIIO sector concordance. The data for import duties and import commodity taxes, on the other hand, are independently presented in the original national IO tables in most cases, but if not (as in the case of the U.S. table), they must be collected from the Foreign Trade Statistics.
The data on TTM for exports comes from the supporting tables of the national IO tables.
Ideally, costs for exported goods (for the delivery from factories to ports) should be used, but if they are not available from the table, the average figures of the TTM matrices can be used as proxies.
7
Finally, data on international freight and insurance costs are collected from the Foreign Trade Statistics, where available. However, since this data are not available for all countries, we use a gravity model to estimate the missing information. In our model, two measures of distance are calculated: the shipping-route distance and the straight-line distance. The shipping-route distance is taken from the Distance Tables for World Shipping (JSE 1983) which reports the distances between major ports. The straight-line distance, which can be regarded as an analogue of the air-flight distance, is calculated between commercial centers of the countries concerned. Of these two measures, the one that better explains variation in international freight and insurance rates is used3.
It should be noted that the quality of the import matrices plays a critical role in determining the accuracy of the IIO table. To increase the accuracy of the import matrices, a special survey on imported commodities has been conducted in the current AIIO project.
The main goals of the survey are as follows: a) to identify which industries utilized imported commodities by origin country; b) to determine the cost of international freight and insurance on each imported commodity; and c) to determine the cost of import duties and commodity taxes levied on each import commodity.
The survey respondents are establishments that import the commodities (manufacturers, trading firms, etc.), since they are expected to possess information on amounts imported by country of origin and the amount distributed to domestic industries. The survey is carried out as an independent sample survey. It may also be conducted as a rider survey attached to other official surveys, which is more efficient and comprehensive. A sample form of the questionnaire described above is presented in Table A2 in the supplementary information.
2.2.3 Linking and balancing
An IIO table is not just a patchwork of the pieces taken from national tables, but rather a product of careful compilation of supplementary data and manual reconciliation. This section gives a brief description of the linking and balancing work of the AIIO tables.
(1) Linking of national IO tables
3 For detailed information on the estimation results of gravity models, please refer to Kuwamori (2006).
8
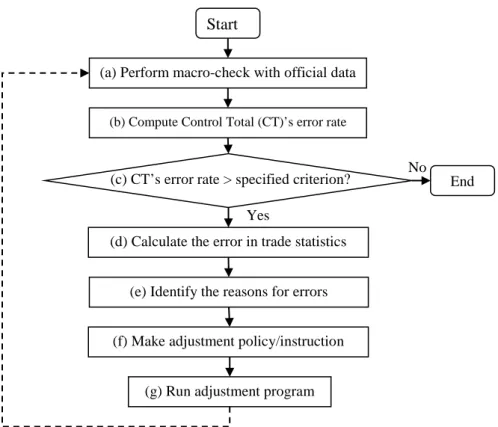
Figure 1: Balancing and reconciliation procedures
*CT: the figure of output by sector is used as the Control Total in our adjustment procedure.
All the pieces of each member country prepared in the previous steps are linked together to form the table as shown in Annex 1. The basic idea of linking is to replace the export vector with the import matrix of the trading partner. In other words, we first split the import matrix of each country’s national IO table into all its partner countries and then link these tables row-wise. At this stage, the valuation of imports in each country’s national IO table is also converted from the C.I.F. (cost, insurance, and freight) price to the producer’s price by using data on international freight and insurance and domestic transport costs and trade margins compiled in the previous steps.
(2) Balancing and reconciliation of the final table
The final step of compilation is the manual balancing and reconciliation work. The table is balanced with respect to input composition, but total demand is not necessarily consistent with total supply for each country at this stage. Such an imbalance stems from several factors. The first is the inconsistency in sector classifications between countries. Though each country is required to make its own code concordance from HS code to AIIO sector classification, the possibility of differences in statistical concept still exists. The second factor is entrepôt trade. This type of trade is often counted in
Start
(a) Perform macro-check with official data
(b) Compute Control Total (CT)’s error rate
(d) Calculate the error in trade statistics
(e) Identify the reasons for errors
(f) Make adjustment policy/instruction
(g) Run adjustment program
(c) CT’s error rate > specified criterion? No End Yes
9
different ways by trade partners. For example, exports via Hong Kong to the United States may be counted by the United States as imports from China. In the case of Singapore, where international trade is extremely large compared with the scale of the economy, and there is a large volume of entrepôt trade, there are especially large statistical discrepancies in the related international trade matrices.
The balancing procedure shown in Figure 1 is repeated until the results satisfy the specified criteria. Additional spot checks are conducted at the end of the adjustment to find any unusual entries in the table that might have been made during the adjustment process.
3. Compilation of the TIIO table between China and Japan
After the enactment of the Open Door Policy in 1978 and China’s accession to the WTO in 2001, the increasing economic presence of China has brought significant changes in the industrial network between China and Japan. With the continuous reduction of international trade costs, the degree of economic interdependence of China and Japan has grown tremendously in recent years. At the same time, the cross-border economic interaction between the two countries also affects each country’s domestic economies at the regional level. Since both China and Japan have relatively large economic scales, the economy of just one of their domestic provinces may be larger than that of a mid-size country. We should therefore consider the possibility of providing information measuring the transnational interregional economic impacts of trade between China and Japan. To explore this, IDE-JETRO launched a new international joint project in 2006 to compile the Transnational Interregional Input-Output (TIIO) table for China and Japan, linking the individual interregional IO tables of the two countries.
3.1 Overview of the TIIO table
The 2000 TIIO table for China and Japan depicts the transnational, interregional, and inter-industry networks extended over 18 regions.4 The regions covered include seven domestic regions of China, eight domestic regions of Japan, ASEAN5 (i.e. Indonesia,
4 The 2000 TIIO project is mainly an international collaboration between the State Information Center (SIC) in China and the Applied Research Institute, Inc. (ARI) and IDE-JETRO (project manager) in Japan. In addition, some experts from the National Institute for Land and Infrastructure Management (NILIM), the Ministry of Land, Infrastructure, and Transport of Japan, and Pacific Consultants Co,. Ltd., are involved in this project as consultants and advisors.
10
Malaysia, the Philippines, Singapore and Thailand aggregated into one region), East Asia (South Korea and Taiwan aggregated into one region), and the United States. The domestic regions of China and Japan are aggregations of their domestic provinces.
Appendix 3 shows the detailed information for the regions.
Due to time and budget limitations, the TIIO project was designed to be completed within one year. Limited data availability and a desire for simplicity necessitated the use of relatively rough industry classifications (10 sectors) for this project. Instead of using a traditional classification, such as light industry versus heavy industry, the following 10 sectors are employed in the TIIO table, considering recent developments in production technologies: (1) Agriculture, livestock, forestry, and fishery; (2) Mining and quarrying; (3) Household consumption products; (4) Basic industrial materials; (5) Processing and assembling; (6) Electricity, gas, and water supply; (7) Construction; (8) Trade; (9) Transportation; (10) Services.
The 2000 TIIO table is shown in Appendix 4. The layout is similar to that of the AIIO table shown in Appendix 1. This table provides detailed transnational, interregional, and inter-industry information on the input composition and output distribution of each domestic industry vis-à-vis home and foreign countries’ industries.
3.2 Compilation procedure and methodology of the TIIO table
The compilation process of the TIIO table is very similar to that of the AIIO tables. The compilation consists of three principal steps. The first step is to reconcile the differences in format between the Chinese and Japanese sides. The second step is to prepare the transnational and interregional trade data and split the import matrices of China and Japan’s domestic interregional IO tables by region of origin. The third step is to link the two tables completed in the second step and to reconcile any discrepancies.
3.2.1 Data collection and estimation
The main sources of data used in the TIIO project include 1) the 1997 interregional IO table of China; 2) the 2000 interregional IO table of Japan; 3) the 2000 AIIO table; 4) the 2000 commodity flow data by port between China and Japan; and 5) other supplementary data.
The 2000 AIIO table is used as control data for the project. The SIC and ARI are in charge of the compilation of the Chinese and Japanese components, respectively. Both parts are interregional IO tables with a separate import matrix for 18 endogenous regions. To construct these tables, both institutions use information on commodity flow
11
by port between China and Japan to split the import matrix of their interregional IO tables. The commodity flow data by port are estimated by consultants at NILIM.
3.2.2 Compilation methodology
Since there are not enough survey data for us to make detailed estimates of transnational and interregional commodity flows, some relatively strict assumptions are used. The main compilation method is based on the following principle.
Suppose an international (bilateral) IO table between country R and country S and an interregional IO table between region p and region q of country R. Country R in the IIO table is divided into two regions (p and q) by using information obtained from the interregional IO table and transnational commodity flow data by port.
To divide the row-wise transactions of country R into regions, the regional ratio of the interregional IO table is applied to the domestic transaction and the regional export ratio is used to divide the export matrix for country S. Thus, the output structure of region p in country R can be estimated as follows:
RR qq ij ij qp ij pq ij pp ij
pp
ij z
z z z z
z
)
( + + + = intermediate output of region p in country R
RR qq il il qp il pq il pp il
pp
il f
f f f f
f
)
( + + + = final demand of region p in country R
RS qS ij i pS i
pS
i z
e e
e )
( + = exports from region p in country R to intermediate sectors in country S
RS qS il i pS i
pS
i f
e e
e )
( + = exports from region p in country R to final demand in country S
RR q i i p i
p
i x
x x
x )
( + = gross output of region p in country R
Here, z, f, e and x represent intermediate, final products, exports and output respectively;
i (j) and l represent industry and final demand items. Region q in country R is also estimated in the same manner. After splitting the row vector of country R into regions, the column-wise division is done in the same way as described above. The input structure of region p in country R is estimated as follows:
12
SR Sq ij i Sp i
Sp
i z
m m
m )
( + = imports of region p in country R from country S
WR Wq ij i Wp i
Wp
i z
m m
m )
( + = imports of region p in country R from the rest of the world (W)
R q kj kj p kj
p
kj v
v v
v )
( + = value added of region p in country R
R q j j p j
p
j x
x x
x )
( + = gross input of region p in country R
Here, m represents imports; v represents value added items. Finally, import matrix for trade to region p from country S is divided by region of origin in country S. Letting the region of country S be y, we then have
SR Sq ij i Sp i
Sp i
y yR i yR
i z
m m
m e
e
)
( +
∑
= imports of region p in country R from region y in country S Imbalances can arise in both rows and columns. Adjustments are made based on the RAS method and experts’ opinions in order to eliminate the discrepancies.4. Application examples of IDE’s AIIO and TIIO tables
4.1 Trade in Value-Added in the Asia-Pacific region
The increasing significance of global value chains (GVCs) is among the most important features of rapid economic globalization. Phenomena related to GVCs include vertical specialization, fragmentation of production, outsourcing, and global supply chains.
Despite the different terms used, all of them indicate that a higher volume of intermediate goods, such as parts and components, is produced in sequential stages or processes across different countries and then exported to other countries for further production. This phenomenon is explained by the so-called second unbundling (Baldwin, 2011). Baldwin explains how lower communication costs resulting from the information and communication technology revolution have enabled the international unbundling of factories and offices, which means that tasks as well as products can be traded globally.
13
In an attempt to understand the evolution of GVCs among countries, many indicators based on trade statistics have been developed. However, most of these statistics focus on showing the direct trade-specific relationships between countries, rather than considering the roles that inter-country and inter-industry production networks play in the global economy. This section uses the concepts of Trade in Value-Added (TiVA)5 based on the AIIO tables to show an example of measuring GVCs in the Asia-Pacific regions.
The TiVA metric shows how much of a country’s (country A’s) value added is induced by another country’s (country B’s) final demand both directly and indirectly through international production networks. This can also be regarded as a country’s (country A’s) “export” of value added to the other country (country B). Figure 2 shows the TiVA of the Asia-Pacific region by country of origin and destination for 1985 and 2005. That is, each bar gives the imports of value added by one of the countries and the bar is split into the 9 origin countries from where the value added is exported. The main features of the figure are summarized below.
(1) In 1985, imports of value added by Japan and the United States dominate the Asia-Pacific region’s GVCs at the absolute level. However, in 2005, China’s imports of value added are the largest followed by those of the United States and Japan. This reflects the rapidly increasing potential of China to be a growth engine of global trade through its value added gain potential.
(2) South Korea and Taiwan’s presence in the gain of value added from regional markets also increased rapidly. A similar phenomenon can also be found for the other Asian economies, such as Thailand, Malaysia, and Singapore. This reflects the increasing participation of Asian economies in the value chains of the Asia-Pacific region between 1985 and 2005.
(3) When looking at the components of the TiVA figures by country, we can see that, in 1985, the final demands of the United States and Japan were the main sources in the value added creation processes of almost all Asian countries. In 2005, however, China exported much more value added, especially to the East Asian economies (Japan, South Korea, and Taiwan). This indicates that China is not simply a “world factory” or
“supply center,” but also a “demand center” at least for the Asian region.
5 For detailed information of the concept of TiVA, please refer to the joint report by WTO-IDE (2011) and OECD-WTO (2012).
14
Figure 2 TiVA in the Asia-Pacific region (1985, 2005)
Applying the TiVA metric to the AIIO tables makes it possible to capture the creation and distribution of value added in the Asia-Pacific region. This kind of application can avoid the double counting that occurs when trade data are used to measure GVC-related phenomena. In addition, the TiVA concept may change the traditional measure of the bilateral trade balance. This can help us understand the country-to-country trade relationship within the GVCs in detail. For a more detailed example of this application, refer to the WTO-IDE joint report (2011).
4.2 Transnational and interregional impacts of Japan’s final demand on China’s employment6
China and Japan are both important world economies and there are very strong trade linkages between them. Before 2003 Japan had long been China’s largest trade partner, and in the 1990s China was Japan's second largest trade partner, just behind the United States.
The rapid development of China’s economy and the expansion of its trade linkages with Japan can benefit employment in both countries significantly. China is a country with a
6 Thanks to Ms. An Peng, Central University of Finance and Economics, China, for her diligent assistance on this section (for details, see Zhang et al., 2012).
0 50000 100000 150000 200000 250000 300000
China Indonesia Japan Korea Malaysia Taiwan Philippines Singapore Thailand USA
China Indonesia Japan Korea Malaysia
Taiwan Philippines Singapore Thailand USA
0 50000
100000
China Indonesia Japan Korea Malaysia Taiwan Philippines Singapore Thailand USA
1985 2005 Million US$ in nominal terms
15
large employment base and great trade power, so there is important practical significance in studying the effects of foreign trade on its employment. However, most existing research treats China as a whole rather than focusing on its domestic regions.
Because of the great variation in economic size, industrial structure, production efficiency, and overseas dependency across regions within China, there is a need for more regional level perspectives to help to improve understanding of the creation and distribution of job opportunities caused by foreign trade. In addition, regional level analyses provide important information and reference points for local governments, who are the actual executors of the central government’s employment creation policies.
The TIIO model between China and Japan for the year 2000 provides tools to analyze the effects of trade between Japan and China on employment for different domestic regions and industries. Based on the model, we can see that in 2000, China’s domestic final demand contributed 646.2 million jobs, accounting for 90.8% of the total employment in China. This also means that external demand created 9.2% or 65.3 million jobs for China, and Japan’s contribution accounts for 2.25% or 16.03 million jobs in China.
Figure 3 shows, by industry and region, the employment in China induced by Japan’s final demand in 2000. The main features are summarized below.
1) The three coastal regions (East Coast, North Coast, and South Coast) are the largest beneficiaries followed by the North East and Central regions. The coastal regions are the most developed areas with large economies and strong trade linkages with Japan, so their position at the top is not surprising. The East Coast and South Coast regions are located downstream in China’s domestic supply chains (see Meng et al. 2012); therefore, a worker in the household consumption product industry may find greater job opportunities because of trade with Japan. In addition, a number of large free trade zones and export processing zones are located in these two coastal regions. We therefore see that employment in the processing and assembling sector accounts for a relatively large share of total employment compared to other regions.
2) In the North Coast, North East, and Central regions, the agriculture sector receives the largest benefit from Japanese demand. These regions not only have a relatively large agricultural industry with the ability to export directly to Japan, but also occupy upstream positions in the domestic supply chains. The coastal regions’ exports of household consumption products (especially food products) depend on the supply of agricultural products from the agriculture-oriented regions such as the North Coast, North East, and Central regions. This kind of backward linkage through both global supply chains (Japan’s demand for China’s food products produced in the coastal
16
regions) and China’s domestic supply chains (the coastal regions’ demand for agricultural products provided by other inner regions which are then used to produce food products for Japan) can be considered a primary reason that more than half of the employment creation in the North Coast, North East, and Central is from the agriculture industry.
3) When looking at the induced regional employment by education level, we note that urban low-skilled workers and rural non-agricultural workers account for large shares of the total employment created by Japan’s final demand. This indicates that China’s exports to Japan are labor intensive and require little education to produce.
The above result is a simple application of the TIIO table. For more detailed application examples at the transnational and interregional level, one can refer to Shibasaki et al.
(2008) and Inomata and Meng (2011).
Figure 3 Regional employment in China induced by Japan’s final demand
5. Future challenges in the production of IIO tables Time lag of data release
IDE compiles the AIIO tables every 5 years. However, there is always a time lag of more than 5 years between the benchmark year and the reference year. Since most countries construct their national IO table every 5 years, and the benchmark years across
0 500 1000 1500 2000 2500 3000 3500 4000 4500
5000 urban high-skilled employment
urban low-skilled employment rural non-agricultural employment Agricultural employment Services
Transportation Trade Construction
Electricity, gas and water supply Processing and assembling Basic industrial materials Household consumption products Mining and quarrying
Agriculture Thousand persons
North East North Coast East Coast South Coast Central North West South West by education level
by industry
17
countries differ, this makes it difficult to speed up the process of linking every country’s table together. If more Asian countries utilized the Supply and Use Table (SUT) and made estimation of their annual national IO tables, the compilation time of the IIO table could be greatly reduced.
Discrepancies caused by conflicting data
As mentioned in the previous sections, the main reasons for discrepancies in the data are 1) the inconsistency of export/import figures between national IO table and international trade statistics; 2) the “mirror statistics” problem in bilateral trade statistics caused by how re-export and re-import are treated; 3) differences in the valuation of export statistics (F.O.B.) and import statistics (C.I.F.). One possible solution to the above problem 1) is to carefully consider the consistency among IO based trade data, BOP statistics and custom-base trade statistics. In addition, UNSD has proposed new recommendations for the International Merchandise Trade Statistics, according to which imports will be reported on the F.O.B. basis in addition to the standard C.I.F valuation.
This should help consistency with regard to bilateral trade data. Finally, the re-export statistics by country of origin and destination should help to alleviate the “mirror statistics” problem.
Valuation system
The AIIO tables are shown with producer’s prices since most of our member countries construct their national IO tables using producer’s price. In recent years, many Asian economies have considered establishing or improving their SUT system under an international joint project supported by the Asian Development Bank. If SUT data for more Asian countries becomes available, the national IO table at basic prices can be estimated more easily.
6. Recent directions of our MRIO projects
6.1 Compilation of China’s multi-regional IO tables
SIC and IDE jointly compiled the widely used 1997 China 8-region, 30-industry multi-regional IO (CMRIO) model (see IDE (2003)). Since then, China’s interregional trade and economic linkages have strengthened, creating urgent need to update and develop the 2002 and 2007 CMRIO model for the compilation year of China’s IO table.
Drawing upon the experience of developing the 1997 CMRIO model, SIC has developed improved methods and procedures. This resulted in 2002 and 2007 MRIO
18
models that were based on more normative methods. In the construction of the 2002 and 2007 CMRIO models, SIC adopted the industry classification system used by the National Bureau of Statistics (NBS). Some of the service industries were aggregated so that the models are now classified at 29 industry-levels. This industry classification methodology is basically comparable with that used for the 1997 CMRIO model, allowing for the establishment of a series of CMRIO models. The regional divisions used for the 2002 and 2007 models are identical to the ones used for the 1997 model.
All research and development work for the 2002 and 2007 CMRIO models, however, is based on separate information on 30 province-level divisions (provinces, municipalities, and autonomous regions),7 allowing for different combinations in regional division and thus the establishment of CMRIO models for different regions.
There are several unique characteristics of the 2002 and 2007 CMRIO model development. First, since the entire development is based on 30 provinces, various regional versions of the CMRIO model can be made after aggregating different province groups according to needs of regional plan and policy design. Second, SIC proposes specific models and methods based on entropy-maximizing and gravity models for estimating the interregional trade coefficient. Third, in cooperation with NBS, SIC modifies the interregional transaction matrix by using the basic survey data on inter-province inflow and outflow as found in “National Input-Output Survey 2007”.
Fourth, when conducting balance adjustment, each province’s table is fully utilized to ensure that the sum of all provinces’ parts equals the totals found in the national table.
As the CMRIO model incorporates a huge amount of data including national IO data, provincial IO data, customs data and transportation data, errors are unavoidable. These errors are primarily from the following sources: 1) the process of converting the provincial tables to "four-column" tables and estimating the data for the import-inflow non-competitive tables; 2) the calculation of control totals of industries of provinces; 3) when using the national IO table as the control, the total inputs are calculated by adding together the intermediate inputs and the primary inputs (value added), so discrepancies between the intermediate uses and the final uses are unavoidable; and 4) original errors in provincial IO tables.
After completing all of the steps in the development of the model, all these errors are finally reflected in the error term. Therefore, it is difficult to find the appropriate method to express the balance relations in the CMRIO models, to calculate control data, and to
7 Since the IO table for the province of Tibet is not compiled, it is not included in provinces described in this paper. The economic structure of Tibet is also not considered in the development of the CMRIO model.
19
minimize error during the development of the models. SIC therefore considered and tested various methods during the development of the model and have succeeded in minimizing the number of errors. As a result, SIC has made only minor adjustments to the error term and completed development of the model.
6.2 Compilation of the 2005 Transnational Interregional IO Tables
Since the Great East Japan Earthquake of March 11, 2011, the transnational economic impact on specific domestic regions has attracted a great deal of attention from regional governments. Given the deepening economic interdependence and increasing transnational spillover impact at the domestic regional level among East-Asian economies, IDE launched in 2012 a new international project utilizing the 2005 TIIO table for three East Asian countries: China, Japan, and South Korea. We are pleased to report that the 2005 interregional IO tables for Japan and South Korea are now available and that the SIC of China is currently compiling the 2002 and 2007 interregional IO tables, which are expected to be officially published soon. We also expect to collaborate with the official institutions in charge of constructing national interregional I-O tables of these countries: SIC of China, the Bank of Korea, and METI of Japan. This collaboration scheme helps to distinguish the product among MRIO tables by granting an “official” property to the data.
Acknowledgements
The authors are very grateful to Professor, Erik Dietzenbacher, for reviewing the manuscript in spite of his very busy schedule. He made very important suggestions which enhanced this paper. We would also like to thank the other three anonymous reviewers for their valuable comments and suggestions to improve the quality of the paper.
References
Baldwin, R. (2011), “Trade and industrialisation after globalisations 2nd unbundling: How building and joining a supply chain are different and why it matters”, NBER Working Paper Series, 17716.
Inomata, S. and Kuwamori, H. (2008), Compilation and use of the 2005 Asian international Input-Output Table, Asian International Input-Output series, No. 70, IDE-JETRO.
Inomata, S. and Meng, B., (2011), Cross-regional spillover of economic growth: The territorial impact of global manufacturing in China, in WTO-IDE eds., Trade Patterns and Global Value Chains in East Asia: From Trade in Goods to Trade in Tasks, printed by the WTO Secretariat.
20
Institute of Developing Economies (IDE) (1989), Report for Special Survey on Imported Component of Input in the Philippines, Asian International Input-Output Series, No. 8, March 1989.
Institute of Developing Economies (IDE) (1989), Report for Special Survey on Imported Component of Input in Malaysia, Asian International Input-Output Series, No. 11, March 1989.
Institute of Developing Economies (IDE) (2003), JETRO, Multi-regional Input-Output Model for China 2000, IDE Statistical Data Series, No.86.
Institute of Developing Economies (IDE) (2006), JETRO, Asian International Input-Output table 2000:
Volume 1 Explanatory Notes, Statistical Data Series, No. 89.
Institute of Developing Economies (IDE) (2007), JETRO, Transnational Interregional Input-output table between China and Japan 2000, Asian International Input-Output Series, No. 68.
JSE (1983), Distance Tables for World Shipping, Eighth Edition, Japan Shipping Exchange, Inc.
Kuwamori, K. (2006), “The Role of Distance in Determining International Transport Costs: Evidence from Philippine Import Data”, IDE Discussion Paper Series, No.60.
Meng, B., Zhang, Y., Guo, J. and Fang, Y., (2012), “China’s Regional Economies and Value Chains: An Interregional Input-Output Analysis”, IDE Discussion Paper Series, No. 359.OECD-WTO (2012), Trade in Value-Added: Concepts, Methodologies and Challenges (Joint OECD-WTO Note).
Watanabe, T. (1966), “International input-output table: Structure and possibilities”, IDE Research Documents, No 92. (in Japanese)
Shibashiki, R., Yonemoto, K., and Watanabe, T. (2008), “On the Effects of Trade Liberalization Policies on Regional Economies Based on "Transnational Interregional Input-Output Table between China and Japan”, conference paper presented at the 11th Annual Conference on Global Economic Analysis, Helsinki, Finland.
State Information Center (2005), Multi-regional Input-Output Model for China, Social Sciences Academic Press. (in Chinese).
WTO-IDE (2011), Trade Patterns and Global Value Chains in East Asia: From Trade in Goods to Trade in Tasks (WTO-IDE joint report) printed by the WTO Secretariat.
Zhang, Y.X., Liu, Y. and An, P. (2012), “The Contributions of China-Japan Economic Relationship to Employment and Labor Compensation - Based on 2007 China-Japan Bilateral Input-output Table”, Paper for Workshop on China and Japan International IO Table.
Zhang, Y.X., Qi, S.C. (2012), China Multi-regional Input-Output Models for 2002 and 2007, China Statistics Press.
Zhang, Y.X. and Zhao, K. (2006), Interregional Input-output Analysis, Social Sciences Academic Press China. (in Chinese).