(顔パレイドリア現象の神経機序の解明)
January 2020
Doctor of Philosophy (Engineering)
Yuji Nihei
二瓶 裕司
Toyohashi University of Technology
Date of Submission(month day,year): January 10 th , 2020 Department of Computer
Science and Engineering Student ID Number D123359
Supervisors Shigeki Nakauchi Tetsuto Minami
Applicant’s name Yuji Nihei
Abstract (Doctor)
Title of Thesis Investigating the face pareidolia neural mechanism
(顔パレイドリア現象の神経機序の解明)
Approx. 800 words
Humans have an excellent ability to face perception. For example, even a casual pattern such as a cloud may appear like a face. The phenomenon that is seeing objects as a face is called "pareidolia." However, the details of the mechanism of this phenomenon have not been clarified. The purpose of this thesis is to clarify the representation in the brain involved in the face pareidolia phenomenon, which is an illusion of face perception, by psychological, electroencephalogram (EEG), and pupil diameter measurements. In particular, we focus on the differences in the brain and behavior before and after the face pareidolia phenomenon.
First, we investigated whether the inversion effect index of the N170 component reflected face-likeness by observing the correlation between the event-related potential (ERP) components and behavioral reports of face-likeness. Previous ERP studies showed that the P1 component (early visual processing), the N170 component (face detection), and the N250 component (personal detection) reflect the neural processing of faces. Inverted faces were reported to enhance the amplitude and delay the latency of P1 and N170. To investigate face-likeness processing in the brain, we explored the face-related components of the ERP through a face-like evaluation task using natural faces, cars, insects, and Arcimboldo paintings presented upright or inverted. We found a significant correlation between the inversion effect index and face-like scores in P1 in both hemispheres and N170 in the right hemisphere. These results suggest that the judgment of face-likeness occurs in a relatively early stage of face processing.
Next, we investigated how both aspects of bottom-up processing and top-down modulation contribute to face-likeness perception.
Humans can immediately judge what kind of object it is by looking at the object. Especially for the face, the ability is sharpened.
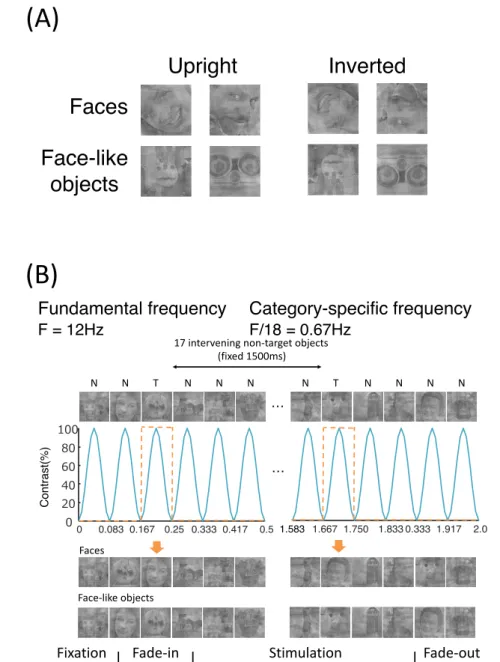
This ability to quickly group experienced stimuli into meaningful categories (perceptual categorization) is undoubtedly one of the most fundamental high-level brain functions. In the visual domain, the method of investigating the perceptual categorization process is to combine visual periodicity with a direct recording of neural activity, for instance, using EEG. We considered this category-selective response might be generated or modulated by face-likeness. We recorded EEG while presenting natural images of objects at a fast-periodic rate of 12 Hz. We compared neurophysiological responses to periodic and non-periodic face and face-like object stimuli in a fast-visual stream. Moreover, we presented an inverted face and face-like object stimuli as a control. As a result, category (face-like object)-selective EEG responses did not elicit in a fast-periodic stream. This result indicates that the face-like category does not generate a unique category-selective response unconsciously. This result suggested that the pareidolia phenomenon does not occur in the bottom-up process.
Moreover, we investigated face pareidolia using pupillary response. The pupillary response was suggested to be influenced by high-level cognition. Therefore, we predicted that the change of pupil diameter might be induced by face pareidolia. We measured that pupil diameter when stimuli were perceived as faces. The stimuli consisted of five circles, including a big circle and four small circles. The subjects performed two tasks (face-like and symmetry) to the same stimuli in the block design. As a result, pupil dilation in face-like conditions showed differences between the face-like task and symmetry task. However, pupil dilation in the symmetry condition showed no differences between tasks. These results suggest that this pupillary effect is specific for the face-like processing by the top-down process and not specific for the symmetry processing.
Lastly, we clarified preference changes with the pareidolia phenomenon. We hypothesized that a face-like object elicited an orienting response, like a face, and attracted more attention than other visual stimuli. However, it is predicted from past studies that the effect does not affect unless a face-like object is recognized as a face. We investigated whether seeing objects as a face would influence preference. In the experiment, we used a pareidolic image that could be perceived as a face or abstracts painting. These images are presented upright or inverted. The participants performed two tasks. 1) to select more preferred in the two alternatives forced-choice task. 2)face-like evaluation tasks. We divided the participants into two groups in the order in which the tasks were performed. The group that first performed "Face-likeness evaluation task," and then performed "Preference task" was defined as
"Face biased group." Another group named "No face biased group" performed the first "Preference task" and then "Face-likeness evaluation task." As a result, the Face biased group preferred the upright than the inverted images, although another group did not prefer the upright images. This result suggested that the pareidolia phenomenon affects preference.
We clarified the differences in the brain and behavior before and after the face pareidolia phenomenon. Besides, we identified
timing, area, and pupil response associated pareidolia phenomenon. In the future, the findings of the study might be of use to
person-to-machine communication or social life.
I would like to thank my supervisor, Prof. Shigeki Nakauchi, for his guidance in my studies and numerous other matters and for giving me a chance to work at the Visual Perception and Cognition Laboratory. I had an unforgettable time and experience during eight years in his great laboratory. I would also like to extend my gratitude to Assoc. Prof. Tetsuto Minami, who gave me invaluable comments and warm encouragement. I also would like to express my appreciation to other teachers, including Assist. Prof. Kyoko Hine and Assist. Prof. Hiroshi Higashi, at Kyoto University for their expertise. I am also indebted to Prof. Bruno Laeng and Dr. Liao Hsin-I, who gave me invaluable comments and suggestions.
I would like to thank our laboratory stff, Yuki Kawai, and ex-laboratory staff, Kanae Miyazawa, for their professional and scientific advice and administrative support. I also would like to express my gratitude to all our laboratory members for helping me out in my work.
Finally, I greatly appreciate the support of my family.
i
1 Introduction 1
1.1 Face perception . . . . 2
1.1.1 Face detection and its mechanism . . . . 2
1.1.2 Face perception model . . . . 3
1.2 Face pareidolia . . . . 6
1.2.1 Perception model . . . . 6
1.2.2 Relationship to other perception . . . . 7
1.3 Approaches . . . . 8
1.4 Overview . . . . 8
2 Temporal dynamics of the face pareidolia 10 2.1 Introduction . . . . 10
2.2 Materials and methods . . . . 12
2.2.1 Participants . . . . 12
2.2.2 Stimuli . . . . 13
2.2.3 Procedure . . . . 13
2.2.4 EEG-recording . . . . 15
2.2.5 Data acquisition . . . . 15
2.3 Results . . . . 16
2.3.1 Behavioral results . . . . 16
2.3.2 Event-related potential . . . . 18
2.3.3 Face inversion effect index . . . . 23
2.3.4 Correlation analysis . . . . 25
2.4 Discussion . . . . 27
2.4.1 Behavior . . . . 27
2.4.2 P1 Component . . . . 27
ii
2.4.5 Correlation . . . . 29
2.4.6 Limitation . . . . 29
2.4.7 Conclusions . . . . 30
3 Categorization process of the face pareidolia 31 3.1 Introduction . . . . 31
3.1.1 Pareidolia . . . . 31
3.1.2 Perceptual categorization . . . . 32
3.1.3 Fast periodic visual stimulation . . . . 32
3.1.4 Overview . . . . 34
3.2 Materials and methods . . . . 35
3.2.1 Participants . . . . 35
3.2.2 Stimuli . . . . 35
3.2.3 Procedure . . . . 35
3.2.4 EEG-recording . . . . 36
3.2.5 Analysis . . . . 38
3.3 Results . . . . 40
3.3.1 Behavior . . . . 40
3.3.2 Frequency-domain . . . . 42
3.4 Discussion . . . . 47
3.4.1 Frequency domain . . . . 47
3.4.2 Conclusions . . . . 49
4 Pupillary response to face pareidolia 50 4.1 Introduction . . . . 50
4.2 Materials and methods . . . . 51
4.2.1 Participants . . . . 51
4.2.2 Stimuli . . . . 51
4.2.3 Procedure . . . . 52
4.2.4 Pupillary response recording . . . . 53
4.2.5 Analysis . . . . 53
4.3 Results . . . . 54
4.3.1 Behavior . . . . 54
iii
4.4.1 Perception in behavioral indexes . . . . 59
4.4.2 Dilation peak amplitude difference between conditions . . . . 59
4.4.3 Dilation amplitude differences after stimulus onset . . . . 60
4.4.4 Pupillary response on pareidolia . . . . 61
4.4.5 Conclusions . . . . 61
5 Face-like perception effects on preference 62 5.1 Introduction . . . . 62
5.2 Materials and methods . . . . 63
5.2.1 Participants . . . . 63
5.2.2 Stimuli . . . . 63
5.2.3 Procedure . . . . 64
5.2.4 Analysis . . . . 66
5.3 Results . . . . 66
5.3.1 Face-likeness score . . . . 66
5.3.2 Preference selectivity rate . . . . 67
5.3.3 Correlation between the preference and the face-like score . . . . 68
5.4 Discussion . . . . 70
6 Conclusions 72 6.1 Face-likeness perception dynamics . . . . 72
6.2 Bottom-up and Top-down process in face pareidolia . . . . 73
6.3 Future works . . . . 74
References 75
iv
1.1 The Arcimboldo paintings . . . . 2
1.2 Functional model for face recognition proposed by Bruce & Young . . . . 3
1.3 The face perception model of Haxby(2000) . . . . 5
2.1 Example stimuli and procedure . . . . 14
2.2 Behavioral response . . . . 17
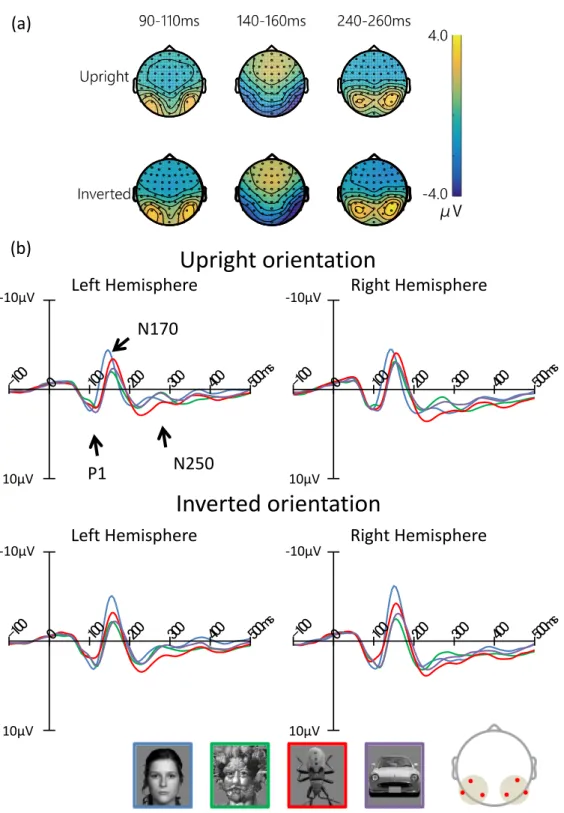
2.3 The grand average of ERP waveforms . . . . 21
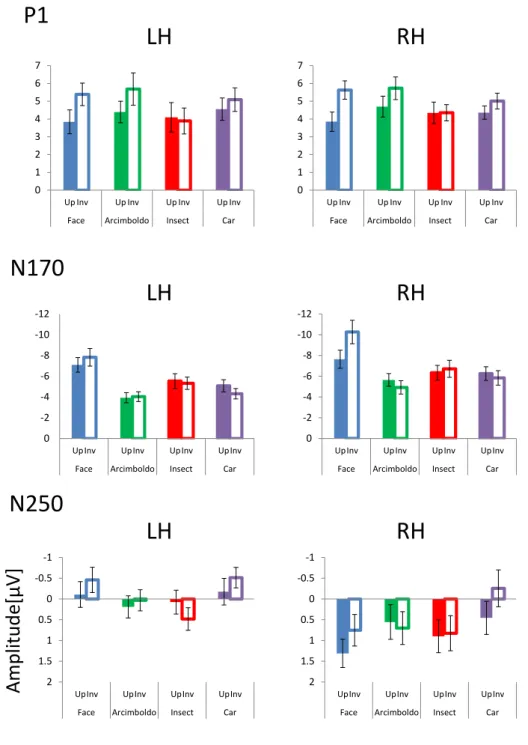
2.4 The peak amplitude of each ERP components . . . . 22
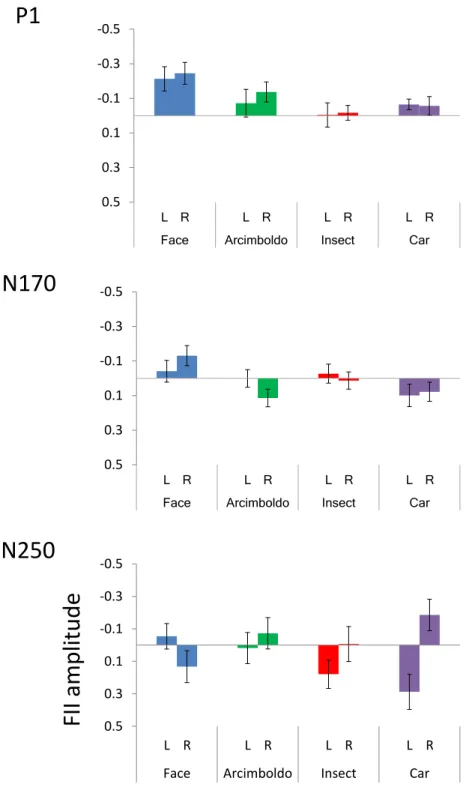
2.5 The inversion effect index for peak amplitude of each ERPs . . . . 24
2.6 Correlation map between the FII and the face-likeness score . . . . 26
3.1 The example stimuli and procedure . . . . 37
3.2 Behavioral response . . . . 41
3.3 Baseline-subtracted amplitude spectra for face-irrelevant task . . . . 43
3.4 Baseline-subtracted amplitude spectra for face-relevant task . . . . 44
3.5 Sum of baseline-corrected amplitudes representing the common response . . . . 45
3.6 Sum of baseline-corrected amplitudes representing the selective response . . . . . 46
4.1 Example of stimuli . . . . 52
4.2 The stimulus presentation procedure in the experiment . . . . 53
4.3 Results of behavioral analyses . . . . 54
4.4 The pupil response of each stimulus type at each task . . . . 55
4.5 The pupil dilation peak amplitude and the difference between its peaks of each task . . . . 57
4.6 The average pupil dilation response of each stimulus type at each task . . . . 58
5.1 Example of stimuli . . . . 64
5.2 The procedure of the preference task . . . . 65
v
5.5 Results of the preference selectivity . . . . 68 5.6 Correlation between the preference and the face-like score in the upright orientation 69 5.7 Correlation between the preference and the face-like score in the inverted orien-
tation . . . . 69
vi
Chapter 1 Introduction
The purpose of this thesis is to clarify the representation in the brain involved in the face pareidolia phenomenon, which is an illusion of face perception, by psychological assessment, electroencephalogram (EEG), and pupil diameter measurements. In particular, we focus on the difficult in the brain and behavior between before and after the face pareidolia phenomenon.
Movies and beautiful scenes made with high elaborate CG look real; however, the human face made with sophisticated CG feels unnatural. Human face perception is special, and it can process detailed information compared with other object perception. Such high face perception ability is prominent in the perceptual aspect and the cognitive/memory aspect.
Nevertheless, this high face perception ability also affects objects. For example, the Arcim-
boldo painting shown in Figure 1.1 has a face composed of objects other than the face, such as
vegetables, fruits, and chicken. It is difficult to find a face when the painting is upside down,
but it is easy to find a face when the painting is upright. The face is easily identified if the
face is found in an upright orientation, but it is difficult to be identified if it is found in an
upside-down orientation. If the face is found even once, it will stand out, and it will be difficult
to pay attention to objects other than the face. The findings show that our behavior for this
painting has changed after finding the face.
Figure 1.1: The Arcimboldo paintings.
1.1 Face perception
Faces are the most important visual stimuli for social communication. The face is in itself just one of the visual objects; however, it has a socially important meaning and coveys various information. For example, when humans see each other s faces, personal information can be read immediately, and emotions can be understood from facial expression and color. The most popular form of animal communication is the revealing of characteristic body parts and natural movements. For humans, this information is gathered in the face. Accordingly, face perception becomes a specialized ability for humans because of the existence of specialized brain areas, which are specific to the face and the innate properties of face perception. Fantz et al. identified the innate properties of face perception [1] [2] [3] [4], and thereafter, the innateness of face perception has been studied extensively. Goren et al. compared the face arrangement condition, the face shape without facial pattern condition, and the correct facial pattern condition in infants study, and they showed that infants preferred the correct facial pattern condition [5]. Simion et al. suggested that newborns preferred top-heavy stimuli, and such bias may account for neonatal face preference [6]; the findings indicate that top- heavy arrangements (which gather information at the top), rather than the specific parts such as eyes, nose, and mouth, are essential. The pattern of top-heavy, which shows preference even for newborns, is the basis of face perception.
1.1.1 Face detection and its mechanism
As described above, the face is an extraordinary visual stimulus for humans. It is just one of the
visual objects, but it has socially important meanings and conveys various information such as
personal identification, facial expressions, and age. In order to recognize a face, it is necessary to
perceive the whole face rather than identify each facial part separately. The process to perceive this whole face is classified as configural processing / holistic processing. Featural processing, a process opposite to this whole process, conducts to perceive individual parts.
Configural processing has two stages: the first-order and second-order processes. According to Maurer et al., the first-order process is to perform face detection, and the second-order process is to distinguish the small difference in face arrangement and perform face discrimination.
The first-order and second-order processes of configural processing are described in detail as follows. The first-order process is to detect the face from the correct arrangement of eyes, nose, and mouth, and this function is sensitive for newborns [5]. Most importantly, in this first-order process, the elements used for face detection are face arrangement rather than eyes, nose, and mouth features. The pareidolia phenomenon described in the following sections is considered to be caused by face detection in this first-order process. The second-order process is to distinguish individual faces based on subtle differences in the arrangement of eyes, nose, and mouth on each face. Thus, personal identification is possible even if the hairstyle changes.
1.1.2 Face perception model
Bruce & Young(1986) proposed a functional model for the processing of various information obtained from faces (Figure 1.2) [7]. This model is a relatively old functional model for face perception, and its validity has been discussed in several studies. However, it is still widely cited as a model for the basic processing of face perception.
Figure 1.2: Functional model for face recognition proposed by Bruce & Young(1986)[7](Calder
& Young(2005) [8]).
This model assumes that a continuous processing path is followed until the name is finally searched after the face is perceived, and the processing is classified into the following four steps.
1. Encoring of visual information: allowing invariant structural properties of the face to be perceived independently of variations in orientation, expression, and context.
2. Face recognition units: comparison of this perceptual information with memory represen- tations of previously seen faces.
3. Person identity nodes: associating these representations with identity specific semantic information about known individuals.
4. Name generation
First, when a face is perceived, visual processing based on image analysis is performed.
In addition to this analysis of information used for facial expression recognition and speech recognition, the expression-independent description used to identify an individual is per- formed. It is important that the face can be recognized as a person even if the expression and face orientation change with age and situation. It is considered that the expression- independent description formed through the structural encoding hypothesis supports this cognitive behavior. In the face recognition unit process, the perceived information is compared with the memory representation of the face. It is assumed that the description formed in the previous structural encoding process is stored in the face recognition unit. The judgment for known faces is conducted by determining the similarity between the stored information and the perceived information. Subsequently, the process can access the person identity node, stored information for identifying an individual. Finally, the person is identified via the name generation.
In addition, the Bruce & Young [7] model has been validated by the neuropsychological model developed by Haxby et al. [9]. They proposed a hierarchical model that is divided into a core system and an extended system. The core system is composed of occipitotemporal regions in the extrastriate visual cortex that mediates the visual analysis of faces. The extended system comprises of regions from neural systems related to other cognitive functions.
They proposed that two classes of face perception operations are kept distinct within the
core system. One is a class that captures the invariant features for identification, and the
other is a class that captures the changeable features, such as expression and eye gaze
changes. The latter processing class is activated even if the invariant information is activated
by changeable information of the face. The brain regions responsible for both systems are
described in Figure 1.3. First, the outline and the edges of the face are encoded in the inferior occipital gyri; the individual information is integrated, while the invariant information is integrated into both the lateral fusiform and superior temporal sulcal region. The changeable information is input to the superior temporal sulcus and is then processed. The functions of these regions correspond to the structural coding process in Bruce & Young s face recognition model [7]. With this function, morphological features of faces and expressions are encoded, and appropriate representations are generated so that the extended system can process them.
Moreover, DeGelder et al. proposed the subcortical system in addition to the core system and the extended system [10]. In this system, facial information from the retina is transmitted to both the superior colliculus and the amygdala via the thalamus, and this process has been termed as an automatic processing route. It is mainly considered to be a function that relies on low spatial frequency information to detect a face and direct visual attention to the face [11].
Therefore, it is called the unconscious reaction to the face and is to adjust to the subsequent cortical pathway processing. Thus, in addition to the conventional face recognition models, the mechanism of facial recognition processing is gradually being clarified by neuroscientific evidence obtained by the recently developed brain activity measurement technology.
Figure 1.3: The face perception model of Haxby(2000)[9](refer from Calder & Young(2005)[8]).
1.2 Face pareidolia
Humans have an excellent ability to face perception. For example, even a casual pattern, such as a stain on the ceiling or a cloud, may appear like a face. The phenomenon, i.e., seeing objects as a face, is called pareidolia. Notably, the phenomenon where humans tend to see faces in non-face objects is called Face Pareidolia. However, the detailed mechanisms of this phenomenon have not been clarified.
Originally, the Pareidolia phenomenon is a kind of psychological phenomenon that refers to a phenomenon that is considered meaning different from its original meaning in meaning- less patterns, landscapes, and objects. In general, even when this phenomenon occurs, the perception that the object has been misrecognized is maintained and experienced even if the consciousness is clear.
1.2.1 Perception model
The fundamental cognitive mechanism of the pareidolia phenomenon is based on the face per- ception process. When humans see an object, they unconsciously judge whether it is a human face or not. This ability to recognize a face is a high-level recognition function of humans. In face perception, our brain conducts featural processing that recognizes from facial elements such as eyes, nose, and mouth and holistic processing that recognizes from the arrangement of the facial elements. In particular, holistic processing is related to the pareidolia phenomenon [12].
This phenomenon depends on the face arrangement rather than the face element. Therefore, this phenomenon is considered a relatively low-level cognitive process. However, recently, it has been thought that this phenomenon is due to the high-level cognitive process that occurs because of the influence of the top-down process [13]. Liu et al. found that the pareidolia phenomenon occurred even when random noise images did not have facial features; the activa- tion of the occipital region was associated with face perception, and the prefrontal cortex was related to high-level cognitive functions such as executive function.
A few studies suggest the inferior occipital gyri and the right fusiform face area are associ-
ated with the face pareidolia in the neural pathway of the pareidolia mechanism [13] [14]. It
has been demonstrated that stimulating these regions (face-selective regions) in the left or right
hemisphere with TMS has made face categorization difficult [15] [16]. It is conceivable that face
categorization is performed in these areas. These studies suggest that the categorization process
of perceptual stimuli requires identification (providing different responses to stimuli belonging
to different categories) and generalization (providing similar responses to different stimuli in the
same category) [17]. Generalization processing, not identification processing of categorization processing, contributes to the pareidolia phenomenon. Because the categorization process is robust against the classification of different categories, and it is conceivable that the classifi- cation of different categories, such as face and object categories, is performed correctly. On the other hand, since the generalization process is to determine whether the perceived object belongs to the category learned so far, it is expected that the ambiguous information such as face-likeness will be classified into the face category by the generalization.
The prefrontal cortex plays an essential role in category representation and generalization.
Single-unit studies in monkeys indicate that PFC neurons encode abstract behavioral rules [18] [19] [20] and are involved in context-sensitive decision making [21], and PFC processes the abstract rules beyond specific details of sensory and motor outputs and generalizes these rules in new contexts [22]. This feature allows PFC to perform essential functions in category learning and generalization. As mentioned above, PFC has been shown to have an essential contri- bution to the pareidolia phenomenon, suggesting that generalized processing has dramatically contributed to the occurrence of the pareidolia phenomenon.
1.2.2 Relationship to other perception
This pareidolia phenomenon affects not only visual illusions but also our behavior. Takahashi et al. demonstrated that gaze cueing effect and joint attention, which are essential in com- munication, are caused by this phenomenon [23] [24], and visual detection is increased by this phenomenon [25]. This phenomenon is also known to occur in front of the car. Klatt et al.
found that the impression such as cool and cute to the design of the front of the car
affects the behavior of pedestrians [26]. Moreover, Guido et al. showed that advertisements
with pareidolic faces are preferred than those without pareidolic faces [27]. Therefore, the
pareidolia phenomenon is closely related to our social life, and it has been used in marketing
and design for improving the intimacy of objects.
1.3 Approaches
We investigated the neural mechanism of the pareidolia phenomenon using the psychophys- ical methods, EEG, and Pupillometry. First, we examined the occurrence dynamics of the pareidolia phenomenon using EEG components related to face processing (Chapter 2). We hypothesized that the EEG components could be used to clarify the pareidolia phenomenon mechanism and dynamics since the EEG component contributes to face processing such as latency, featural processing, and holistic processing. Next, because the pareidolia phenomenon might be a special categorization in the face and object categorization process, we focused on the categorization process in the pareidolia phenomenon. Since this categorization process changes not only by bottom-up processing but also by top-down modulation, we investigated the categorization processing of face-likeness from both sides. Subsequently, we clarified the effects of bottom-up processing and top-down modulation of the pareidolia phenomenon using the pupil diameter response (Chapter 4). It has been reported that the pupil diameter response is changed by the Bottom-up processing and Top-down modulation of the face processing, and both sides of the Bottom-up process and Top-down modulation in the pareidolia phenomenon are clarified by pupillometry. In addition, since human faces are known to affect our behavior, it is conceivable that they also affect our behavior when the pareidolia phenomenon occurs.
The behavior associated with the pareidolia phenomenon was investigated by psychophysical methods (Chapter 5). By combining these biosignals and behavioral data, we clarified the neu- ral mechanisms of the pareidolia phenomenon and behavioral changes caused by the pareidolia phenomenon.
1.4 Overview
This thesis comprises four studies (Chapter 2–5). First, we present what the pareidolia phe- nomenon is, how we perceive an object as a face, and the goal and approaches of this study in this chapter. Next, in Chapter 2, we present how the pareidolia phenomenon is processed in our brain using EEG. Then, in Chapters 3, 4, and 5, we present the bottom-up process and top-down modulation for the pareidolia phenomenon. Our main focus in these chapters is the differences in the brain and behavior between before and after the face pareidolia phenomenon.
As shown in Chapter 3, we investigated how both aspects of bottom-up processing and top-down modulation contribute to face-likeness perception using EEG. Moreover, as shown in Chapter 4, we investigated the top-down modulation for the pareidolia phenomenon using pupil response.
Furthermore, as shown in Chapter 5, we investigated how the pareidolia phenomenon effects
on preference. Finally, we summarize the outcomes of the four studies in the final chapter.
Chapter 2
Temporal dynamics of the face pareidolia
2.1 Introduction
Faces are the most important visual stimuli for social communication. When humans see each other’s faces, personal information can be read immediately, and emotions can be understood from facial expression and color. In this way, face perception is valuable for humans. In addition, people tend to find faces unconsciously, even in objects (e.g., ceiling stains, clouds in the sky, etc.). Even infants preferentially watch face-like objects [28]. This phenomenon is called face pareidolia, and is a kind of visual illusion, not a hallucination. How, then, do humans perceive face-likeness in non-face objects?
Brain functions related to face processing have been studied using neuroimaging, including functional magnetic resonance imaging (fMRI) and electroencephalography (EEG). Whereas fMRI has high spatial resolution and identifies the brain areas related to face processing [29] [9] [13], EEG has high temporal resolution and can be used to examine dynamic pro- cesses [30]. Some EEG-based face studies have also utilized event-related potentials (ERP);
some ERP components have been reported to be related to face processing. P1 is an early
positive component, peaking at around 100 ms, which is sometimes larger in response to faces
than objects [31] [32] [33] [34]. A more face-sensitive response was found at the level of the
N170, peaking at approximately 160 ms over the occipito-temporal sites [30] [35]. The N170
component is larger for faces than for all other objects, especially in the right hemisphere
[30] [35]. Moreover, this component is sensitive not only to human faces, but also to schematic
faces [36] [37]. It is therefore considered to be intimately involved in face processing. Fur-
thermore, the N170 differs between hemispheres [30] [38] [39]; the amplitude is larger in the left hemisphere for featural processing (eyes, nose, and mouth), and in the right hemisphere for configure/holistic processing [40] [9] [39]. In addition, the N250, peaking at 250–300 ms, subsequent to the N170 component, is sensitive to face identity [41] [42].
Conversely, face inversion effects have been well studied for specific face recognition. This phenomenon disrupts face recognition when face stimuli are inverted 180 ◦ . Moreover, the dis- ruption effect is larger for face stimuli than for other object stimuli [43]. There is evidence that configural/holistic [44] [45] processing of human faces is disrupted by inversion [44] [46] [47] [48].
Reed et al. [49] reported slower reaction times (RTs) and higher error rates for decisions about inverted faces than for those about upright faces. This effect is observed in brain activity as well as in behavior [30]. The N170 and P1 components are larger with presentation of inverted face stimuli, but not with that of inverted object stimuli [50] [32]. Some previous studies have reported that the amplitudes of the P1 and N170 components increased and the latencies were delayed with presentation of inverted face images, as compared to upright face images, which suggested that the P1 component is an early indicator of endogenous processing of visual stimuli, and that the N170 component reflects an early stage of configural/holistic encoding, and is sensitive to changes in facial structure [32]. In addition, some studies have suggested that upright faces are dominated by holistic processing, and inverted faces by featural process- ing [39]. For example, Rossion et al. [51] [52] [53] reported that N170 inversion effects disrupted processing of configural/holistic information. This effect is considered as a marker for special processing of upright face stimuli in the brain [54] [55]. Moreover, another study suggested that the inversion effect of N170 amplitude is category-sensitive [56]. These results suggest that the inversion effect is a marker for face-like processing.
Other previous studies investigating holistic and featural processing during face process- ing of inverted faces, using realistic and schematic images, reported that the N170 amplitude increased when inverted realistic face images were presented [41]. Conversely, the N170 ampli- tude decreased when inverted schematic face images were presented. This study theorized that schematic faces that did not have enough featural information were recognizable by holistic pro- cessing when presented upright. However, when the images were inverted, the N170 amplitude was reduced due to preferential featural processing instead of configural/holistic processing.
This suggested that individuals perform holistic processing in response to upright faces and featural processing in response to inverted faces.
Facial inversion effect studies have investigated face-like objects as well as faces. 1 study
investigated holistic processing using face images; Arcimboldo paintings consisting of vegetables,
fruits, and books; and object images (e.g., a car and a house) [39]. In the upright stimuli,
Arcimboldo paintings and face stimuli induced larger N170 amplitudes in the right hemisphere than did object stimuli. In contrast, in the left hemisphere, N170 amplitudes differed between processing of Arcimboldo paintings and face stimuli. This suggested that the right hemisphere is related to holistic processing, and the left hemisphere to feature processing.
Previous studies also suggested that face-like objects were processed in the N170 component in the right hemisphere, through holistic processing [39] [57]. Furthermore, Churches et al. [58]
suggested that the amplitude of the N170 component in response to objects is affected by the face-likeness of the objects. In addition, previous studies also suggested that the P1 component is associated with face-likeness processing. Dering et al. [59] reported that the amplitude of the P1 component was modulated in a face-sensitive fashion-independent cropping or morphing.
This means that P1 is sensitive to face processing. However, it is unclear whether the P1 and N170 components contribute to face-likeness judgment. Additionally, although these studies investigated how facial features and positions of facial parts are processed, how and when face-likeness perception is processed was not known. According to Sagiv and Bentin [41], Churches et al. [58] and Caharel et al. [39], the N170 component may reflect face-likeness, because the N170 component reflects an early stage of structure coding and is sensitive to face-like stimuli, such as Arcimboldo paintings.
In this study, we investigated whether the inversion effect index of the N170 component actually reflected face-likeness, by observing the correlation between the ERP components and behavioral reports of face-likeness. We expected that correlation between the inversion effect index of N170 amplitude and face-like scores would be found. Furthermore, P1 and N250 correlate with face-like scores, similar to the N170 component. Taken together, this study investigated face-likeness judgment as reflected by ERP components, as well as how and when face-like objects are processed. The purpose of this study was to reveal which ERP components contribute to face-likeness judgment based on correlation between face-likeness evaluation scores and the inversion effect of each ERP component.
2.2 Materials and methods
2.2.1 Participants
Twenty-one healthy, right-handed volunteers (age: 19–37 years, 3 female) with normal or
corrected-to-normal vision participated in the experiment. Informed written consent was ob-
tained from participants after procedural details had been explained. The Committee for
Human Research of Toyohashi University of Technology approved experimental procedures.
2.2.2 Stimuli
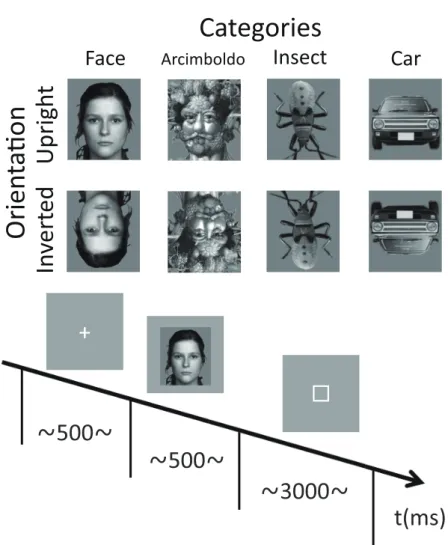
The stimuli in each category are shown in Figure 2.1. There were 4 categories of stimuli, including natural human faces (without glasses or make-up, and with a neutral expression), Arcimboldo paintings, insects (animate category), and cars (inanimate category). The face category was selected from the FACES database (Max Planck Institute for Human Develop- ment, Berlin; [60]). Each category consisted of 6 kinds of stimuli. In the face category, we presented equal numbers of male and female faces. Only faces with neutral expression were chosen (interrater agreement N 0.90, as published for the reference sample). The upright ori- entation of the insect category was defined as erecting a higher face-likeness evaluation score in the image evaluation experiment. All photographs were converted to gray scale, and mean luminance and size were equalized with Adobe Photoshop ® CS2 software. All stimuli were 220
× 247 pixels (visual angle 9.7 to 11.6 ◦ ). Each stimulus was presented in 2 different orientations, either upright or inverted 180 ◦ .
2.2.3 Procedure
After electrode-cap placement, participants were seated in a light- and sound-attenuated room, at a viewing distance of 60 cm from a computer monitor. Stimulus presentation was controlled by a ViSaGe system (Cambridge Research System, Rochester, UK) and presented on a CRT monitor (EIZO, Flexscan-T761, graphics resolution 800 × 600 pixels, frame rate: 100 Hz).
Stimuli were displayed at the center of the screen on a light gray background. At the start of each trial, a fixation point appeared in the center of the screen for 500 ms, followed by the presentation of the test stimulus for 500 ms. The inter-trial interval was randomized between 1,000 and 1,500 ms. Participants performed face-like evaluation tasks and provided their responses by pressing 1 of 7 keys on a numeric keyboard with their right or left index finger; right or left was counterbalanced across blocks (right to left or left to right). They rated face-likeness on a 7-point scale from 1 (non-face-like) to 7 (most face-like) and were requested to respond within 3,000 ms. Participants were instructed to maintain eye gaze fixation on the center of the screen throughout the trial and respond as accurately and as quickly as possible.
Participants performed 96 trials per condition (6 stimuli in each category repeated 16 times
in each orientation). Four blocks of 192 trials (4 categories × 6 stimuli × 2 orientations × 4
times) were presented in a pseudo-random order. Thus, participants performed a total of 768
trials.
O ri e n ta o n U p ri g h t In v e rt e d
Face Arcimboldo Insect Car
Categories
+
+
t(ms) f 3000 f
f 500 f f 500 f
䕕


[8]).](https://thumb-ap.123doks.com/thumbv2/123deta/10127008.1960940/16.892.244.644.681.987/figure-face-perception-model-haxby-refer-calder-young.webp)