zombie firm hypothesis
*GOTO Yasuo**, Scott WILBUR***
Abstract
In Japan, the “soft budget problem,” by which banks loosen their lending stances toward long-term client firms despite worsening business conditions, has attracted attention particularly in connection to so-called “zombie firms,” financially weakfirms sustained by discounted interest rates and evergreen lending which have become a major research and political interest in recent years. In this paper, we focus on zombie firms among small and medium-sized enterprises(SMEs), a corporate category that has hitherto received less consideration in the discussion about Japan's zombie firms. We find that: (1) many zombie firms exist among SMEs; (2) some zombie firms eventually emerge from zombie status; (3) once a firm becomes a zombie, its probability of exit increases especially among SMEs; and (4) the economic performance of exiting zombie firms is worse than those of exiting non-zombie firms.
Keywords:Zombie firm, Soft-budget problem, Evergreening, Small and medium-sized enterprises(SMEs), Firm size, Financial constraint
JEL classification:P43, L25, M13, G32
* This workwas supported by JSPS KAKENHI Grant Number JP26285068, a 2018 Murata Science Foundation research grant, and the Banque de France fellowship program at the EHESS-Fondation France-Japon, and conducted as a part of 2018 fiscal year project research with the Kyoto Institute of Economic Research, Kyoto University (KIER) Joint Usage and Research Center. It utilizes micro data in the form of questionnaire information from the Ministry of Economy, Trade and Industry (METI) Basic Survey of Japanese Business Structure and Activities. The authors are grateful for helpful comments and suggestions by Yoshiaki Shikano (Doshisha Univ.), Nobuyoshi Yamori (Kobe Univ.), Kentaro Imai (Osaka Univ.), discussion paper seminar participants at RIETI, President Makoto Yano, Vice President Masayuki Morikawa, Senior Fellows Yoko Konishi and Yoichi Sekizawa, and comparative politics seminar participants at the University of Southern California.
** Seijo University and Research Institute of Economy, Trade and Industry.
*** Yele University, USA.
I. Introduction
So-called “zombie firms” have been widely discussed as a key factor in Japan’s sluggish economic growth in the past two decades, a period commonly known as the
“lost decades.” Zombie firms are generally defined as insolvent businesses that remain in the marketplace instead of pursuing restructuring or bankruptcy. First reported by journalists in the late 1990s and early 2000s(Henry 1997; Chandler 1999; Landers 1999;
Fackler 2003), zombie firms were subsequently criticized by economists, who argued that they distorted market competition and hurt healthy firms by depressing profits and discouraging investment, and thereby hindered Japan’s macroeconomic revitalization (Hoshi 2006; Caballero, Hoshi, and Kashyap 2008; Hoshi and Kashyap 2011). Since the global financial crisis, Japan’s encounter with zombie firms has become a cautionary lesson for other recessed economies seeking to avoid long-term stagnation, and policymakers in places as varied as the United States, the United Kingdom, the European Commission and China have expressed a strong desire to stop the spread of zombie firms(Summers 2012; Bankof England 2012; Stothard 2013; Zhongguo xinwen wang 2015).
While the notion of zombie firms has gained international prominence because of Japan’s experience, recent questions about conceptualization have reopened the debate about these firms’ precise role in Japan’s post-bubble economy. Most notably, challengers of the dominant zombie firm argument have asserted that these firms should conceptually include the criteria of profitability and evergreen lending (Fukuda and Nakamura 2011; Nakamura and Fukuda 2013), in addition to the criterion of discounted interest payments used in earlier studies (Caballero, Hoshi, and Kashyap 2008). Measurement with this revised definition suggests that the ratio of zombie firms in fact declined from the early 2000s, meaning that zombie firms did not persist in significant numbers throughout the 2000s, and thus do not explain Japan’s low growth in the latter part of the lost decades.
We are interested in this ongoing debate surrounding zombie firms, not just for its significance to understanding Japan’s lost decades, but also for its relevance to other economies concerned about zombie firms’ allegedly malefic effects and keen to learn
from Japan’s experience. However, we believe that the current scholarship on zombie firms in Japan suffers from a key deficiency. Namely, it primarily focuses on stock exchange-listed firms that tend to be large-sized enterprises, and overlooks the presence of zombie firms among small and medium-sized enterprises (SME), the corporate category that actually represents the majority of Japanese businesses.
In this paper, we examine the presence of zombie firms among small firms in Japan during the lost decades. Our contribution is twofold. First, we employ firm-level data from the Ministry of Economy, Trade and Industry’s Basic Survey of Japanese Business Structure and Activities (BSJBSA) to assess the existence of zombie firms among Japanese SME. Our use of this database allows us to make a relatively broad inference about the zombie ratio among small firms, which is an improvement over earlier studies that examined the ratio with a limited sample size(Imai 2016). Second, we explore corporate characteristics of these firms, including duration of zombie status, market exit, and employment and sales activity at the time of exit. Our findings about these characteristics add refinement to the debate about zombie firms, since there has hitherto been little attention to important zombie attributes like survival time, with the recent exception of Nakamura (2017). Consequently, they suggest issues for consideration in future research on this topic.
We find that: (1) many zombie firms exist among SME; (2) some zombie SME eventually emerge from zombie status; (3) once a firm becomes a zombie, its probability of exit increases especially among SME; and (4) the economic performance of exiting zombie firms is worse than that of exiting non-zombies. These results carry considerable generalizability for the broader population of Japanese SME, given their origin in BSJBSA micro-data covering a wide range of firm sizes and behaviors.
The paper is structured in the following way. In the “Literature Review” section, we revisit the debate on zombie firms in Japan and elsewhere, to show why SME should be investigated for zombie firms. In the “Theory” section, we offer a hypothesis for why the SME category may exhibit a high ratio of zombie firms, focusing on the role of Japan’s credit guarantee system in supporting weakfirms’ access to financing. In the
“Data and Method” section, we describe the merits of the quantitative database from which we draw our sample of SME for analysis, and outline our paper’s empirical
strategy. In the “Results” section, we quantitatively assess the level of zombies and their corporate characteristics. In the “Conclusion” section, we summarize our findings and discuss their implications for understanding Japan’s lost decades and the wider study of zombie firms.
II. Survey
Zombie firms have long been associated with Japan’s lost decades. Initially identified in the late 1990s and early 2000s by journalists who labeled prominent overleveraged firms like Yamaichi Securities and Daiei as “zombies” (Henry 1997; Wehrfritz and Takayama 2002), zombie firms became a distinct topic of academic study in the 2000s, when economists noted a wider trend of insolvent businesses that were kept alive by various forms of financial support, instead of being forced to undergo corporate restructuring or liquidation(Katz 2003). Early studies of Japan’s post-bubble economy showed that increased lending to highly indebted firms lowered their profitability (Sekine, Kobayashi, and Saita 2003), and that industries with high concentrations of zombie firms had weakproductivity performance(Ahearne and Shinada 2005), suggesting that zombie firms negatively affected Japan’s economic recovery. Studies also demonstrated that Japanese banks’ nonperforming loan problems made it more likely for them to give credit to financially-troubled firms, implying that zombie firms received life support in a perverse process of “unnatural selection” that simultaneously reduced the credit available to normal borrowers(Peekand Rosengren 2005).
Zombie firms’ malefic role in Japan’s stagnation was most explicitly and influentially asserted by Caballero, Hoshi, and Kashyap(2008) (henceforth “CHK”), who measured the prevalence of zombie firms on the Tokyo Stock Exchange between 1981 and 2002 using a clear conceptual criterion of firms that paid discounted interest rates below the hypothetical prime rate. CHK found that nearly one-third of the firms in their sample received this form of financial assistance in late 1990s and early 2000s, which signified strong evidence for their contention that zombie firms caused “congestion” in Japan’s marketplace by failing to exit, and thereby hurt healthy firms and overall economic vitality. CHK tested this hypothesis and discovered that firms identified as
zombies both reduced productivity in sectors where their presence was higher, and lowered their more profitable competitors’ investment and employment growth by impeding the reallocation of capital and human resources. These results led CHK to argue that zombie firms created deflationary pressures in the wider economy, and possibly caused some healthy firms to become zombies as well.
The magnitude of CHK’s findings gave the notion of zombie firms much greater weight, and shaped the ensuing scholarly and policy debates about Japan’s lost decades.
Many economists cited CHK’s zombie firm argument as a persuasive and at least partial explanation for Japan’s long-term stagnation (Griffin and Odaki 2009; Kobayashi 2009, 339; Garside 2012, 90‒94), while international organizations like the International Monetary Fund and OECD referenced CHK in calling on Japan to make far-reaching economic policy reforms(Lam and Shin 2012, 3; Arbatli et al. 2016, 8; OECD 2015, 23). Moreover, in the aftermath of the global financial crisis, central banks like the Bank of England mentioned CHK in noting that lessons should be drawn from Japan’s extension of credit support to weakfirms during the lost decades(Bankof England 2012, 29‒31), and leading economic policy voices like former US Treasury Secretary Larry Summers and Liu He, the top economic advisor to Chinese President Xi Jinping, expressed concern about the need to remove zombie firms from their respective economies (Summers 2012, 72; Zhongguo xinwen wang 2015). Increased attention by economic policymakers outside Japan suggests that it has become conventional wisdom that zombie firms were a prime reason for Japan’s economic malaise after the banking crisis in the 1990s, and a potential threat to other economies trying to recover after the 2008 crisis.
Notwithstanding the widespread influence of CHK’s study on the idea of zombie firms, some scholars have questioned the correctness of conceptualizing these troubled firms on the sole basis of discounted interest rates. Most notably, Fukuda and Nakamura (2011; 2013) (henceforth “FN”) contended that below-prime rate interest rates are insufficient to indicate zombie firms, because Japan adopted a quantitative easing monetary policy in the 2000s that enabled many firms, including healthy ones, to borrow at very low interest rates, particularly since the policy accelerated competition between banks and put downward pressure on lending rates. To more accurately gauge
the presence of zombie firms, FN proposed the addition of two conceptual criteria, profitability and evergreen lending, to CHK’s interest rate criterion. Based on this revised definition, FN estimated that the ratio of zombie firms in their sample from the Tokyo Stock Exchange peaked in 2001 at less than 15 percent of firms─a level that was roughly half of CHK’s estimate─and that the ratio subsequently declined and remained below 5 percent of firms throughout the 2000s until the global financial crisis.
Since FN offered their revised conceptualization, it has quickly gained traction among economists investigating zombie firms in Japan and elsewhere(Kwon, Narita, and Narita 2015; Imai 2016; Nie et al. 2016; Tan, Huang, and Woo 2016). This trend suggests that a consensus may be emerging around the relative merits of FN’s more strenuous definition, possibly because its additional conceptual criteria help it avoid the Type 1 and Type 2 errors inherent in CHK’s definition, and because its estimate of the zombie firm ratio more closely tracks the actual amount of nonperforming loans at major Japanese banks.
FN’s enhancement to CHK’s original conceptualization has reopened the debate about zombie firms’ role in Japan’s lost decades, and proposes that scholars view the effects of zombies on Japan’s low growth much more conservatively, especially in the period after 2001. Nonetheless, while we appreciate the creative significance of CHK’s landmarkargument as well as the enhanced conceptual validity and empirical findings of FN’s counterargument, we agree with the observation by Imai(2016)that both these arguments place exclusive emphasis the existence of zombie firms among stock exchange-listed firms which are typically large enterprises, whereas most businesses in Japan(and virtually all other economies)are small and medium-sized enterprises (SME) which do not publicly trade their stock. In Japan’s case, SME have traditionally constituted more than 99 percent of the total number of firms in the economy, provide roughly 70 percent of total employment (Economist Intelligence Unit 2010, 6), and contribute 50 percent of national GDP (Yoshino and Wignaraja 2015). Therefore, the current debate’s inattention to this important corporate category is a significant omission, and should be amended to provide fuller understanding of zombies’ place in Japan’s recent economic history.
In this paper, we aim to contribute to the debate about zombie firms in Japan by
examining the presence of zombies among SME. We have two goals. First, we seekto identify the ratio of zombie firms among SME in the economy over time using a large database, the BSJBSA. In attempting this first goal, we estimate the ratio of zombie firms in basically the same way as CHK and FN, but with this database that gives us insight into a significant firm category that these previous studies overlook. We are not the first to examine the zombie ratio among SME, but our use of this database managed by the Japanese government affords us a much larger sample size for estimating the ratio compared with earlier research(Imai 2016).
Second, we seekto uncover properties of zombie SME such as survival time in zombie status. While prior scholarship on zombie firms has addressed the overall zombie ratio in listed firms and specific sectors, there has been little workto date on the length of time that zombie firms remain as zombies. One exception is Nakamura(2017, 15), who finds that large zombie enterprises between 1995 to 2008 stayed as zombies for an average of slightly over two years, a much shorter period than commonly assumed. We are interested in performing a similar analysis on small firms, and more generally illuminating the corporate characteristics of zombie SME.
Our pursuit of these goals is especially motivated by our interest in potential disparities for the SME category that may correlate with small firms’ utilization of Japan’s credit guarantee system. This system, which was originally established in 1937, was expanded in 1998 to enhance small businesses’ access to financing from private banks in the wake of a domestic “credit crunch” and the Asian financial crisis. It grew to become the largest credit guarantee system in the world during the 2000s in terms of outstanding obligations(Small and Medium Enterprise Agency 2016a, 3), and was notable in providing high levels of coverage─credit guarantees of 80 and 100 percent─to nearly 4 million SME users.
Given that the system’s substantial guarantees significantly reduced banks’
potential default risk, the system stimulated private lending to firms whose creditworthiness might otherwise have prevented them from access to finance. It also possibly generated an arrangement conducive to zombie firms, since banks were encouraged to lend to borrowers with greater likelihood of repayment problems. Thus, we are interested to know about the zombie firm situation among SME, which could
indirectly implicate the support function of the credit guarantee system.
III. Data and Method
In our empirical analysis we use the METI Basic Survey of Japanese Business Structure and Activities(BSJBSA). This survey contains data on the conditions of diversification, globalization, and soft economy of Japanese firms, and is generally used by METI to inform and learn from its own economic policymaking. It covers firms with 50 or more employees and whose paid-up capital or investment are higher than \30 million in industries including mining, manufacturing, wholesale and retail trade, food services, and other service industries. Though the BSJBSA does not include data from microenterprises, the SME category which contains the most credit guarantee system users, because the survey encompasses all firms that meet these other size criteria, it addresses a large range of firms and provides a strong advantage in the context of our research.
Our basic empirical strategy consists of (i) identifying zombie firms using BSJBSA micro-data, (ii) investigating the characteristics of these zombie firms, and (iii) conducting regression analysis on the relationship among the zombie identifier and other covariates. In step (i), the fundamental taskis how to identify zombies. Three measures have been proposed in the literature. First, CHK parsimoniously define zombie firms as companies whose interest payments are lower than the hypothetical risk-free interest payments(Caballero, Hoshi, and Kashyap 2008, 1948). Second, FN add the criteria of profitability and evergreen lending to CHK’s definition. Profitability is important, FN argue, because firms with earnings before interest and taxes(EBIT)that exceed the firms’ hypothetical risk-free interest payments are generally healthy, and such firms’ good financial standing may in fact explain why their interest payments are lower than what the prime rate would stipulate. Evergreening lending is also relevant, since financially troubled businesses may have their loans rolled-over by their banks when they face difficulties with repayment(Fukuda and Nakamura 2011, 1126‒27). Third, Imai agrees with the FN definition in principle, but uses a longer period to evaluate firm profitability. This modification helps Imai’s definition avoid the problems of
Table 1. Summary Statistics
30049 180294
1882.79 147.00
470.03 persons
workers
sample period annual average
of firm numbers total numbers
of obs.
s.d.
median mean
(unit)
30049 180294
152341.40 4354.50
22392.76 million yen
sales
2009FY 30049
180294 14492.73
90.00 1510.92 million yen
capital
30031 180183
0.1287 0.0326
0.0404 (yen/yen)
ROA
-2014FY
misidentifying healthy firms as zombie firms if the healthy firms experience temporary profit declines, and misidentifying zombie firms as healthy firms if the zombie firms have temporary profit increases(Imai 2016, 94). The definitions are expressed as follows:
I=r*B+
15 r
*B+min(r, ⋯.,r)*Bondswhere I: minimum required interest,r
: interest rate, B : borrowings from banks,
Bonds: issued amount of corporate bonds
If I<I, the firm is regarded as zombie (CHK criterion) whereI: actual interest paid
If I>PROF and B >B, the firm is regarded as zombie
(FN criterion) where PROF: profit before interest and taxes
If (PROF)<0, andB >B the firm is regarded as zombie (Imai criterion)
Our analysis compares the zombie characteristics reported by each of these measures. Table 1 provides descriptive summary statistics for our data.
IV. Results
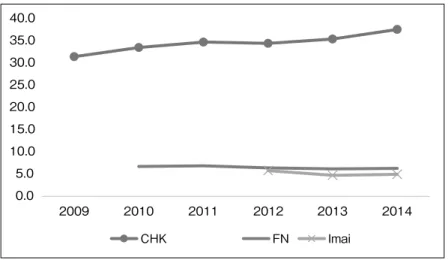
Identification and Comparison of Zombie Firm Ratios by Different Definitions Figure 1 shows the zombie firm ratios according to the respective definitions of CHK, FN and Imai, which are calculated as a percentage of all firms in our sample. The
0.0 5.0 10.0 15.0 20.0 25.0 30.0 35.0 40.0
2009 2010 2011 2012 2013 2014
CHK FN Imai
Figure 1. Zombie Ratios by Definition
Note: Unit is percentage Source: Authors
end year of the sample period is fiscal year 2014, but the start year for each definition’s estimate is different: 2009 for CHK, 2010 for FN, and 2012 for Imai. Short-term and long-term bankborrowing and corporate bond issuance amounts are used to identify zombie firms, but the BSJBSA only begins covering this data from 2009. In addition, the start year is delayed for the FN calculation because it considers differences with the borrowing amount in the previous year, and for the Imai calculation which uses multiple year earnings(three years in this paper)to identify zombie firms.
Four points can be observed in Figure 1. First, the CHK definition classifies many more firms as zombies than do the other two definitions. Second, the FN and Imai definitions elicit a comparable zombie ratio, though the Imai definition’s ratio is slightly lower. These two points are similar to the findings of Imai(2016). Third, while the zombie ratio continues to decrease in both the FN and Imai definitions, the ratio in the CHK definition continues to rise, suggesting that the respective estimates of the CHK definition and the FN and Imai definitions not only have a level gap, but also move in different directions.
The biggest reason for this divergence is that the CHK definition uses the real payment rate, whereas the FN and Imai definitions use revenue. Since both CHK and FN/Imai compare these different indicators with an “ideal payment rate” based on the prime rate, their definitions elicit starkly dissimilar zombie ratios. On the one hand, real
payment rates and revenues may be linked. In particular, from the viewpoint of the business cycle, corporate earnings typically worsen during economic recessions, and real payment rates also decrease in response to reductions in policy interest rates. Yet what is decisively different is that in normal bankbehavior related to credit risk, firms with low profits should have high interest rates. With the CHK definition, however, zombie firms may not only be weakfirms that receive preferential interest rate treatment, but also sound businesses with favorable interest rates based on normal examination criteria. By contrast, the FN and Imai definitions use fundamental corporate earnings, so they more accurately capture underlying corporate strength.
Because the Imai definition also takes into account temporal fluctuations caused by special factors, we prefer to use it in this paper.
Our study is limited in that it examines data on short-term and long-term bank borrowing which the BSJBSA only started to collect from 2009. However, the BSJBSA also contains earlier data on current and fixed liabilities which are closely related to bankborrowing. Current liabilities consist of short-term bankloans, borrowings from other financial institutions, and inter-company liabilities (accounts payable). Fixed liabilities include long-term bankloans, borrowings from other financial institutions, corporate bonds, and intercompany receivables(accounts receivable). Regardless of firm size, firms’ largest liabilities tend to be bankborrowing(Small and Medium Enterprise Agency 2016, 285). Here, we calculate the value corresponding to the zombie firm ratio using current and fixed liabilities as proxy variables of bankborrowing. However, since this is a reference value by proxy variables, it is important to note that it is not the zombie ratio itself.
Figure 2 compares the original value using bankborrowing and the estimated value using current and fixed liabilities for the CHK, FN, and Imai definitions. It shows that the ratio based on the CHK definition is very different, while the gap between the FN and Imai ratios is small and their time series changes are similar. As mentioned earlier, this paper prefers the Imai definition of zombie firms, which it judges to be meaningful in analyzing long-term data based on estimated values for current and fixed liabilities.
Based on this understanding, Figure 3 shows the trend of estimated values based
(a) Imai Definition
0.0 2.0 4.0 6.0 8.0 10.0 12.0 14.0
2009 2010 2011 2012 2013 2014
by borrowings from banks by current and fixed liabilities
0.0 2.0 4.0 6.0 8.0 10.0 12.0 14.0 16.0 18.0 20.0
2009 2010 2011 2012 2013 2014
by borrowings from banks by current and fixed liabilities
0.0 10.0 20.0 30.0 40.0 50.0 60.0 70.0 80.0 90.0 100.0
2009 2010 2011 2012 2013 2014
by borrowings from banks by current and fixed liabilities
Figure 2. Calculated Zombie Ratios by Types of Debt (b) FN Definition
(c) CHK Definition
Note: Unit is percentage Source: Authors
74.0 76.0 78.0 80.0 82.0 84.0 86.0 88.0 90.0 92.0
0.0 5.0 10.0 15.0 20.0 25.0
1994 1995 1996 1997 1998 1999 2000 2001 2002 2003 2004 2005 2006 2007 2008 2009 2010 2011 2012 2013 2014
FN Imai CHK (right scale) Figure 3. Debt-Based Zombie Ratios
Note: Unit is percentage Source: Authors
on current and fixed liabilities(hereafter referred to as debt-based values). It is clear that the trend is quite different between the CHK and FN/Imai ratios. First, there is a large disparity between the CHK ratio(shown on right axis), and the FN/Imai ratios as the baseline level. The three ratios initially exhibit parallel movement until the mid-2000s, with the values according to each definition gradually declining from the mid-1990s
(a) Imai Definition
0.0 1.0 2.0 3.0 4.0 5.0 6.0 7.0
2009 2010 2011 2012 2013 2014
Small Middle Large
0.0 2.0 4.0 6.0 8.0 10.0
2009 2010 2011 2012 2013 2014
Small Middle Large
25.0 27.0 29.0 31.0 33.0 35.0 37.0 39.0
2009 2010 2011 2012 2013 2014
Small Middle Large
Figure 4. Zombie Ratio by Firm Size (b) FN Definition
(c) CHK Definition
Note: Unit is percentage Source: Authors
(when the data begins)over the ensuing ten years. From the mid-2000s onward, however, there is a noticeable disparity. The CHK ratio rapidly soars again to a high level, whereas the FN/Imai ratios increase once after 2008 before falling again, and remain close to each other during the mid-2000s.
Characteristics of Zombie Firms
In this section we investigate the relationship between different corporate attributes and the zombie ratio using the Imai definition. First, Figure 4 shows the zombie ratio by firm size according to capitalization. Small SME have less than¥100 million in equity capital, medium-sized SME have between ¥100 million and ¥1 billion in equity capital, and large firms have more than¥1 billion in equity capital.
The results show that the zombie ratios for the two SME categories are uniformly higher than the ratio for large firms. This finding is consistent with Imai(2016) and corroborates the argument that smaller-sized firms have a greater tendency to be zombie firms, a possibility that was not examined in the original CHK study on zombie firms which looked only at large enterprises.
0.0 1.0 2.0 3.0 4.0 5.0 6.0 7.0 8.0
2012 2013 2014
manufacturing non-manufacturing
Figure 5. Zombie Ratios of Manufacturing and Non-Manufacturing Industries
Note: Unit is percentage Source: Authors
Next, Figure 5 depicts the situation in Japan’s manufacturing and non- manufacturing industries. It shows that the manufacturing industry contains a higher zombie firm ratio than the non-manufacturing industry. This figure is based on the Imai definition, yet the same outcome is also observed with the CHK and FN definitions.
However, care is needed in interpreting these results, since the BSJBSA widely covers the manufacturing industry but is still in the process of expanding its coverage of the non-manufacturing industry. Additionally, it does not include data for microenterprises, many of which are in the non-manufacturing industry, so there is a high possibility of bias. Therefore, while it is possible to point out that many zombie firms exist in the manufacturing industry, one must be cautious about claiming that the ratio is higher for this industry than for the non-manufacturing industry.
Figure 6 shows the zombie ratio by specific industry sector. It includes 22 sectors based on SNA classification. Manufacturers of material and consumer goods are noticeable as two sectors with high zombie ratios. Results for the non-manufacturing industry require careful evaluation for the reasons stated above.
Finally, Figure 7 shows the ratio by firm age. Here, firm age is defined as the elapsed years since the establishment year. In all definitions including the Imai definition, the zombie ratio increases as firm age increases. Table 2 shows this from another angle. When the average age of zombie firms and non-zombie firms are calculated by each definition, zombie firms are found to be older. From Figure 7 and
0.0 1.0 2.0 3.0 4.0 5.0 6.0 7.0
Textile products Non-metallic mineral products Finance and insurance General-purpose, production and business oriented machinery Basic metal Electricity, gas and water supply and waste management service Agriculture, forestry and fishing Food products and beverages Fabricated metal products Transport equipment Pulp, paper and paper products Other manufacturing Electronic components and devices Wholesale and retail trade Precision instruments Transport and communications Petroleum and coal products Construction Chemicals Service activities
Figure 6. Zombie Ratios by Industry Sector
Note: Unit is percentage Source: Authors
Table 2, we see that there is a positive correlation between zombie formation and age.
Regression Results
Based on the above results, we conduct a regression analysis on zombie firms.
First, we estimate the probability of a firm’s identification as a zombie using a panel logit model, with a dummy dependent variable taking the value of “1” if the firm is a zombie and “0” if it is not. Table 3 shows the results of the fixed effect model selected by Hausmann’s test. As expected, the value of the variable representing the business situation(ROA in this case)is predominantly negative. However, both firm size(log of
(a) Imai Definition
2.0 3.0 4.0 5.0 6.0 7.0 8.0
2012 2013 2014
Young Middle-aged Old
2.0 3.0 4.0 5.0 6.0 7.0 8.0
2012 2013 2014
Young Middle-aged Old
20.0 25.0 30.0 35.0 40.0 45.0
2012 2013 2014
Young Middle-aged Old
Figure 7. Zombie Ratios by Firm Age (b) FN Definition
(c) CHK Definition
Note: Unit is percentage Source: Authors
Table 2. Average Age of Zombie and Non-Zombie Firms
43.30 44.23
45.64 average age (years)
not zombies
Imai FN CHK
46.85 49.25
52.12 average age (years)
zombies
76,886 107,795
72,275
# of firms (firms)
40,604 6,623
2,608
# of firms (firms)
(b) with industry dummies sample period: 2013-2014
(a) without industry dummies
S.D. p-value Coef. S.D. p-value
roa -6.7166 0.8591 0.0000 -6.9195 0.8715 0.0000
capital (log) 0.0696 0.1988
Coef.
0.7260 0.0498 0.1974 0.8010
age -0.0005 0.0185 0.9780 -0.0005 0.0186 0.9770
year dummies Yes Yes
industry dummies No Yes
log likelihood -1840.3 -1829.9
p-value, LR chi2 0.000 0.000
# of obs. 7514 7514
# of groups 1932 1932
dep. var.:
Imai-zombie dummy
Table 3. Regression Result by Fixed-Effect Panel Logit Model
capital amount)and firm age(elapsed years since establishment year)are not significant.
dep. var.: sample period: 2010-2014
roa S.D. p-value
capital (log) 0.0017 0.0002 0.0000
age -0.0004 0.0000
Coef.
0.0000
cons. -0.0486 0.0118 0.0000
year dummies Yes
industry dummies Yes
F (27,151096) 121.17
adj. R2 0.0210
# of obs. 151124
Table 4. OLS Results for ROA on Firm Size and Age
These results are logical because firms’ business conditions largely center on profit, a factor which strongly influences the probability of zombie formation.
Furthermore, as firms increase in size, firms with higher profits increase, while as firm age increases, profitability tends to decline. In fact, this tendency is easily confirmed by OLS(Table 4).
Based on these results, it is clear that the probability of zombie formation is not simply determined by a firm being a SME or having high age, but rather by its business conditions. In other words, there is no reason why zombie formation is only possible among large firms.
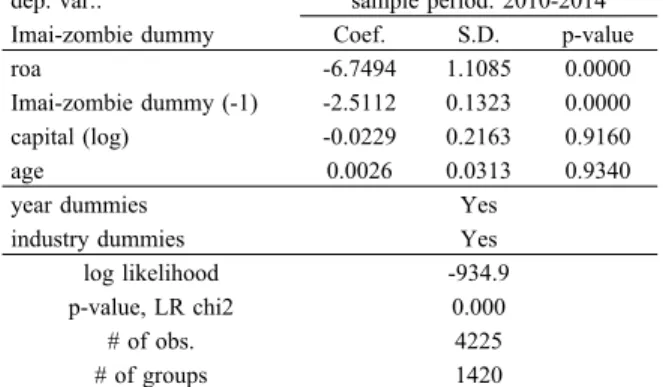
Initially, academic and policy interest in zombie firms was based on the notion that firms with poor prospects for revival were greatly prolonging their lives. Next, we examine this issue of survival in zombie status. When we lookat the parameter of the lagged variable(L1.crit_Imai) indicating that a firm was identified as a zombie in the previous term, we see that it is significantly negative(Table 5). This means that if a firm holds zombie status in one period, its probability of keeping zombie status in the next period decreases. This result is somewhat surprising, given that zombie firms are commonly portrayed as entities with excessive longevity. It suggests that firms that are identified as zombies do not endure in zombie status endlessly, and that many zombie firms return to a healthy situation. While we omit detailed explanation, these regression results based on the Imai definition of zombie firms are similarly established with the FN definition(Table 6).
We should emphasize that the results in Table 5 are only for firms that continue their survival in this term. In fact, there is a possibility that firms that were zombies in
0.0000 0.1323
-2.5112 Imai-zombie dummy (-1)
dep. var.: sample period: 2010-2014
Imai-zombie dummy
# of obs. 4225
S.D. p-value
roa -6.7494 1.1085 0.0000
capital (log) -0.0229 0.2163
Coef.
0.9160
age 0.0026 0.0313 0.9340
year dummies Yes
industry dummies Yes
log likelihood -934.9
p-value, LR chi2 0.000
# of groups 1420
Table 5. FE Panel Logit Model with Lagged Identification Dummy
14697
# of obs.
FN-zombie dummy
sample period: 2010-2014 dep. var.:
FN-zombie dummy (-1) -1.3433 0.0547 0.0000 Coef.
0.1618 -0.0957
capital (log)
0.0000 0.9390
-31.4976 roa
p-value S.D.
Yes year dummies
0.1060 0.0114
-0.0185 age
0.5540
-4084.6 log likelihood
Yes industry dummies
3683
# of groups
0.000 p-value, LR chi2
Table 6. FE Panel Logit Model for FN Definition
the previous term have exited this term. However, these firms drop out as a target of regression analysis. Therefore, it should be noted that bias exists in a positive direction when current term zombie status is used as the dependent variable.
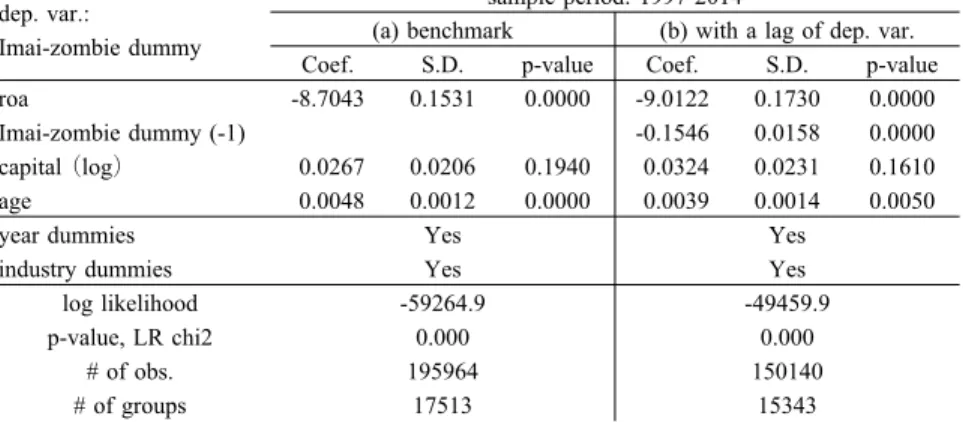
Until now, our results have been strictly based on the same definitions and types of data used in the original studies by CHK(2008), FN(2011), and Imai(2016). However, this stringency limits the period of our analysis, because the BSJBSA only contains data on borrowing from banks after 2009. We therefore use similar data to make proxy variables and extend the sample period, substituting current debt for short-term borrowing from banks and fixed debt for long-term borrowing from banks. These changes allow us to make 1995 the start year for identification with the CHK and FN definitions, and 1997 the start year with the Imai definition. We call this modified approach the “debt-based” definition, and show the results in Tables 7 and 8. It seems
0.1610 0.0231
0.0324 0.1940
0.0206 0.0267
capital(log)
(a) benchmark
sample period: 1997-2014
(b) with a lag of dep. var.
Coef.
Imai-zombie dummy (-1)
0.0000 0.1730
-9.0122 0.0000
0.1531 -8.7043
roa
p-value S.D.
Coef.
p-value S.D.
Yes year dummies
0.0050 0.0014
0.0039 0.0000
0.0012 0.0048
age
0.0000 0.0158
-0.1546
-49459.9 -59264.9
log likelihood
Yes Yes
industry dummies
Yes
# of groups
150140 195964
# of obs.
0.000 0.000
p-value, LR chi2 Imai-zombie dummy dep. var.:
15343 17513
Table 7. FE Panel Logit Model for Debt-Based Imai Definition
(b) with a lag of dep. var.
sample period: 1995-2014 (a) benchmark
capital (log) 0.0740 0.0155 0.0000 0.0435 0.0168 0.0100
S.D. p-value Coef. S.D. p-value
roa -8.2200 0.1068 0.0000 -8.2080 0.1169 0.0000
FN-zombie dummy (-1)
Coef.
-0.1187 0.0119 0.0000
age 0.0006 0.0009 0.5280 0.0013 0.0010 0.2190
year dummies Yes Yes
industry dummies Yes Yes
log likelihood -109728.2 -93826.9
p-value, LR chi2 0.000 0.000
# of obs. 338920 293629
# of groups 27617 24990
dep. var.:
FN-zombie dummy
Table 8. FE Panel Logit Model for Debt-Based FN Definition
that the major characteristics of the former results hold.
In addition to escaping from zombie status, it also possible that many zombie firms exit the marketplace entirely. Here we investigate this “exit” event itself. Since the BSJBSA does not collect information on market exit by firms, we regard the firms that do not report their data thereafter as having exited. We should note that this identification strategy possibly includes firms that simply quit answering the survey in later years.
Table 9 and 10 are the results of regressions which make exit the dependent variable(represented as dummy variable which takes “1” if a firm exits). Both tables show that if a firm becomes a zombie, the probability of exit significantly increases.
Additionally, having a longer duration of zombie status heightens exit probability.
As expected, as the size of firm (log of capital amount) becomes larger, the
0.0000 0.0761
-0.5904 0.0000
0.0819 -0.5486
capital (log)
(a) using zombie dummy
sample period: 1997-2014
(b) using zombie years
Imai-zombie years
Coef.
0.0544 0.1589
Imai-zombie dummy
0.0000 0.1883
-0.9406 0.0000
0.2000 -0.8449
roa
p-value S.D.
Coef.
p-value S.D.
Yes year dummies
0.0000 0.0102
0.6081 0.0000
0.0107 0.6053
age
0.0040
-9175.4 -6952.9
log likelihood
Yes Yes
industry dummies
Yes
# of groups
96411 81891
# of obs.
0.000 0.000
p-value, LR chi2 exit (+1)
dep. var.:
14525 13078
0.0911 0.0290 0.0020 Table 9. FE Panel Logit Model for Exit and Imai Definition-Zombie
Table 10. FE Panel Logit Model for Exit and FN Definition-Zombie
FN-zombie years
0.0000 0.0560
-0.3939 0.0000
0.0560 -0.3937
capital (log)
(a) using zombie dummy
sample period: 1995-2014
(b) using zombie years Coef.
0.0368 0.0727
FN-zombie dummy
0.0000 0.1625
-1.1346 0.0000
0.1635 -1.1411
roa
p-value S.D.
Coef.
p-value S.D.
Yes year dummies
0.0000 0.0078
0.5028 0.0000
0.0078 0.5029
age
0.0480
-13310.6 -13312.1
log likelihood
Yes Yes
industry dummies
Yes
# of groups
142669 142669
# of obs.
0.000 0.000
p-value, LR chi2
0.0090 0.0242
0.0635 exit (+1)
dep. var.:
20214 20214
probability of exit decreases. This is not surprising considering that smaller firms have higher credit risk. However, regression by segmented size groups shows us quite another aspect. We divide firms into two size groups, SME and large firms. Table 11 shows that becoming a zombie significantly increases the probability of exit in SME, while the parameter is smaller in large firms.
We also compare the business situations of zombies and non-zombies around the timing of exit. Table 12 shows the results of logistic regression in which the dependent variable is a dummy with the value “1” if employees of the firm decrease within the five-year period before a firm’s market exit. We can see that the probability of reducing employees increases if the firm is a zombie among small firms, while there is not such
Table 11. FE Panel Logit Model for Exit by Firm Size
0.7960 0.3100
0.0802 0.0010
0.1134 -0.3893
capital (log)
(a) SMEsample period: 1997-2012
(b) large firms Coef.
0.0575 0.1604
Imai-zombie dummy -0.7451 0.2038 0.0000 -1.1208 0.6654 0.0920
roa S.D. p-value Coef. S.D. p-value
Yes year dummies
0.0000 0.0406
0.7059 0.0000
0.0116 0.6393
age
0.6300 0.2059
0.0992 0.0050
-586.9 -6119.0
log likelihood Yes Yes
industry dummies Yes
# of groups# of obs. 732340.000 0.0007241
p-value, LR chi2 FN-zombie dummy dep. var.:
1088 11909
Table 12. Logit Model for Employee Decrease by Firm Size
0.2130 0.0769
-0.0958 0.0000
0.0315 -0.1670
capital (log)
(a) SME
sample period: 1997-2012, group: firms which will exit in next year (b) large
dep. var.:
workers-decrease (in 5yrs) dummy
age 0.0181
Coef.
0.0835 0.3079
Imai-zombie dummy -3.2518 0.3648 0.0000 -3.0887 0.9372 0.0010
roa S.D. p-value Coef. S.D. p-value
Yes year dummies
0.1360 0.7179
1.0714 0.0000
0.2075 1.1636
cons.
0.9390 0.2567
0.0195 0.0000
-455.8 -3902.9
log likelihood Yes Yes
industry dummies Yes
# of obs. 0.072 0.106
pseudo R2 0.000 0.000
p-value, LR chi2
757 7237
0.0018 0.0000 0.0163 0.0042 0.0000
Table 13. Logit Model for Sales Decrease by Firm Size
0.0136 age
dummy
profit-decrease (in 5yrs) dep. var.:
(b) large
sample period: 1997-2012, group: firms which will exit in next year (a) SME
capital (log) -0.2195 0.0316 0.0000 -0.0524 0.0775 0.4990
S.D. p-value Coef. S.D. p-value
roa -7.3623 0.4487 0.0000 -6.4365 1.1156 0.0000
Imai-zombie dummy 0.4064 0.0866 Coef.
0.0000 -0.1506 0.2533 0.5520
cons. 1.9976 0.2124 0.0000 1.2051 0.7261 0.0970
year dummies Yes Yes
industry dummies Yes Yes
log likelihood -3864.5 -447.8
p-value, LR chi2 0.000 0.000
pseudo R2 0.101 0.133
# of obs.
0.0020 0.0042
0.0128 0.0000
0.0018
7237 754
tendency among large firms. Table 13 shows a similar result, using sales instead of employees.
V. Conclusion
In this paper, we analyze the situation of zombie firms among Japanese SME with data from the BSJBSA. Our analysis covers a much larger sample of SME than previous studies, and addresses multiple characteristics of zombie SME, including firm size, firm age, duration in zombie status, market exit, and corporate activity at the time of exit.
Our findings reveal that though there remains some discrepancy over the zombie firm ratio based on different definitional criteria, according to the preferred Imai definition, Japanese SME contained a non-negligible amount of zombie firms during the lost decades. While chronological limitations in our data prevent us from directly estimating the zombie ratio before 2009, the proxy variable of current and fixed liabilities(what we call the “debt-based” zombie ratio)shows that, throughout the 2000s, a minimum of 10 percent of all firms in our sample were zombie firms. This finding suggests that zombies existed to a significant degree during this period, and at a comparably higher level than large-sized zombie firms estimated in other studies (Nakamura 2017). In other words, our analysis implies that CHK’s original study may have been intuitively correct about zombie firms’ presence in the post-bubble Japanese economy, but that its focus on listed firms was misplaced. To the extent that zombie firms existed in the lost decades, especially in the 2000s, they were a greater problem among SME.
Our paper makes an additional contribution in elucidating multiple corporate characteristics of zombie SME. Our findings in this area include: (1) zombie firms often escape from zombie status through recovery or exit, rather than perpetually keeping zombie status; (2) the probability of exit is higher for zombies that are SME;
and (3) exiting zombies’ economic performance is worse than that of exiting non- zombies. Certainly, firms’ exit, economic performance and zombie status are endogenous, but identifying zombies might offer an effective signal in the view of finance and economic policy.
Taken together, our findings carry two general implications for the study of
zombie firms going forward. First, it is important that research on zombie firms considers SME as well as large firms. Recent studies on Europe and South Korea have extended the debate on zombie firms beyond Japan, but some include SME(McGowan, Andrews, and Millot 2017)while others do not(Acharya et al. 2017). Data restrictions may complicate comprehensive analysis, but as this paper shows, SME are a significant corporate class where the possible presence of zombies should not be underappreciated.
Second, comparisons between different corporate categories might indirectly expose the presence of alternative mechanisms behind the generation of zombie firms.
While the nature of BSJBSA data prevented this paper from testing the proposition that Japan’s credit guarantee system supported zombie firms among Japanese SME, the finding of a high zombie ratio among small firms during the 2000s suggests that these zombies were underpinned by factors that did not similarly affect large firms. Future workshould specifically examine the situation of firms using the credit guarantee system to determine whether the system was responsible for generating zombie SME.
This could be a key lesson from Japan for scholars and policymakers concerned with zombie firms.
References
Acharya, Viral V., Tim Eisert, Christian Eufinger, and Christian W. Hirsch. 2017. “Whatever It Takes:
The Real Effects of Unconventional Monetary Policy.” SAFE Working Paper 152: 1-67.
Ahearne, Alan, and Naoki Shinada. 2005. “Zombie Firms and Economic Stagnation in Japan.”
International Economics and Economic Policy 2(4): 363-81.
Arbatli, Elif et al. 2016. “Reflating Japan: Time to Get Unconventional?” IMF Working Paper 16(157):
1-45.
Bankof England. 2012. Financial Stability Report.
Caballero, Ricardo J., Takeo Hoshi, and Anil K. Kashyap. 2008. “Zombie Lending and Depressed Restructuring in Japan.” The American Economic Review 98(5): 1943-77.
Chandler, Clay. 1999. “In Japan, a Reversal on Reform?: Premier Draws Fire for ‘Go Slow’ Stance on Economy.” Washington Post, October 29: E1.
Economist Intelligence Unit. 2010. SMEs in Japan: A New Growth Driver? The Economist.
Fackler, Martin. 2003. “Japan Targets Bad Bank Debt: Effort to Help Lenders Take Over Corporate Borrowers.” Wall Street Journal, April 14: C9.
Fukuda, Shinichi, and Junichi Nakamura. 2011. “Why Did ‘Zombie’ Firms Recover in Japan?” The World Economy 34(7): 1124-37.
Garside, W. R. 2012. Japan’s Great Stagnation: Forging Ahead, Falling Behind. Northampton: Edward