Shanghai's Real Estate Price ‑ Culprit or Scapegoat?
著者(英) Jr‑Tsung Huang, Yu‑Ning Hwang, Kuang‑Ta Lo journal or
publication title
AGI Working Paper Series
volume 2014‑02
page range 1‑32
year 2014‑03
URL http://id.nii.ac.jp/1270/00000050/
Creative Commons : 表示 ‑ 非営利 ‑ 改変禁止
The Role of Foreign Direct Investment in Shanghai’s Real Estate Price—Culprit or Scapegoat?
Jr-Tsung Huang
Department of Public Finance National Chengchi University Yu-Ning Hwang
Department of Economics National Chengchi University Kuang-Ta Lo
Department of Public Finance National Chengchi University
Working Paper Series Vol. 2014-02 March 2014
The views expressed in this publication are those of the author(s) and do not necessarily reflect those of the Institute.
No part of this article may be used reproduced in any manner whatsoever without written permission except in the case of brief quotations embodied in articles and reviews. For information, please write to the Centre.
The International Centre for the Study of East Asian Development, Kitakyushu
The Role of Foreign Direct Investment in Shanghai’s Real Estate Price—Culprit or Scapegoat?
+Jr-Tsung Huang
*Department of Public Finance National Chengchi University
Yu-Ning Hwang
**Department of Economics National Chengchi University
Kuang-Ta Lo
***Department of Public Finance National Chengchi University
Taipei, 116 Taiwan
+ The authors acknowledge the financial support provided for this research by the National Science Council, Taiwan (NSC-96-2415-H-004-013-MY3). The authors would like to thank paper discussant, Jack W. Hou (Professor of Economics at California State University, Long Beach) and also all participants of the 2012 Western Economics Association International (WEAI), Hilton Hotel, San Francisco, California, USA, June 29-July 3, 2012, for their helpful comments during the preparation of this paper. The authors are also grateful to all participants at seminar held in the School of Economics at Nankai University, Tianjin, the School of Public Administration and Policy at Renmin University of China, Beijing, Department of Applied Economics in the Guanghua School of Management at Peking University, Beijing, China, and
International Centre for the Study of East Asian Development
(ICSEAD),Kitakyushu, Japan
. All views and errors are solely those of the authors.* Jr-Tsung Huang is a Distinguished Professor in the Department of Public Finance at National Chengchi University, Taipei, 116 Taiwan. Comments are most welcome.
Contact details: e-mail to [email protected]; Tel.: +886-2-22349884; Fax:
+886-2-2938- 7574. (Corresponding Author)
** Yu-Ning Hwang is an Assistant Professor in the Department of Economics at National Chengchi University, Taipei, 116 Taiwan.
*** Kuang-Ta Lo is an Associate Professor in the Department of Public Finance at National Chengchi University, Taipei, 116 Taiwan.
The Role of Foreign Direct Investment in Shanghai’s Real Estate Price—Culprit or Scapegoat?
Abstract
The objective of this study is to investigate whether or not real estate FDI has a significant effect on real estate prices in Shanghai, the most open and fastest-growing city in China. The study uses monthly data for Shanghai from 2003 to 2010 with the Autoregressive Distributed Lag (ARDL) approach to cointegration. The primary finding is that real estate FDI does not have a significant effect on real estate prices, both housing prices and office prices, in Shanghai in the short run. It only affects Shanghai’s office price in the long run. Therefore, this study concludes that real estate FDI is a scapegoat in this matter, even though many people and the media treat it as a culprit and believe that it is responsible for the surges in housing and office prices in Shanghai.
Keywords: ARDL, Housing price, Office price, Real estate, Shanghai
JEL Classifications: F21, O18, R31
I. INTRODUCTION
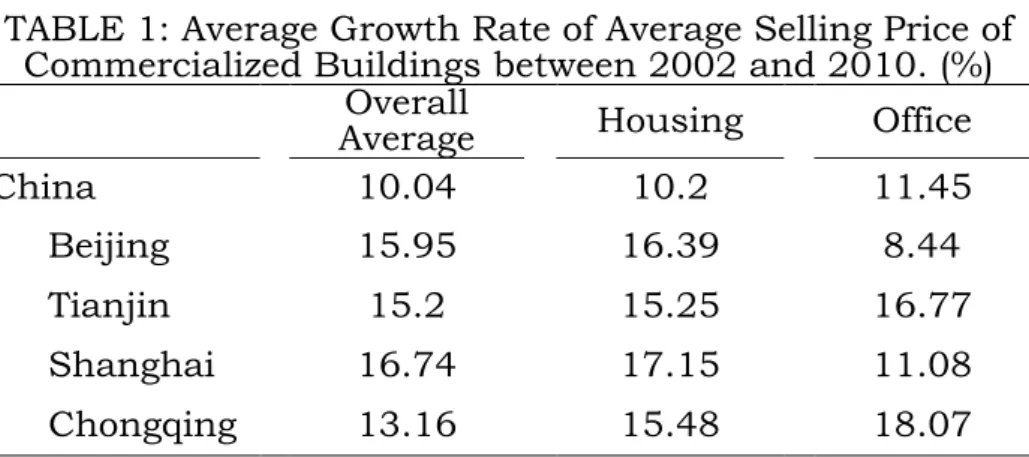
In the past two decades, housing prices in China, particularly in Shanghai, have risen significantly along with the rapid economic growth. According to Table 1, the growth rate of the average selling price of commercialized buildings in China as a whole averaged 10.04%
during the period from 2002-2010. However, during the same period, it averaged 13.16% in Chongqing, 15.2% in Tianjin, and 15.95% in Beijing. Shanghai, as the largest city in terms of population in China and as a global city with influence in commerce, culture, finance, media, fashion, technology, and transport, generally has the highest corresponding average growth rate of 16.74%, well above the overall average for China by 6.7 percentage points and exceeding the level for other major cities during the same period. The surges in real estate prices have led to widespread concerns over the affordability of houses to the general public. Understanding the factors that may be attributed to these rises in housing prices is critical, but much controversy continues to surround this issue.
Many studies investigating the real estate markets in China or other countries have shown foreign direct investment from overseas (FDI, hereafter) to have an ambiguous effect on housing prices.
1However, many studies, including media reports, official reports and academic research, have indicated that FDI should be responsible for the extremely high prices in Shanghai’s real estate market. Deng (2007) summarized a report provided by the Shanghai headquarters of the People’s Bank of China and pointed out that hot money from overseas pushed Shanghai’s real estate price to a higher level in 2007.
2In
1 For example, a recent study by Favilukis et al. (2012) showed that the changes in international capital flows have only a small part to play in the housing price fluctuations based on investigations using US data. On the other hand, the cointegration analysis by Wang et al. (2007) indicated that there is a long-term equilibrium relationship between the housing price and foreign capital inflows in China.
2 For more details, please visit
http://news.xinhuanet.com/fortune/2007-09/13/content_6716653.htm, which is provided by Xinhuanet, the official press agency of the People’s Republic of China and
TABLE 1: Average Growth Rate of Average Selling Price of Commercialized Buildings between 2002 and 2010. (%)
Overall
Average Housing Office
China 10.04 10.2 11.45
Beijing 15.95 16.39 8.44
Tianjin 15.2 15.25 16.77
Shanghai 16.74 17.15 11.08
Chongqing 13.16 15.48 18.07
Source: China Statistical Yearbook (2002-2011).
Note: Growth rate of average selling price of commercialized buildings by use (RMB per square meter).
addition, Zhong (2005) indicated that in 2004, most overseas companies’ investments in China’s real estate was primarily concentrated in the Shanghai area.
3Li (2005) reported that there are several reasons for the sharply increasing real estate prices, but that FDI was the factor of the greatest concern. It is also reported that large numbers of people blame FDI as the culprit for the high real estate prices in some cities in China. Moreover, Wen (2005) asserted that in some cities where there was concern, the most important reason for the soaring real estate prices was that some developers and FDI collusively sought to “pump and dump” in the real estate market. Since the many channels of FDI entering the real estate market are too complicated to regulate, Wen (2005) suggested that it was about time to control FDI’s entry into the common housing market in China.
From observing real estate FDI (REDFI, hereafter) and its share in real estate investments in four province-level municipalities, REFDI might indeed be regarded as one of the major factors responsible for the high level of real estate prices in Shanghai. According to Table 2, it is shown that prior to 2008 the amount of REFDI in Shanghai was the largest among four municipalities. It is also true for the total amount during the period of 2001-2010. Particularly in 2007, 2008, and 2010,
the biggest center for collecting information and press conferences in China.
3 For example, CapitaLand Group, Morgan Stanley, Shui On Group, Internationale Nederlanden Groep N.V., and Government of Singapore Investment Corporation Private Limited. However, the author concluded that FDI is not the primary factor stimulating the prices of real estate in China as a whole.
TABLE 2: The Amount of REFDI and Its Share in Real Estate Investments
Units: billion RMB, %
Year China Beijing Tianjin Shanghai Chongqing
Share Amount Share Amount Share Amount Share Amount Share
2001 1.38 1.52 1.32 0.19 0.98 1.59 1.91 0.11 0.51 2002 1.27 1.33 0.97 0.24 1.05 2.15 2.13 0.29 1.03 2003 0.88 1.00 0.53 0.30 0.94 1.72 1.33 0.41 0.98 2004 0.83 2.29 0.95 0.38 0.94 1.42 0.84 0.40 0.75 2005 0.80 2.92 0.94 0.27 0.44 1.52 0.76 1.07 1.53 2006 1.12 2.34 0.74 0.31 0.40 5.13 2.35 0.21 0.26 2007 1.30 1.90 0.46 1.77 1.79 6.54 2.56 1.22 0.90 2008 1.60 2.49 0.75 1.30 1.30 6.75 3.07 4.09 3.29 2009 0.70 2.50 0.41 0.90 0.64 2.27 0.78 3.59 1.94 2010 0.92 1.34 0.23 0.58 0.35 6.55 2.03 8.36 2.92 2001-10 1.04 19.64 0.60 6.25 0.82 35.64 1.79 19.75 1.92
Source: China Statistical Yearbook (2002-2011).
Note: REFDI is measured by foreign direct investment in real estate development.
while real estate prices were very high in Shanghai, the amount of REFDI was more than 6 billion RMB. With respect to the share of REFDI in real estate investments, it was higher in Shanghai than in China as a whole during 2001-2010. Prior to 2008, except for 2005, this share in Shanghai was the highest among four municipalities. In 2007 and 2008 while Shanghai’s real estate prices were increasing, this share in Shanghai was 2.56% in 2007 and reached its highest level of 3.07% in 2008.
The purpose of this study is to examine the role of REFDI in real estate prices in Shanghai, and in particular to answer the question regarding whether REFDI is a culprit of Shanghai’s high real estate prices or just a scapegoat. This study adopts two indexes to represent real estate prices, namely, the housing price index and the office price index. This study also uses monthly time-series data from January 2003 to December 2010 and the Autoregressive Distributed Lag (ARDL) approach to cointegration as proposed by Pesaran and Shin (1999) and Pesaran et al. (2001).
4The primary finding is that the effects of REFDI
4 This model allows the investigation of the data with different orders of integration to
on real estate prices, both the housing price and the office price, in Shanghai are insignificant. Thus, this study suggests that REFDI, widely considered to be one of the major factors behind the surges in the prices of real estate, is merely a scapegoat in this matter.
The remainder of this paper is organized as follows. In Section 2, the literature related to the determinants of real estate prices is reviewed, followed by an illustration of the real estate market in Shanghai in Section 3. In Section 4, an outline of the empirical model and the approach used in this study are provided. The analyses of the results are outlined in Section 5 and concluding remarks are presented in Section 6.
II. LITERATURE REVIEW
The growth of FDI in China has been dramatic since the economic reforms and opening up in 1978 and has been accompanied by a rapid economic growth and an increasing openness to the rest of the world.
While the massive flows of FDI into China have drawn a great deal of attention from scholars, as pointed by He et al. (2011), the impact of FDI on real estate prices is not the primary focus of previous studies. In fact, FDI has had a part to play in China’s real estate industry since the beginning of the opening-up policy, and the participation of foreign investors in China’s real estate industry has been significant.
Some studies have also recognized the increasing importance of REFDI in China’s real estate market. He et al. (2011) proposed that whether and to what extent FDI affects the real estate industry in China has become an important issue, and further used the data in China over the period from 1997 to 2007 to suggest that foreign investors in China’s real estate industry are both profit-seeking and risk-averse, that is to say, such FDI may consist of both short-term and opportunistic investment.
5estimate the long-run and short-run effects of the FDI on the real estate prices in Shanghai.
5 It is also found that REFDI has been highly concentrated in the coastal regions,
In addition, Jiang et al. (1998) studied the development of the real estate industry in China and argued that even though Hayek’s theory of economic fluctuations can help to explain the contraction of the real estate market in 1994 in China as a whole, it is no longer accurate when applied to the areas where there is vast FDI, such as Shanghai.
They also confirmed that it is the supply of FDI both in the real estate industry and in other industries, such as the construction industry, that benefits the real estate sector in Shanghai.
6Several empirical studies that test the relationship between real estate price fluctuations and foreign money inflows in China have been conducted. Wang et al. (2007) applied monthly data along with several econometric methods to show that there is a long-term equilibrium between real estate price rises and foreign money inflows and that foreign money inflows related to the increase in real estate prices are less important than increases in real estate prices due to foreign money inflows.
7In addition, Fan and Shan (2009) analyzed the influence of REFDI on the prices of real estate in China based on panel data at the provincial level from 1999 to 2006. According to their fixed effects model, they concluded that REFDI is one of the reasons which led to the increase of real estate prices in China.
8Wang et al. (2009) also studied the relationship between REFDI and China’s real estate growth (represented by the commercial housing sales price index) and demonstrated that there is a long-term and stable cointegration relationship between REFDI and China’s real estate growth, and that these two variables tend to affect each other under the two-way
particularly in Guangdong, Shanghai and Beijing, whereas REFDI has been diffused into inland provinces along the Yangtze River. There is also significant spatial autocorrelation in the provincial distribution of REFDI in China.
6 Moreover, they also concluded that the FDI in real estate is more characteristic of portfolio investment than FDI in other industries, especially the manufacturing sector.
7 These results are based on the co-integration test and error correction model (ECM).
In addition, from the Granger test, Wang et al. (2007) also demonstrated that foreign money inflows do not Granger-cause the price rises in the real estate market; however, higher real estate prices do Granger-cause inflows of foreign money.
8 It is found that a 1% increase in FDI infused in China would significantly result in a 0.018% increase in real estate prices.
Granger causality relationship.
9Moreover, Guo and Huang (2010) demonstrated that the speculative fund (hot money) has driven up property prices as well as contributing to the accelerating volatilities in the real estate market in China due to its enormous size and the short-term characteristic of investing.
10On the other hand, some studies do not find any significant relationship between FDI and real estate prices in China. Lin (2007) concluded that although GDP, FDI and the real estate price exhibit a cointegration relationship, however, the inflow of FDI only has a very minor effect instead.
11In addition, Qiu and Wang (2009) also utilized annual data on FDI and real estate prices during the 1987-2007 period to show that FDI and real estate prices exhibit a cointegration relationship but not a Granger causality relationship with each other.
Only one study conducted by Wan and Chen (2006) has paid attention to this issue in Shanghai. Wan and Chen (2006) employed the cointegration test to indicate that REFDI and the real estate growth have a long-term equilibrium, and the ECM model proves that REFDI usually exhibits a 4-year lag to influence the real estate industry in the short run. However, based on the Granger causality result, there is no evidence to support the view that REFDI is the direct reason for the growth of the real estate industry in Shanghai. In fact, the conclusion reached by Wan and Chen (2006) says nothing about the role of REFDI in real estate prices in Shanghai because they adopted the output value
9 Wang et al. (2009) used different empirical models such as the ADF test,
cointegration test, generalized impulse response analysis, variance decomposition and the Granger causality test.
10 As defined by Chari and Kehoe (2003), Guo and Huang (2010) also referred to hot money as the flows of speculative funds (or capital) from one country to another in order to mainly earn a short-term profit on interest rate differences and/or anticipated exchange rate shifts. In addition, the results for the forecast error variance
decomposition in Guo and Huang (2010) also indicated that hot money ranks as the second largest contributor in explaining the forecast error of China’s housing prices.
Thus, Guo and Huang (2010) finally concluded that the speculative funds aggravate the inflated short-term real estate prices and obviously enhance the volatility of the real estate market.
11 Lin (2007) used the time series data of GDP, FDI and the real estate price from 1987 to 2005 together with the Error Correction Model (ECM) and found that GDP is in fact the main factor pushing up real estate prices in China,
of the real estate industry instead of real estate prices to represent the real estate industry. In addition, from the above literature review, some studies assert a positive effect of REFDI on real estate prices, but others provide evidence of an insignificant impact. Therefore, the influence of real estate FDI on real estate prices in China, particularly in Shanghai, still remains very indecisive.
III. THE REAL ESTATE MARKET IN SHANGHAI
According to Table 2, the share of amount of REFDI in real estate investments in Shanghai is very small, thus it is suspected of an insignificant influence on real estate prices from REFDI. However, in Chinese general opinion, REFDI should be responsible for the high surges in the housing prices and office prices in Shanghai because REFDI can affect the real estate market in China in many complicated ways. According to Figure 1, there are various channels through which foreign capital flows into China’s real estate market. First, the foreign enterprises in the real estate business can invest in real estate by using private capital, or borrowings from foreign banks, and shareholder loans. The domestic enterprises engaging in real estate business can also obtain funds from the international capital market by issuing bonds abroad or through the sales of houses overseas. This is another way for the foreign capital to flow into China’s real estate market. These foreign funds can be invested in the development or purchases of real estate. As a result, once FDI can enter China’s real estate market, it can further affect real estate prices in China. The discussions below can give us a quick grasp of the underlying forces attributed to the rise in real estate prices, and the associated government policies and measures in dampening real estate booms.
The purchases of real estate that is an increase in demand for real
estates will undoubtedly push up real estate prices. However, the
increase in the funds for real estate development, which is the supply
side of the market, can also play an essential role in the surge of real
estate prices. According to Building Cost Information Service of the
Channel Source Intermediary Targets
1
(1) Private capital
Foreign enterprises for real estate development
(1) Development of real estate (2) Purchases of
commercialized buildings
(2) Overseas banks’ lending (3) Equity capital?
2
(1) International capital markets (e.g., corporate bonds)
(2) Overseas sales
Domestic
enterprises for real estate development
Figure 1: The Channels of REFDI in China’s Real Estate Market Royal Institution of Chartered Surveyors (2006), the primary factor leading to house price surges in China is the rise in the prices of materials for construction. Moreover, the increased real estate construction projects also significantly raised the demand for labor and specialists in construction which in turn pushed up wage costs. While the demand for real estate appears inelastic, as Gao and Wang (2008) show, suppliers can shift most of the increase in costs to consumers.
This may result in higher real estate prices.
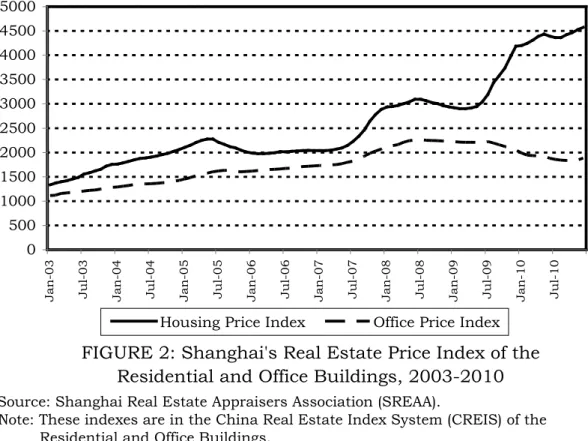
In the case of Shanghai, the housing market there has been booming for the past decade. As shown in Figure 2, housing prices and office prices followed a similar pattern from January 2003 to August 2008. Both prices rose significantly first, but later increased at a slower pace between mid-2005 and 2007.
The surges in housing prices which pervaded all of the major cities in China have given rise to much concern.
12In an attempt to reduce housing prices to increase housing affordability, China’s central government has relaxed various macro-control policies and these changes have been implemented in all cities, including Shanghai. Due to the rapidly-growing housing prices, the macro-control policy was
12 The rise in real estate prices, particularly housing prices, may make the houses less affordable to households and thereby hurt households’ welfare which can result in serious social conflicts.
FIGURE 2: Shanghai's Real Estate Price Index of the Residential and Office Buildings, 2003-2010
0 500 1000 1500 2000 2500 3000 3500 4000 4500 5000
Jan-03 Jul-03 Jan-04 Jul-04 Jan-05 Jul-05 Jan-06 Jul-06 Jan-07 Jul-07 Jan-08 Jul-08 Jan-09 Jul-09 Jan-10 Jul-10
Housing Price Index Office Price Index
Source: Shanghai Real Estate Appraisers Association (SREAA).
Note: These indexes are in the China Real Estate Index System (CREIS) of the Residential and Office Buildings.
restarted by the announcement of “Directive 121” and the required reserve ratio was increased from 2003 to 2007.
13“Directive 121”
restricted banks from extending loans to developers with weaker development capabilities or lower credit ratings, which was subsequently followed by stricter regulations. The “National Eight Regulations” (Circular 26) launched in May 2005 reinforced the restrictions on the speculative investments in the real estate market.
For example, they imposed a sales tax on the sales of residential buildings owned for less than 2 years.
14These policies were effective in reducing the housing prices in Shanghai between 2005 and 2007 as shown in Figure 2.
13 Raising the interest rate was one of the major macro-control measures. The required reserve ratio for RMB deposits in the depository institutions was increased several times, from 6% in August 2003 to 11% in May 2007. The interest rates on deposits and loans were also raised several times.
14 According to the “National Eight Regulations”, the sales of buildings owned less than two years are subject to sales tax on the full sale price, while the sales of ordinary residential buildings owned more than two years are not subject to the sales taxes. A more detailed description of the regulations on the real estate market up to 2007 is outlined by Soon (2007).
The general belief that REFDI was one of the driving forces behind the rises in real estate prices resulted in the regulatory measures in relation to REFDI by China’s central government. “Circular 171”
(Opinion 171) released in 2006 was the most important set of regulations to tighten and regulate inflows of foreign capital into the real estate markets since the 1990’s.
15This circular is an overall guideline on foreign capital inflows issued by the central government, followed by detailed rules of implementation released by the concerned authorities. Some rules specified in this circular may have an impact on overseas investors. In particular, according to the principle of
“commercial existence”, foreign institutions and individuals should setup foreign investment enterprises prior to the purchase of real estate properties, with the exception of self-use properties. This implies that the direct offshore holdings of China’s real estate properties will no longer be feasible.
In Figure 3, the growth rates of REFDI for China as a whole and for Shanghai are presented. The foreign capital inflows into China’s real estate market have risen significantly. However, the growth of REFDI in Shanghai has also fluctuated dramatically. In particular, the growth rate was 237% in 2006 and 28% in 2007. This is consistent with the surge in real estate prices in the second half of 2007 as shown in Figure 2. As a result, REFDI has been considered to be one of the primary factors that have driven the increases in real estate prices in Shanghai.
Some regulations in relation to REFDI that were included in the
“Catalogue of Restricted Foreign Investment Industries” were launched in 2007 with explicit restrictions regarding FDI in real estate, particularly for the construction and operation of high-ranking hotels, villas, high-class office buildings and international exhibition centers.
The housing prices and office prices in Shanghai climbed up again in
15 “Circular 171” was jointly issued by six Chinese ministries, including the Ministry of Construction, Ministry of Commerce, the National Development and Reform Commission, the People’s Bank of China, the State Administration for Industry and Commerce and the State Administration of Foreign Exchange.
FIGURE 3: Growth Rate of REFDI in China and Shanghai, 2002-2010
-100 -50 0 50 100 150 200 250 300
2002 2003 2004 2005 2006 2007 2008 2009 2010
Year
%
China Shanghai
Source: China Statistical Yearbook (2002-2011).
2007, but fell in mid-2008 and continued to decline during the worst part of the global financial crisis in the second half of 2008.
However, the trends in housing prices and office prices have diverged since 2009. Starting from July 2009, the housing price surged while the office price declined. The most recent macro-control policies were announced in 2010 due to a new surge in housing prices in 2009.
Subsequently, two major regulations, the “National Eleven Regulations”
(Notice 4) and “New National Ten Regulations” (Notice 10) were announced in January 2010 and April 2010, respectively.
These policies generally used fiscal and monetary measures similar to, but stricter than, the macro-control policies before 2007.
16These central government policies were closely followed by the municipal governments such as Beijing and Shanghai with more city-specific and rigid regulations. For example, the “Shanghai Twelve Regulations”, which could be the most comprehensive regulations for Shanghai’s real estate market, were released in October 2010. They essentially exactly followed the line of the “New National Ten Regulations” by the central
16 For example, compared to the “National Eight Regulations” (Notice 359) in 2007 which restricted the down payment on the second house to no less than 40%, the
“New National Ten Regulations” in 2010 raised the minimum requirement for the down payment on the second house to 50%.
government in the restrictions on the loans, the imposition of taxes, and the restrictions on the purchases of houses, with more stringent and specific details.
17In particular, while the “National Eleven Regulations”
permitted the municipal governments to regulate the number of houses purchased by each household, the “Shanghai Twelve Regulations” has explicitly imposed the restriction that since then each household may purchase only one commercialized building.
In addition, a new and more rigid regulation in regard to REFDI, Notice 186, was released in 2010, after the housing price rises in 2009.
It was based on the principles outlined in “Circular 171” and the “New National Ten Regulations” with an explicit regulation that foreign individuals can purchase only one house for self-use in China, while foreign institutions can only purchase non-residential buildings for business operations in the city where the institution is registered.
Although these macro-control policies and regulations seemed to contribute to the decline in office prices, they resulted in only a slight decline in housing prices at the beginning of 2010 without reversing the continuing rises as Figure 2 shows. However, whether or not these policy measures can be effective depends on the impact of REFDI on real estate prices. Therefore, the role of REFDI in the increasing real estate prices is the key to answering this question, particularly in the case of Shanghai, the area with the highest growth rate of real estate prices in China. This study will investigate this issue by using an empirical model as illustrated in the following section.
IV. EMPIRICAL MODEL
Previous studies have used different econometric methodologies to discuss the determinants of real estate prices. For example, Jacobsen
17 For example, the “National Ten Regulations” imposed regulations of 30% and 50%
of the down payments for the first and second houses with a floor area of more than 90 square meters, but there were no specific restrictions on the loans for the third house.
The “Shanghai Twelve Regulations”, however, restricted the purchase of the third house, and also imposed regulations on the down payment for houses with a floor area of less than 90 square meters.
and Naug (2005) used regression analysis,
18Wang et al. (2007) utilized the Granger causality test,
19and Guo and Huang (2010) applied a multivariate vector autoregressive (VAR) model with a Markov regime-switching feature.
20Since the monthly time-series data for Shanghai from January 2003 to December 2010 used in this study are not sufficient to estimate a VAR model,
21the Autoregressive Distributed Lag (ARDL) approach to cointegration as proposed by Pesaran and Shin (1999) and Pesaran et al. (2001) is adopted to investigate the relationship between REFDI and real estate prices in Shanghai. This estimation technique has been widely utilized by Karfakis (2002), Fatai et al. (2003), Huang and Kao (2005), Liu (2009), Shahbaz and Rahman (2010), and AbuDalu (2011) in different research settings.
4.1 Description of the Empirical Model
As argued by Halicioglu (2008) and Lewis-Bynoe et al. (2008), the ARDL model has certain econometric advantages in comparison to other single cointegration procedures. Firstly, this approach is relieved of the burden of establishing the order of integration amongst the variables and of pre-testing for unit roots.
22Secondly, the long and short-run parameters of the model can be estimated simultaneously.
Thirdly, the ARDL model is a more appropriate measure in the case of small samples, while other cointegration techniques still require large
18 Jacobsen and Naug (2005) showed that interest rates, housing construction, unemployment and household income are important explanatory factors for housing prices in the Norwegian economy.
19 Wang et al. (2007) demonstrated that inflows of foreign money do not
Granger-cause increases in real estate prices; on the contrary, increases in real estate prices Granger-cause inflows of foreign money.
20 Guo and Huang (2010) proved that speculative capital flows have aggravated short-term property prices and enhanced the volatilities in both the real estate and stock markets in China.
21 A VAR model also allows us to identify the long-run and short-run dynamics of defense spending on employment. However, when the number of variables in the system is large, a VAR model is hard to implement due to the need to take the degrees of freedom into consideration.
22 In fact, whereas all other methods require that the variables in a time-series regression equation be integrated of order one, i.e., the variables are I(1), only the method proposed by Pesaran et al. (2001) could be implemented regardless of whether the underlying variables are I(0), I(1), or fractionally integrated.
data samples for the purpose of validity.
23Finally, as pointed out by Laurenceson and Chai (2003), the ARDL model has a sufficient number of lags to capture the data generation process in a general-to-specific modeling framework.
24A typical ARDL approach to cointegration can be shown as follows:
t t t
t
k
i
i t i k
i
i t i k
i
i t i t
Z X
Y
Z Y
X t
Y
y z x
ε δ
δ δ
λ ϕ
t θ
θ
+ +
+
+
∆ +
∆ +
∆ + +
=
∆
−
−
−
= −
= −
= −
∑ ∑
∑
1 3 1 2 1 1
0 1
0 1 0
(1)
In equation (1), those terms with the summation signs capture the short-run dynamics of the model, whereas the other terms represent the long-run relationship. There are two stages involved in the implementation of the ARDL approach. In the first stage, the existence of the long-run relationship among the three variables under investigation is tested by computing the F-statistics for testing the significance of the lagged levels of the variables of the underling ARDL model by using the bounds testing procedure of Pesaran et al. (2001).
The null hypothesis of the non-existence of a long-run relationship that will be tested is that the lagged levels of Y
t, X
t, and Z
tare jointly insignificant; that is, H
0: δ
1= δ
2= δ
3=0.
25The second stage is that if the null hypothesis of no long-run relationship is rejected, then the ARDL approach can be estimated
23 However, as argued by Fatai et al. (2003), the possible disadvantage of the ARDL is the low number of degrees of freedom when estimating a regression with a small sample size.
24 Halicioglu (2008) indicated that it has certain econometric advantages in comparison to other single cointegration procedures. Firstly, endogeneity problems and the inability to test hypotheses in relation to the estimated coefficients in the long run associated with the Engle–Granger method are avoided. Second, the long- and short-run parameters of the model in question are estimated simultaneously. Third, all variables are assumed to be endogenous. Fourth, the econometric methodology is relieved of the burden of establishing the order of integration amongst the variables and the pre-testing for unit roots.
25 The tests are distributed according to a non-standard F-statistic irrespective of whether the explanatory variables are stationary or non-stationary. If the F-calculated statistic exceeds the upper critical value tabulated by Pesaran et al. (2001), then the null hypothesis of no long-run relationship can be rejected, regardless of the order of integration of the variables. If, however, the test statistics fall within the bounds, then the test becomes inconclusive. A test statistic that is below the lower critical bounds value would suggest that there is no cointegration/long-run relationship.
using the differences of the variables and the lagged long-run solution.
Moreover, the error correction model (ECM) of the ARDL equation can then be considered at this stage. The adjustment parameter, as reflected in the coefficient of the error correction term, denotes the speed of adjustment back to the long-run equilibrium after a short-run shock.
The primary issue of this study is to examine whether and to what extent FDI would have an impact on real estate prices in Shanghai.
Since houses and offices are different investment items, the dependent variable, the real estate price, is defined as either the housing price (HP) or office price (OP). That is to say, there are two models estimated in this study, one with HP and the other with OP as the dependent variable.
The key explanatory variable in this estimation is thus the REFDI. As Tsatsaronis and Zhu (2004) argued that inflation and the interest rate are both the dominant variables in determining housing prices, this study includes these two variables in its empirical model. In addition, this study follows Glascock et al. (2002) to include an industrial production variable in the regression.
26Since Ge and Lam (2002) suggested that the stock index is one of the important variables used to determine housing prices in Hong Kong, the stock index is also included. Finally, many studies have demonstrated that household income is the most important determinant of housing prices (Holly and Jones, 1997; Jacobsen and Naug, 2005), therefore disposable income is also included in the housing price regression, but excluded in the office price regression.
Two ARDL approach with ECM representations estimated in this study can be expressed as follows:
26 Glascock et al. (2002) suggested that expected real activities reflect future economic prospects so that changes in industrial production will have impacts on the real estate sector as well.
h t i t k
0 i
h i
k
0 i
i t h
i k
0 i
i t h
i i
t k
0 i
h i
k
0 i
i t h
i i
t k
0 i
h i
7
1 i
k
1 i
i t h
i i
h i h
1 h 0 t
) INCM ( L
) STOCK (
L )
IO ( L )
INTRST (
L
) CPI ( L )
REFDI (
L
) PRICE (
L YEAR
ECM )
HP ( L
7
6 5
4
3 2
1
ε
∆ ω
∆ λ
∆ γ
∆ t
∆ φ
∆ θ
∆ β δ
α α
∆
+
×
+
× +
× +
×
+
× +
×
+
× +
× +
+
=
−
=
= −
= −
−
=
= −
−
=
= = −
∑
∑
∑
∑
∑
∑
∑ ∑
(2)
o t g
0 i
i t o
i g
0 i
i t o
i
i t g
0 i
o i g
0 i
i t o
i i
t g
0 i
o i
7
1 i
g
1 i
i t o
i i
o i o
1 o 0 t
6 5
4 3
2
1
) STOCK (
L )
IO ( L
) INTRST (
L )
CPI ( L )
REFDI (
L
) PRICE (
L YEAR
ECM )
OP ( L
ε
∆ λ
∆ γ
∆ t
∆ φ
∆ θ
∆ β δ
α α
∆
+
× +
×
+
× +
× +
×
+
× +
× +
+
=
∑
∑
∑
∑
∑
∑ ∑
= −
= −
−
=
= −
−
=
= = −
(3)
The terms ∆L(HP), ∆L(REFDI), ∆L(CPI), ∆L(INTRST), ∆L(IO),
∆L(STOCK), and ∆L(INCM) denote the difference (∆) in the logarithm (L) of housing price, office price, FDI in the real estate market, the consumer price index, the interest rate, industrial output, the stock index, and disposable income, respectively. The variables REFDI, IO, and INCM are all expressed in real terms, and deflated by the price level (base year=2000). Subscript t is the time period,
1is the speed of adjustment parameter, and the ECM refers to the residuals that are obtained from the estimated cointegration model of Equation (1).
YEAR
1…YEAR
7denotes the dummy variable for each year from 2004 to 2010, respectively, for controlling any institutional changes or policies which are not considered in the empirical models.
tis the error term that satisfies general assumptions. The detailed definitions and data sources of all variables are described in the next sub-section.
After rejecting the null hypothesis of the non-existence of a long-run relationship, the speed of adjustment to equilibrium by estimating the ARDL form of Equations (2) and (3) can be determined by
1s. The optimal lag lengths of each variable in these two models, (k
1, …,
k
7) and (g
1, …, g
6) are selected by using the Akaike Information
Criterion (AIC) and the Schwarz Bayesian Criterion (SBC) in this study.
4.2 Description of Variables and Data Sources
The source of the monthly time-series data for the period from 2003 to 2010 of the housing prices and office prices in Shanghai is the Shanghai Real Estate Appraisers Association (SREAA). The housing and office price indexes are denoted by HP and OP in our model, respectively.
27The primary macroeconomic variables for Shanghai in this study are the actual real amount of foreign investment in the real estate industry in Shanghai denoted by REFDI.
28In addition, CPI is the consumer price index (previous year=100), and is actually an inflation rate. IO is the monthly real gross industrial output value obtained from the Shanghai Statistical Yearbook.
29The monthly real disposable income per capita of Shanghai (INCM) and the Shanghai stock exchange’s A share monthly index (STOCK) are provided by the Taiwan Economic Journal (TEJ) database.
30The monthly one-year lending rate in China (INTRST) is available at the website of the People’s Bank of China. Descriptions and statistics of variables are presented in Table 3.
V. EMPIRICAL RESULTS
The existence of a long-run relationship among seven variables in the housing price model and among six variables in the office price model is initially examined by computing the F-statistic. After estimating equation (1), the calculated F value for the long-run significance test is F(7, 71)=1.813 (p − value=0.098) for the housing price model and F(6, 71)=2.309 (p − value=0.043) for the office price model.
27 The overall housing price index for 10 major cities is obtained from the weighted average of the price indices of the residential buildings, office buildings, and houses for business use calculated according to the Laspeyres price index (the Hedonic index was introduced for the residential buildings after 2005).
28 While the yearly data for FDI in real estate are available in the Shanghai Statistical Yearbook, the monthly data are only available for the overall FDI, and not for FDI in real estate. Therefore, this study calculates the monthly REFDI as follows. Monthly REFDI equals monthly FDI times (yearly REFDI/yearly FDI) to control for the yearly fluctuations in the share of REFDI in FDI in Shanghai.
29 The monthly macroeconomic data for Shanghai are only available after 2003.
30 However, only quarterly disposable income is provided after 2008. Thus, we obtain the monthly disposable income by taking one third of the quarterly data.
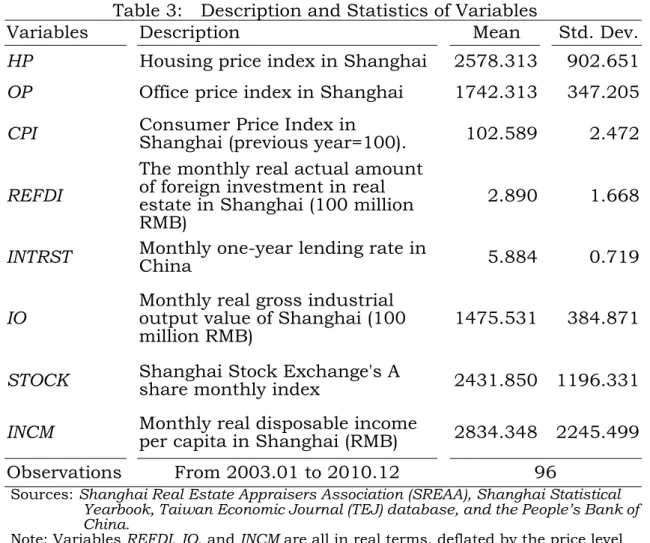
Table 3: Description and Statistics of Variables
Variables Description Mean Std. Dev.
HP Housing price index in Shanghai 2578.313 902.651 OP Office price index in Shanghai 1742.313 347.205 CPI Consumer Price Index in Shanghai (previous year=100). 102.589 2.472
REFDI
The monthly real actual amount of foreign investment in real estate in Shanghai (100 million RMB)
2.890 1.668
INTRST Monthly one-year lending rate in China 5.884 0.719
IO Monthly real gross industrial output value of Shanghai (100
million RMB) 1475.531 384.871 STOCK Shanghai Stock Exchange's A share monthly index 2431.850 1196.331 INCM Monthly real disposable income per capita in Shanghai (RMB) 2834.348 2245.499 Observations From 2003.01 to 2010.12 96
Sources: Shanghai Real Estate Appraisers Association (SREAA), Shanghai Statistical Yearbook, Taiwan Economic Journal (TEJ) database, and the People’s Bank of China.
Note: Variables REFDI, IO, and INCM are all in real terms, deflated by the price level (base year=2000).
Both are significant at the 10% and 5% levels, respectively. This implies that the null hypothesis of no long-run relationship among these variables in both cases can be rejected and supports the existence of a long-run relationship among them.
5.1 The Short-Run EC Estimation and Long-Run Analysis
After supporting the existence of a long-run relationship among these seven variables, the short-run EC estimates are shown in Table 4.
The results reported in Table 4 show that the optimal lag lengths of seven variables, k
1…k
6and k
7,
31in the housing price ARDL (k
1, k
2, k
3, k
4, k
5, k
6, k
7) model and of six variables, g
1…g
5and g
6, in the office price
31 k1, …, k6 are the optimal lags of CPI, REFDI, INTRST, IO, STOCK, and INCM, respectively, and k7 is the optimal lag of HPin Equation (2). g1, …, g6 are the optimal lags of CPI, REFDI, INTRST, IO, and STOCK, respectively, and g7 is the optimal lag of OP in Equation (3).
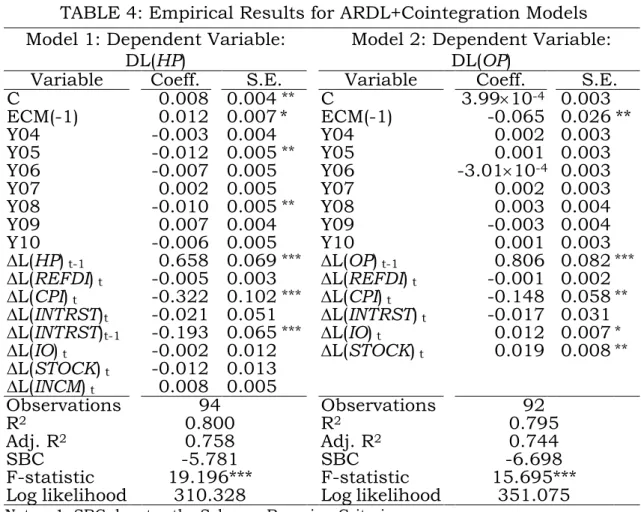
TABLE 4: Empirical Results for ARDL+Cointegration Models Model 1: Dependent Variable:
DL(HP) Model 2: Dependent Variable:
DL(OP)
Variable Coeff. S.E. Variable Coeff. S.E.
C 0.008 0.004
**C 3.99 × 10
-40.003 ECM(-1) 0.012 0.007 * ECM(-1) -0.065 0.026 **
Y04 -0.003 0.004 Y04 0.002 0.003 Y05 -0.012 0.005
**Y05 0.001 0.003 Y06 -0.007 0.005 Y06 -3.01 × 10
-40.003 Y07 0.002 0.005 Y07 0.002 0.003 Y08 -0.010 0.005
**Y08 0.003 0.004 Y09 0.007 0.004 Y09 -0.003 0.004 Y10 -0.006 0.005 Y10 0.001 0.003
∆L(HP)
t-10.658 0.069
***∆L(OP)
t-10.806 0.082
***∆L(REFDI)
t-0.005 0.003 ∆L(REFDI)
t-0.001 0.002
∆L(CPI)
t-0.322 0.102
***∆L(CPI)
t-0.148 0.058
**∆L(INTRST)
t-0.021 0.051 ∆L(INTRST)
t-0.017 0.031
∆L(INTRST)
t-1-0.193 0.065
***∆L(IO)
t0.012 0.007
*∆L(IO)
t-0.002 0.012 ∆L(STOCK)
t0.019 0.008
**∆L(STOCK)
t-0.012 0.013
∆L(INCM)
t0.008 0.005
Observations 94 Observations 92
R
20.800 R
20.795
Adj. R
20.758 Adj. R
20.744
SBC -5.781 SBC -6.698
F-statistic 19.196*** F-statistic 15.695***
Log likelihood 310.328 Log likelihood 351.075
Notes: 1. SBC denotes the Schwarz Bayesian Criterion.
2. *, **, and *** indicate that the coefficient differs statistically from zero at the 10%, 5%, and 1% significance levels, respectively.
ARDL (g
1, g
2, g
3, g
4, g
5, g
6) model are determined theoretically according to the Schwarz Bayesian Criterion (SBC).
32After estimating more than 17 million regressions for the housing price model and more than 1.6 million regressions for the office price model, models for the housing price and the office price are ARDL (0, 0, 1, 0, 0, 0, 1) and ARDL (0, 0, 0, 0, 0, 1).
33In the case of the housing price, the ARDL+Cointegration results indicate that after controlling other variables, the change in REFDI does not have any statistically significant effect on the housing
32 According to note 20 in Huang and Kao (2005), the AIC tends to select too many variables and further gives rise to an inconsistent estimator of the lag length.
Therefore, this study uses SBC instead of AIC as the method for selecting the optimal lag length.
33 Due to the limitations on the number of observations, the maximum lag length in this process of selecting the optimal lag length is 10 instead of 12 for these monthly data. If the maximum lag length is set at 11, the maximum number of parameters is 92 greater than the number of observations of 85=96-11. However, setting the maximum lag length at 10 enables us to estimate 17, 715, 610 regressions for the housing price model and 1,610,510 regressions for the office price model.
price in Shanghai. This conclusion also holds in the case of the office price. This finding is reasonable because according to Table 2, the share of amount of REFDI in real estate investments in Shanghai is very small.
That is to say, as both the housing price and the office price have increased dramatically in Shanghai recently, REFDI is not large enough to play any role in this regard. Thus, this study concludes that REFDI is indeed a scapegoat, even though many people and the media treat it as a culprit that should be responsible for the high surges in the housing prices and office prices in Shanghai.
As is consistent with our expectations, both the housing price and the office price are affected by their own previous levels. According to Table 4, both coefficients of ∆L(HP)
t-1and ∆L(OP)
t-1are positive and statistically significant at α =1%. In addition, the coefficient of ∆L(CPI)
tin the housing price model is negative and significantly different from zero at the 1% significance level, implying that any change in the CPI has a contemporaneous and negative influence on the housing price in Shanghai. This is also true in the case of the office price. This finding is reasonable because lower inflation may leave greater purchasing power to the households to make the housing purchases or investments, further increase real estate prices, and vice versa. The interest rate does not have an instant effect on either the housing price or the office price.
However, its value in the previous month seems to have a negative influence only on the housing price. Conversely, it seems that IO has a contemporaneous and positive influence only on the office price in Shanghai. The coefficient of ∆L(IO)
tis statistically significant at α =10%.
Moreover, neither STOCK nor INCM has a statistically significant
impact on the housing price in Shanghai. The change in the Shanghai
Stock Exchange’s A share index does not have any influence on the
housing price, but does have an immediately positive influence on the
office price in Shanghai, meaning that the stock market and the office
price move together in a short-run relationship. The reason could be
that the profits of the investors from the stock market can in turn be
invested in the real estate markets instantly.
Estimated coefficients of ECM equaling 0.012 and -0.065 for the housing price model and the office price model, respectively, are statistically significant at the 10% and 5% levels, indicating the joint significance of the long-run coefficients in both cases. Moreover, the ECM coefficient is not very high, reflecting a slow degree of convergence.
That is to say, once the housing (office) market is exposed to a shock, it will take a long time, approximately 83 (15) months, to return to equilibrium.
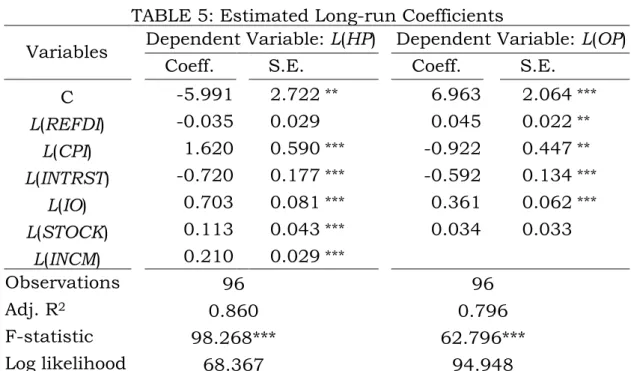
The estimated long-run coefficients are shown in Table 5.
34It is revealed that the long-run solutions of the estimated ARDL model are not very consistent with the conclusions to the short-run estimation. In the case of the housing price, except for REFDI, the estimated coefficients of CPI, INTRST, IO, STOCK, and INCM are all statistically significant at the 1% level. Except for INTRST which has a negative impact on the housing price, CPI, IO, STOCK, and INCM all have a positive influence on the housing price in the long-run. In the case of the office price, REFDI seems to have a significantly positive relation with the office price in Shanghai. That is to say, REFDI and the office price move together in a long-run relationship. IO has a positive impact, but both CPI and INTRST have a negative impact on the office price in the long run. However, the stock market does not statistically affect the office price in Shanghai.
5.2 The Robustness of the Empirical Model
The residuals of the underlying two ARDL equations, one for the
34 This study adds a constant term to the long-run dynamics when considering other factors that might affect both the housing price and office price. However, since seven time dummy variables are included in both Error Correction ARDL models, the time trend variable is not included in the two long-run dynamic models.
TABLE 5: Estimated Long-run Coefficients
Variables Dependent Variable: L(HP) Dependent Variable: L(OP) Coeff. S.E. Coeff. S.E.
C -5.991 2.722
**6.963 2.064
***L(REFDI) -0.035 0.029 0.045 0.022
**L(CPI) 1.620 0.590
***-0.922 0.447
**L(INTRST) -0.720 0.177
***-0.592 0.134
***L(IO) 0.703 0.081
***0.361 0.062
***L(STOCK) 0.113 0.043
***0.034 0.033 L(INCM) 0.210 0.029
***Observations 96 96
Adj. R
20.860 0.796
F-statistic 98.268*** 62.796***
Log likelihood 68.367 94.948
Note: *, **, and *** indicate that the coefficient differs statistically from zero at the 10%, 5%, and 1% significance levels, respectively.
housing price, and the other for the office price, are plotted in Figure 4.
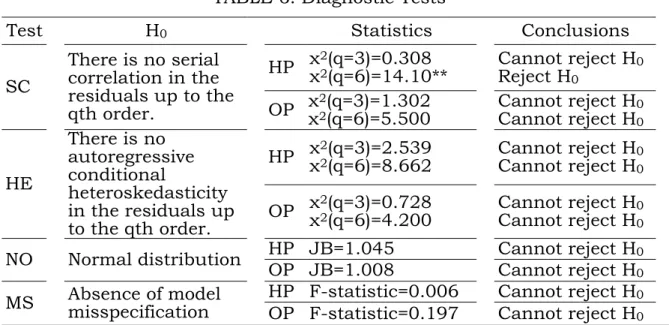
In order to confirm the robustness of the model specification suggested in this study, several diagnostic tests are conducted with respect to the residuals for econometric issues related to serial correlation (SC), heteroskedasticity (HE), and normality (NO). This study utilizes the Serial Correlation LM Test to examine the null hypothesis that there is no serial correlation up to lag order q, where q is a pre-specified integer.
35For testing the null hypothesis of homoskedasticity, the ARCH LM Test proposed by Engle (1982) is adopted.
36A standard method for a normality test, the Jarque-Bera statistic, is employed.
37Finally, in order to test for model misspecification (MS), the Regression Specification Error Test (RESET) proposed by Ramsey (1969) is
35 The test belongs to the class of asymptotic (large sample) tests known as the Lagrange multiplier (LM) tests. For a further discussion on this method, please refer to Godfrey (1988).
36 The ARCH LM Test is a Lagrange multiplier (LM) test for autoregressive conditional heteroskedasticity (ARCH) in the residuals.
37 As mentioned in Greene (2000), Jarque-Bera is a test statistic for testing whether the series is normally distributed. The test statistic measures the difference of the skewness and kurtosis of the series with those from the normal distribution. Under the null hypothesis of a normal distribution, the Jarque-Bera statistic is distributed as χ2 with 2 degrees of freedom.
-.03 -.02 -.01 .00 .01 .02 .03
-.04 -.02 .00 .02 .04 .06 .08
2003 2004 2005 2006 2007 2008 2009 2010 Residual Actual Fitted
-.02 -.01 .00 .01 .02
-.04 -.02 .00 .02 .04
2003 2004 2005 2006 2007 2008 2009 2010 Residual Actual Fitted
(a). Housing Price (b). Office Price
FIGURE 4: Plotted Residuals for the Housing Price and Office Price applied.
38The estimated statistics are presented in Table 6, where it is found that the model specification of the ARDL equation satisfies most of the econometric criteria, namely, that there is an absence of serial correlation, homoskedasticity, and normality, and it is unable to detect any model misspecification. All these results indicate that the model of the ARDL approach to cointegration adopted in this study is thus quite well specified and therefore the estimation results from the empirical model are also quite robust.
VI. CONCLUDING REMARKS
Real estate prices in Shanghai have risen significantly in the past decade. FDI in the real estate market has been considered to be one of the primary factors driving up these real estate prices. The objective of this study is to examine the role of real estate FDI in the surges in real estate prices in Shanghai, the most open and most rapidly-growing city
38 RESET is a general test for the following types of specification errors: 1. Omitted variables: the empirical model does not include all relevant independent variables. 2.
Incorrect functional form: some or all of the dependent and/or independent variables are transformed to logs, powers, reciprocals, or in some other way. 3. Correlation between independent variable(s) and ε, which may be caused by the measurement error in the independent variable, simultaneous equation considerations,
combinations of the lagged dependent variable values and serially-correlated disturbances.
TABLE 6: Diagnostic Tests
Test H
0Statistics Conclusions
SC There is no serial correlation in the residuals up to the qth order.
HP χ
2(q=3)=0.308
χ
2(q=6)=14.10** Cannot reject H Reject H
0 0OP χ
2(q=3)=1.302
χ
2(q=6)=5.500 Cannot reject H Cannot reject H
00HE
There is no autoregressive conditional
heteroskedasticity in the residuals up to the qth order.
HP χ
2(q=3)=2.539
χ
2(q=6)=8.662 Cannot reject H Cannot reject H
00OP χ
2(q=3)=0.728
χ
2(q=6)=4.200 Cannot reject H Cannot reject H
0 0NO Normal distribution HP JB=1.045 Cannot reject H
0OP JB=1.008 Cannot reject H
0MS Absence of model misspecification HP F-statistic=0.006 Cannot reject H
0OP F-statistic=0.197 Cannot reject H
0 Note: *, **, and *** indicate that the coefficient differs statistically from zero at the 10%, 5%,and 1% significance levels, respectively.