in the accumulation of hepatic stellate cells, macrophages and neovascularization
著者 Yang Xiaoqin, Lu Peirong, Ishida Yuko, Kuziel William A., Fujii Chifumi, Mukaida Naofumi journal or
publication title
International Journal of Cancer
volume 118
number 2
page range 335‑345
year 2006‑11‑15
URL http://hdl.handle.net/2297/6665
Running Title: Contribution of CCR2 to liver metastasis process
ATTENUATED LIVER TUMOR FORMATIOPN IN THE ABSENCE OF CCR2 WITH A CONCOMITANT REDUCTION IN THE ACCUMULATION OF HEPATIC STELLATE CELLS, MACROPHAGES, AND NEOVASCULARIZATION
Xiaoqin Yang
1, Peirong Lu
1, Yuko Ishida
1, William A. Kuziel
3, Chifumi Fujii
1 ,2, and Naofumi Mukaida
1 ,2 *1
Division of Molecular Bioregulation, Cancer Research Institute, Kanazawa University, Kanazawa, Japan
2
Center for the Development of Molecular Target Drugs, Cancer Research Institute, Kanazawa University. Kanazawa, Japan
3
Department of Autoimmune and Inflammatory Diseases, Protein Design Labs.
Inc., Fremont, USA
*Correspondence to: Division of Molecular Bioregulation, Cancer Research Institute, Kanazawa University, 13-1 Takara-machi, Kanazawa 920-0934, Japan.
Fax: 81-76-234-4520. E-mail: [email protected]
Key words: angiogenesis; chemokine; hepatic stellate cell; Kupffer cell; liver
metastasis; matrix metalloproteinase; monocyte chemoattractant protein
Abbreviations: αSMA, α smooth muscle actin; CEA, carcinoembyronic antigen;
HSC, hepatic stellate cell; IMVD, intratumoral microvessel density; KO, knockout; KC, Kupffer cell; MCP-1, monocyte chemoattractant protein-1; MMP, matrix metalloproteinase; TIMP: tissue inhibitor of matrix metalloproteinase; WT, wild type.
Grant sponsor: Ministry of Education, Culture, Sports, Science and Technology
of the Japanese Government.
ABSTRACT
The liver parenchyma is populated by hepatocytes and several non-parenchymal cell types including Kupffer cells and hepatic stellate cells.
Both Kupffer cells and hepatic stellate cells are responsive to the chemokine CCL2, but the precise roles of CCL2 and these cells in liver tumor formation remain undefined. Hence, we investigated the effects of the lack of the major CCL2 receptor, CCR2, on liver tumor formation induced by intraportal injection of the murine colon adenocarcinoma cell line, colon 26. Wild-type mice showed macroscopic tumor foci in the liver 10 days after injection of colon 26 cells.
After 10 days, CCL2 proteins were detected predominantly in tumor cells,
coincident with increased intratumoral macrophage and hepatic stellate cell
numbers. Although tumor formation occurred at similar rates in wild-type and
CCR2-deficient mice up to 10 days after tumor cell injection, the number and size
of tumor foci were significantly attenuated in CCR2-deficient mice relative to
wild-type mice thereafter. Moreover, neovascularization and matrix
metalloproteinase 2 expression were diminished in CCR2-deficient mice with a
concomitant reduction in the accumulation of macrophages and hepatic stellate
cells. Furthermore, matrix metalloproteinase 2 was detected predominantly in
hepatic stellate cells but not in macrophages. We provided the first definitive
evidence that the absence of CCR2-mediated signals can reduce the trafficking of
hepatic stellate cells, a main source of matrix metalloproteinase 2, and
consequently can diminish neovascularization during liver tumor formation.
INTRODUCTION
Liver metastasis is a common complication among patients with tumors of the gastrointestinal tract, especially colon,
1and it is one of the major factors influencing the prognosis of these patients. A better understanding of the liver metastatic process at both the cellular and molecular levels is required to develop novel therapeutic strategies. Accumulating evidence suggests that metastasis proceeds by the interaction between tumor cells and resident cells in various target organs. However, the role of resident cells in the liver during liver metastasis remains to be investigated fully.
The liver consists of hepatic parenchymal cells and a variety of
non-parenchymal cell types, including Kupffer cells (KC), hepatic stellate cells
(HSC), endothelial cells (EC), and several sets of resident lymphocytes. KC
belong to the macrophage lineage and are presumed to have crucial roles in the
first-line defense in liver to eradicate microorganisms and eliminate toxic
substances.
2 ,3KC have also exhibited direct cytotoxic activity against tumor cell
lines in vitro.
4In in vivo models of liver metastasis, tumor cells tended to adhere
to the sinusoid endothelium and were phagocytosed by KC that were attracted to
these sites.
5 ,6In contrast to these findings, a role for KC in promoting liver
metastasis has also been proposed. In human colorectal cancer liver metastasis,
the density of KC correlated well with microvessel density and inversely with
prognosis.
7Moreover, the demonstrated ability of carcinoembyronic antigen
(CEA) to promote metastasis to liver in some experimental tumor models may be
mediated by KC.
8 , 9Support for this idea comes from the finding that KC treated
with CEA and related molecules in vitro produce several pro-inflammatory
cytokines such as IL-1, IL-6, and TNF- α. These molecules induce the expression
of adhesion molecules on endothelial cells, which would serve to promote the
metastatic process.
1 0 ,11Thus, the role of KC in liver metastasis needs to be
clarified.
Several recent reports have presented evidence to support the idea that HSC also contribute to liver metastasis. Melanoma cells induce HSC to secrete matrix metalloproteinase (MMP) 2 during experimental liver metastasis.
1 2Moreover, intrasplenic injection of murine melanoma cells induced the accumulation in the liver of activated HSC, and vascular endothelial growth factor (VEGF) produced by these cells facilitated neovascularization.
1 3However, it remains to be determined which factor(s) regulates the trafficking of HSC.
CCL2/monocyte chemoattractant protein (MCP)-1, a member of the CC
chemokine family, induces a wide variety of functional activities in
monocytes/macrophages, including chemotaxis, the release of reactive oxygen
species and lysosomal enzymes, and enhancement of their tumoricidal
activities.
1 4CCR2 is the major, if not only, receptor for CCL2,
1 5 ,1 6and it is
expressed by various types of macrophage lineage cells, including KC,
1 7and by
tumor-infiltrating macrophages in various human
1 8 ,1 9and murine tumors.
2 0Moreover, CCL2 is produced by a variety of cancer cell types,
2 1suggesting that
CCL2 is involved in the local accumulation of tumor-associated macrophage
lineage cells. The fact that CCL2 is also chemotactic for HSC suggests that it
may play a significant role in metastasis of the liver by recruiting HSC.
2 2In this
report, we used CCR2-deficient mice in a model of liver metastasis to investigate
whether the CCL2-CCR2 axis is involved in macrophage and HSC accumulation
in the liver and whether there is an effect on subsequent tumor development and
neovascularization.
MATERIAL AND METHODS
Antibodies Rat anti-mouse F4/80 (clone A3-1) and anti-mouse CD34 (clone MEC14.7) monoclonal antibodies were obtained from Serotec (Oxford, United Kingdom). Rabbit anti-mouse CCL2 IgG was prepared as described previously.
2 0Goat anti-mouse CCR2 antibody was obtained from Santa Cruz Biotechnology (Santa Cruz, CA). Mouse anti-human α smooth muscle actin (αSMA; clone 1A4) monoclonal antibody, which can detect also the mouse antigen, was obtained from DAKO (Denmark). Goat anti-mouse MMP2 antibody was obtained from R&D Systems (Minneapolis, MN). Rat anti-mouse ER-MP20 monoclonal antibody was purchased from Biomedicals (Augst, Switzerland). Isotype-matched IgG from the same species was used as negative control.
Mice Specific pathogen-free 8 to 10-week old female BALB/c mice were purchased from Charles River Japan CO. (Yokohama, Japan) and designated as WT mice. CCR2-deficient mice were generated as described previously,
2 3backcrossed to BALB/c mice for more than 8 generations in our animal facility and designated as CCR2 KO mice. CCR2 mRNA was detected in splenocytes and peritoneal macrophages obtained from WT but not CCR2 KO mice (our unpublished data), confirming the lack of CCR2 gene expression in CCR2 KO mice. All the animal experiments were performed under specific pathogen-free conditions in accordance with the Guideline for the Care and Use of Laboratory Animals in Takara-machi Campus of Kanazawa University.
Induction of liver tumor formation A murine colon adenocarcinoma cell line, colon 26,
2 0 ,2 4was maintained in RPMI1640 medium supplemented with 10%
heat-inactivated fetal bovine serum at 37°C in a humidified atmosphere with 5%
CO
2. Subconfluent cells were harvested, washed twice with Hank’s balance salt
solution (HBSS) and resuspended in HBSS at a density of 1.25 × 10
5cells/ml.
The cell viability was always more than 95% by a trypan blue exclusion test.
Mice were anesthetized with an intraperitoneal injection of 1.8% (v/v) Avertin at a dose of 0.15 ml/10 g body weight.
2 5Then, mice underwent laparotomy by an upper median incision to expose the duodenal loop and 200 μl of a suspension of colon 26 cells was injected into the portal vein using a 30-guage needle attached to a 1 ml syringe. To prevent bleeding and peritoneal dissemination of tumor cells, a sterile cotton sponge was placed over the injection site.
2 6Mice were sacrificed at the indicated time intervals after tumor injection to determine the body weight, liver weight, incidence of liver tumor formation, and the number of tumor foci in liver tissue. In another series of experiments, the livers were obtained for histological analysis and total RNA extraction.
Histological analysis A portion of liver tissue was fixed with 10% formalin neutral buffer solution and embedded in paraffin. The sections were cut at the thickness of 5 μm and stained with a hematoxylin and eosin solution. The numbers and sizes of the tumor foci were determined according to the method described by Pierce
2 7by using a digital camera mounted on a microscope. The images were imported into Adobe Photoshop ver 7.0 (Adobe Systems Inc., San Jose, CA), and the foci number per cm
2and the proportions of areas occupied with tumor foci were determined with the use of NIH Image Analysis Software ver 1.62 (National Institutes of Health, Bethesda, MD)
Immunohistochemical analysis Paraffin-embedded sections were deparaffinized
and incubated for 30 min with 1% H
2O
2in methanol to eliminate endogenous
peroxidase. Then, for antigen retrieval, sections were treated with 0.1% trypsin in
0.1% CaCl
2for 15 min at 37°C, or immersed in 10 mM sodium citrate buffer (pH
6.0) and heated for 20 min in a microwave oven. Subsequently, endogenous
avidin and biotin were blocked with Avidin-Biotin Blocking kit (Vector Laboratories, Burlingame, CA), and nonspecific protein binding was blocked with 10% serum obtained from the same species used to produce the secondary antibody. Thereafter, the sections were incubated with rat anti-mouse F4/80 (1 μ g/ml), anti-CD34 (5 μ g/ml), anti-ER-MP20 (5 μg/ml), rabbit anti-CCL2 (10 μ g/ml), goat anti-CCR2 (2 μ g/ml) or anti-MMP2 (5 μ g/ml), overnight at 4°C.
After being washed, the sections were incubated for 45 min at room temperature with biotinylated anti-rat Ig, anti-rabbit Ig, and anti-goat Ig antibodies to detect CD34, ER-MP20, CCL2, CCR2, and MMP2, respectively. The immune complexes were visualized using ELITE ABC kit (Vector Laboratories) according to the manufacturers’ instruction. No positive reactions were observed under the present condition when isotype-matched control Ig was used instead of specific primary antibodies. The number of CCL2-positive cells inside tumor foci, was determined in each animal on five randomly chosen fields at 400-fold magnification. To detect F4/80 antigen, Catalyzed Signal Amplification System (DAKO, Carpinteria, CA) was used according to the manufacturers’ instruction. After F4/80-positive cells were counted on five randomly chosen fields in each animal at 200-fold magnification by an examiner without any prior knowledge of the experimental procedures, their numbers were calculated for tumor and non-tumor areas. For an immunohistochemical staining of activated HSC, DAKO Envision System (DAKO, Carpinteria, CA) was used together with mouse anti- αSMA as previously described.
2 8The pixel numbers of αSMA-positive areas were determined and HSC density was expressed as percentage of the whole metastasis area as previously described.
2 8Intratumoral microvessel density (IMVD) CD34-positive areas in the tumor
tissues were defined as the intratumoral vascular areas.
2 9Areas of abundant
neovascularization (hot spots) were found inside metastasis foci by scanning the
sections at low magnification, and then the pixel numbers of CD34-positive areas were determined on five randomly chosen fields in hot spots of each animal at 200-fold magnification with the aid of Adobe Photoshop software Ver 7.0. The density of neovascularization was expressed as percentage of the whole metastasis area.
Double-color immunofluorescence analysis Sections were deparaffinized, and treated with 0.1% trypsin for 15 min at 37°C for antigen retrieval. Thereafter, sections were incubated with the combination of rat anti-mouse F4/80 and goat anti-mouse MMP2, anti-α SMA and anti-MMP2, goat anti-mouse CCR2 and anti-F4/80, or anti-CCR2 and anti-α SMA antibodies overnight at 4°C. After being rinsed with PBS, for a double immunofluorescence analysis using anti-F4/80, the sections were incubated with FITC-conjugated donkey anti-rat IgG (1/50) and Cy3-conjugated donkey anti-goat IgG (1/100) (Molecular Probes, Inc., Eugene, OR) for 30 min at room temperature in dark. For a double immunofluorescence analysis using anti-α SMA, the sections were first incubated with biotinylated anti-mouse Ig (1/100) for 45 min at room temperature, and subsequently with FITC-conjugated streptavidin (1/50) and Cy3-conjugated donkey anti-goat IgG (1/100) for 30 min at room temperature in dark. Finally, sections were washed with PBS and immunofluorescence was visualized in a dual channel mode on a fluorescence microscope (Olympus, Tokyo, Japan). Images were processed using Adobe Photoshop software Ver 7.0.
RNA Isolation and semi-quantitative RT-PCR Total RNA was extracted from a
fragment of liver tissue with RNA-Bee
T M(Tel-Test, Inc., Friends Woods, TX)
according to the manufacturers’ instruction. The RNA preparations were then
treated with ribonuclease-free deoxyribonuclease (DNase) I (Life Technologies,
Inc., Gaithersburg, MD) to remove residual genomic DNA. Two µg of total RNA
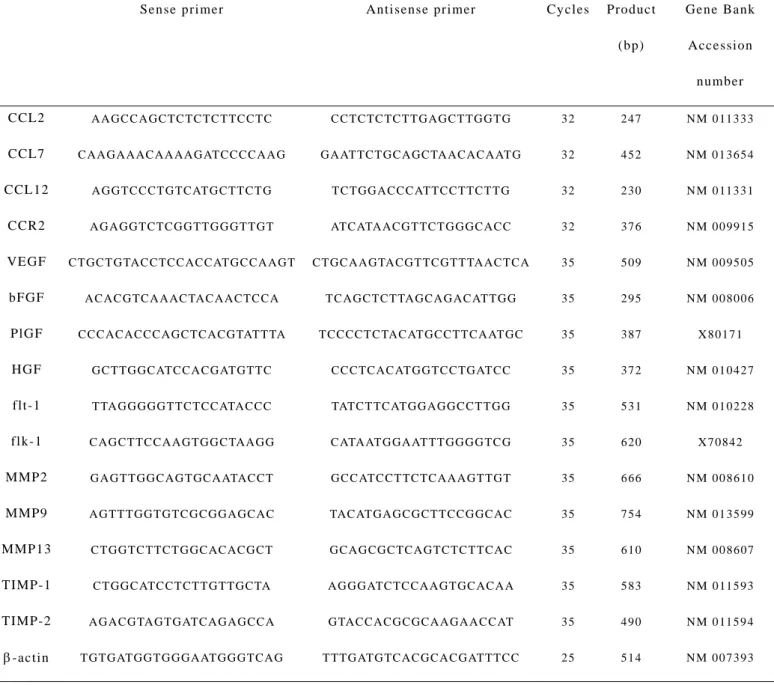
was reverse-transcribed at 42°C for 1 hr in 20 µl of reaction mixture containing mouse Moloney leukemia virus reverse transcriptase (Toyobo, Osaka, Japan) and hexanucleotide random primers (Amersham Biosciences, Tokyo, Japan). Serially two-fold diluted cDNA products were amplified for β-actin using specific set of primers (Table I) with 25 cycles of 94°C for 30 sec, 55°C for 1 min, and 72°C for 1 min, in 25 µl of reaction mixture containing Taq polymerase (Takara Shuzo, Kyoto, Japan) to evaluate the amount of the transcribed cDNA. Thereafter, equal amounts of cDNA products were amplified for the indicated genes using specific sets of primers based on the reported sequences, with the optimal cycle numbers of 94ºC for 30 sec, 55°C for 1 min, and 72°C for 1 min (Table I). After the amplification, the resultant PCR products were fractionated on a 1.2% agarose gel and visualized by ethidium bromide staining under ultraviolet light transillumination. The intensities of the bands were determined using NIH Image Analysis Software Ver 1.62 and the ratios to β-actin were determined.
2 8 ,3 0CCL2 enzyme-linked immunosorbent assay (ELISA) Liver tissues were obtained at the indicated time points and were homogenized in 10 volumes [1:10 (wt:vol)]
of RIPA buffer [50 mM Tris pH 7.5, 150 mM NaCl, 1 mM EDTA, 1%
polyoyehylene (9) octylphenyl ether, and 2 mM phenylmethane sulfonyl fluoride]
on ice. The homogenates were then centrifuged at 10,000 × g for 10 min at 4°C,
and the resulting supernatants were transferred to a fresh tube and stored at -80°C
until use. Total protein concentrations were determined using Bio-Rad protein
assay kit (Bio-Rad Laboratories, Hercules, CA), using bovine serum albumin as a
standard. Then, CCL2 contents in the supernatants were determined with the
mouse CCL2 ELISA kit (BioSource Inc., Camerillo, CA) according to the
manufacturers’ instruction. The data were expressed as CCL2 (pg)/total protein
(mg) for each sample.
HSC isolation and culture HSC were isolated from WT mouse livers by perfusing the liver tissues with a combination of Pronase E (Merck, Damstadt, Germany) and Collagenase type IV (Sigma, St. Louis, MO) solution, followed by Nycodenz ○
R(ICN Biomedicals Inc., Aurora, Ohio) gradient centrifugation as described previously.
3 1HSC were harvested from the top density gradient layer of 1.025-1.035 g/ml. The isolated cell population exhibited a rapidly fading blue-green autofluorescence at 328 nm excitation wavelength, a characteristic feature of HSC.
3 1HSC were maintained in Dulbecco’s modified Eagle’s medium (DMEM) containing 10% fetal calf serum (FCS) and 10% horse serum, penicillin (100 U/mL), and streptomycin (100 μ g/mL). Culture medium was changed after overnight culture and then changed every two days. After 5 days of culture on uncoated plastic, all the HSC exhibited the phenotype of well spread myofibroblast-like cells with specific α SMA expression. The viability and purity of HSC were more than 95 and 98% as assessed by trypan blue exclusion and the presence of rapidly fading autofluorescence, respectively. Total RNA was extracted from the resultant HSC population for RT-PCR analysis.
Statistical analysis Data were analyzed statistically using one-way ANOVA
followed by the Fisher ’s protected least significance difference test or
Mann-Whitney’s test. p <0.05 was considered statistically significant.
RESULTS
Liver metastasis formation Microscopic metastases appeared in the liver of WT mice at 6 days after the intraportal injection of colon 26 cells (data not shown).
At 10 days after the injection of the tumor cells, macroscopic metastasis foci were evident and both the number and size of the foci progressively increased thereafter in WT mice (Table II).
Expression of CCR2 and its ligands during liver metastasis formation Because colon 26 cells constitutively express mRNA for CCR2 ligands (our unpublished data), we used RT-PCR to monitor changes in the RNA levels of CCR2 ligands during the course of liver metastasis. This analysis on the livers of untreated WT mice showed barely detectable expression of the genes for CCL2/MCP-1, CCL7/MCP-3 and CCL12/MCP-5 as well as for CCR2 (Fig. 1a, b). However, intraportal injection of colon 26 cells in WT mice dramatically increased the levels of RNA for CCL2, CCL7, and CCL12 when measured at both 10 and 14 days after the injection (Fig. 1a, b). CCR2 RNA levels also rose during this time period but to a lesser extent than RNA for the CCR2 ligands in WT mice (Fig. 1 a, b). We next examined whether the increase in CCL2 RNA correlated with an increase in CCL2 protein during the course of liver metastasis in this model. By immunohistochemical analysis, CCL2 was barely detectable in the liver of untreated WT mice and until 6 days after the tumor injection (data not shown).
However, ten days after the injection of tumor cells, the time when macroscopic
metastasis foci first appeared, CCL2 was abundantly detected in the tumor cells
(Fig. 1C-i ) but to a lesser degree in the tumor vasculature (Fig. 1c-ii) and bile
duct epithelia (Fig. 1c-iii). The number of CCL2-positive cells increased
further at 14 days after injection of tumor cells (Fig. 1 c-iv, d). Consistent with
RT-PCR analysis and immunohistochemical analysis, intrahepatic CCL2 contents
were increased dramatically from 10 days after the injection in WT mice (Fig. 1e).
CCR2-positive cells were detected predominantly inside tumor foci (Fig. 1c-v) and to a lesser extent in the sinusoids of tumor-free areas of the liver of WT mice (Fig. 1c-vi ).
Reduced liver tumor formation in CCR2 KO Mice To clarify the pathological roles of CCR2-mediated signals in this liver metastasis model, we injected the same number of colon 26 cells into the portal veins of WT and CCR2 KO mice.
Ten days after the injection of tumor cells, there were no significant differences between these two mouse strains in terms of liver weights, liver-to-body weight ratios, and number of metastasis foci in the liver tissue (Table II). At 14 days, however, liver weights and liver-to-body weight ratios of WT mice were nearly twice those of CCR2 KO mice. Moreover, the number of tumor foci per cm
2and the liver area occupied by tumor foci were increased nearly four times in WT mice relative to CCR2 KO mice (Table II). Furthermore, 6 out of 16 CCR2 KO mice survived at 22 days after the tumor injection, when all WT mice died due to heavy tumor burden. The median survival time was prolonged marginally in CCR2 KO, compared with WT mice (WT, 17.4 days; CCR2 KO, 20.9 days.
p<0.05). On the contrary, there were no significant differences in CCR2 ligand mRNA expression between WT and CCR2 KO mice (Fig. 1 a, b). Moreover, the number of CCL2-positive cells in the tumor sites as well as intrahepatic CCL2 contents were increased in WT and CCR2 KO mice to a similar extent (Fig. 1d, e).
As expected, no CCR2-positive cells were detected in the tumor sites of CCR2 KO mice (data not shown). These observations suggest that the absence of CCR2 did not result in compensatory enhancement of the expression of its ligands.
Reduced accumulation of macrophages and HSC in CCR2 KO mice
Macrophages and HSC have been reported to respond to CCL2 in chemotaxis
assays.
2 2Therefore, we examined macrophage and HSC accumulation in liver tumor foci in WT and CCR2 KO mice by F4/80 and αSMA staining, respectively.
At 10 days after tumor cell injection, there were no significant differences in macrophage numbers in tumor and non-tumor areas of the liver between WT and CCR2 KO mice. However, at 14 days after tumor cell injection, WT mice but not CCR2 KO mice showed a significant increase in macrophage number in tumor areas of the liver (Fig. 2). Similar results were obtained on the number of α SMA-positive activated HSC in liver tumor foci (Fig. 3). Because F4/80 can recognize both resident sinusoidal macrophages/KC and blood-derived macrophages in the liver, we next used ER-MP20,
3 2to identify the blood-derived macrophages. Among F4/80-positive macrophages, 1.78% and 2.07% were also positive for ER-MP20, in liver of untreated WT and CCR2 KO mice, respectively.
At 14 days after the tumor injection, 20.13 ± 4.78% and 22.57 ± 3.46% of F4/80-positive cells in the tumor areas were also positive for ER-MP20 in WT and CCR2 KO mice (n = 6), respectively. Collectively, these results suggest that both F4/80
+ER-MP20
-resident sinusoidal macrophages/KC and F4/80
+ER-MP20
+blood-derived macrophages accumulated in the tumor areas in addition to HSC and that CCR2-mediated signals were involved in the trafficking of these cells to a similar extent.
Reduced neovascularization and MMP2 expression in liver tumor foci in CCR2 KO mice Tumor formation was delayed in CCR2 KO mice 14 days after tumor injection. Because neovascularization is a prerequisite for metastasis, particularly in the growth of metastasis foci,
3 3we evaluated angiogenesis in the livers by immunohistochemistry with antibodies that recognize CD34, a marker of endothelial cells.
2 9In WT mice, neovascularization became evident by 10 days after tumor cell injection and the neovascular areas increased thereafter (Fig. 4).
In sharp contrast, microvessel densities inside metastasis foci in CCR2 KO mice
did not increase from 10 to 14 days after the injection of tumor cells (Fig. 4). We next used RT-PCR to monitor changes in expression of genes for MMPs and cytokines that exhibit pro-angiogenic activities in order to evaluate the potential contribution of these factors to neovascularization in liver metastasis. Among these angiogenic factors, there was no change in the level of RT-PCR products for vascular endothelial growth factor (VEGF), hepatocyte growth factor (HGF), and the VEGF receptors flt-1 (FMS-like tyrosine kinase 1/VEGF receptor 2) and flk-1 (fetal liver kinase, protein-tyrosine kinase receptor/VEGF receptor 1) during the course of metastasis (Fig. 5). In contrast, the level of basic fibroblast growth factor (bFGF) RNA was increased in WT mice beginning at the day 10 and day 14 time points. Placenta-derived growth factor (PlGF) RNA was first detectable only at day 10 and the RNA levels increased further at day 14. The enhanced gene expression tended to be less evident in CCR2 KO mice although the differences did not reach statistical significance (Fig. 5). Among MMPs, mRNA for MMP2, MMP9 and MMP13 was enhanced in the liver of WT mice at 10 days after tumor cell injection. TIMP-1 RNA was first detectable at this time point (Fig. 5). The only significant difference between WT and CCR2 KO mice was the reduction in MMP2 RNA in the latter strain at 14 days (Fig. 5).
MMP2 expression in HSC Several lines of evidence suggest that MMP2 is
expressed by αSMA-positive cells but not by KC in human primary
hepatocellular carcinoma and in liver metastasis.
3 4 ,3 5Consistent with this notion,
a double-color immunofluorescence analysis failed to detect immunoreactive
MMP2 in F4/80
+cells inside tumor areas (Fig. 6 a). In untreated WT mouse liver,
MMP2 protein was barely detected (data not shown). In contrast, a double-color
immunofluorescence analysis confirmed that MMP2 protein is associated with
α SMA-positive cells in the tumor sites derived from WT (Fig. 6b, upper panel). A
quantitative analysis further demonstrated that 65.6
±13.7% of MMP2-positive
areas were also positive for α SMA in WT mice Moreover, MMP2 protein was detected in α SMA-positive cells in the tumor sites derived from CCR2 KO mice (Fig. 6 b, lower panel). Considering the sensitivities of a double-color immunofluorescence analysis, these results show that HSC but not F4/80-positive macrophage linage cells are the main source of MMP2, a potent inducer of angiogenesis.
CCR2 expression on macrophage and HSC Since the absence of CCR2 protein
on HSC was reported previously,
2 2we examined CCR2 expression on
α SMA-positive and on F4/80-positive cells by a double-color
immunofluorescence analysis. CCR2 protein was detected on most F4/80-positive
cells (Fig. 7a) but not on αSMA-positive cells (Fig. 7 b). We next isolated HSC
from untreated WT mice and extracted total RNA for RT-PCR analysis. RT-PCR
analysis detected specific CCR2 transcript in HSC population (Fig. 7c). Because
an immunofluorescence analysis cannot detect a modest number of surface
antigen, these observations suggest that HSC expressed a small number of CCR2,
which can be detected only by a sensitive RT-PCR but not an
immunofluorescence analysis. Thus, it is likely that CCR2 has direct effects for
HSC, although we cannot completely exclude the possibility that CCR2-mediated
F4/80-positve macrophage accumulation and activation may indirectly activate
HSC as reported previously.
3 6DISCCUSSION
Tumor formation was delayed in CCR2 KO mice only after macroscopic foci appeared in this model. These observations prompted us to evaluate neovascularization, a crucially responsible process for growth of tumor foci.
3 3CD34-positive vascular areas were diminished in CCR2 KO mice, compared with WT mice. Thus, reduced neovascularization may account for delayed tumor formation in CCR2 KO mice.
Neovascularization consists of multiple steps that include the degradation of basement membrane surrounding an existing vessel, migration and proliferation of endothelial and mural cells, and lumen formation.
3 3These processes are regulated by MMPs
3 7and angiogenic factors such as VEGF, bFGF, PlGF, and HGF.
3 8 - 4 1CCR2 KO mice exhibited reduced neovascularization concomitantly with reduced accumulation of hepatic macrophages and hepatic stellate cells. Because macrophages are known to be a main source of these factors,
4 2 -4 4it was not surprising that we found increased levels of RNA for PlGF, bFGF, MMP2, MMP9 and MMP13 in the liver after intraportal injection of tumor cells. Although the expression of all these genes tended to be decreased in CCR2 KO mice, only the level of MMP2 RNA was significantly attenuated in these animals compared with WT mice. MMP2 can induce tube formation by endothelial cells
4 5by binding with integrin α
vβ
3on these cells.
4 6The crucial involvement of MMP2 in tumor neovascularization is supported by the observation of reduced tumor neovascularization and tumor formation in MMP2-deficient mice.
4 7Thus, reduced MMP2 expression might account for the diminished neovascularization and subsequent retarded liver tumor formation in CCR2 KO mice, although the contribution of PlGF, bFGF, and other MMPs cannot be completely excluded.
Previous in situ hybridization analysis revealed that activated HSC
express the MMP2 gene in human primary hepatocellular carcinoma and liver metastasis.
3 4 ,3 5Moreover, HSC can secrete MMP2 upon interaction with melanoma cells in vitro.
1 2Consistently, we have shown by immunohistological analysis that HSC but not macrophages are a primary source of MMP2 in this model. HSC infiltrated tumor foci in a time-dependent manner in WT mice and HSC accumulation was significantly reduced in CCR2 KO mice, compared with WT mice. The absence of CCR2-mediated signals lessened the intratumoral accumulation of HSC, a rich source of MMP2, thereby reducing angiogenesis, a prerequisite step for the latter phase of metastasis focus growth. This may explain why the absence of CCR2 attenuated tumor formation only at 14 days after the tumor injection, the relatively later phase of tumor progression. This notion can be corroborated by the previous observation that HSC appeared in avascular micrometastasis foci preceding endothelial cell recruitment in mouse liver metastasis arising from intrasplenic injection of B16 melanoma cells.
1 3We previously observed that CCL2 gene transfer enhanced the capacity of colon 26 cells to metastasize to lungs with a concomitant increase in neovascularization at the metastasis sites without any augmentation in macrophage infiltration.
4 8These observations suggest that CCL2 might possess direct angiogenic activities, a notion that is supported by the expression of CCR2 by human endothelial cells.
4 9 ,5 0Moreover, CCR2 was expressed by intratumoral F4/80-positive macrophages, which can secrete various angiogenc factors and MMP, including bFGF and MMP9
4 2 -4 4 ,5 1. CCR2 deficiency resulted in the
reduction in bFGF and MMP9 gene expression marginally but not significantly
with a concomitant apparent reduction in macrophage infiltration. Thus, in this
model, CCR2-mediated signals induced the accumulation of macrophages, which
can contribute to neovascularization by secreting these factors, in concert with
MMP2 expressed mainly by HSC.
ACKNOWLEDGEMENTS
We thank Dr. Toshikazu Kondo (Wakayama University) for his invaluable advice
on the experimental procedures.
REFERENCES
1. Gayowski T, Iwatsuki S, Madariaga J, Selby R, Todo S, Irish W, Starzl T.
Experience in hepatic resection for metastatic colorectal cancer: analysis of clinical and pathologic risk factors. Surgery 1994;116:703-10.
2. Laskin DL, Weinberger B, Laskin JD. Functional heterogeneity in liver and lung macrophages. J Leukoc Biol 2001;70:163-70.
3. Gregory SH, Wing EJ. Neutrophil-Kupffer cell interaction: a critical component of host defenses to systemic bacterial infections. J Leukoc Biol 2002;72:239-48.
4. Bayon LG, Izquierdo MA, Sirovich I, van Rooijen N, Beelen RH, Meijer S.
Role of Kupffer cells in arresting circulating tumor cells and controlling metastatic growth in the liver. Hepatology 1996;23:1224-31.
5. Kan Z, Ivancev K, Lunderquist A, McCuskey PA, McCuskey RS, Wallace S. In vivo microscopy of hepatic metastases: dynamic observation of tumor cell invasion and interaction with Kupffer cells. Hepatology 1995;21:487-94.
6. McCuskey PA, Kan Z, Wallace S. An electron microscopy study of Kupffer cells in livers of mice having Friend erythroleukemia hepatic metastases. Clin Exp Metastasis 1994;12:416-26.
7. Miyagawa S, Miwa S, Soeda J, Kobayashi A, Kawasaki S. Morphometric analysis of liver macrophages in patients with colorectal liver metastasis. Clin Exp Metastasis 2002;19:119-25.
8. Hashino J, Fukuda Y, Oikawa S, Nakazato H, Nakanishi T. Metastatic potential of human colorectal carcinoma SW1222 cells transfected with cDNA encoding carcinoembryonic antigen. Clin Exp Metastasis 1994;12:324-8.
9. Thomas P, Gangopadhyay A, Steele G Jr, Andrews C, Nakazato H, Oikawa S,
Jessup JM. The effect of transfection of the CEA gene on the metastatic
behavior of the human colorectal cancer cell line MIP-101. Cancer Lett
1995;92:59-66.
10. Minami S, Furui J, Kanematsu T. Role of carcinoembryonic antigen in the progression of colon cancer cells that express carbohydrate antigen. Cancer Res 2002;61:2732-5.
11. Gangopadhyay A, Lazure DA, Thomas P. Adhesion of colorectal carcinoma cells to the endothelium is mediated by cytokines from CEA stimulated Kupffer cells. Clin Exp Metastasis 1998;16:703-12.
12. Olaso E, Santisteban A, Bidaurrazaga J, Gressner AM, Rosenbaum J, Vidal-Vanaclocha F. Tumor-dependent activation of rodent hepatic stellate cells during experimental melanoma metastasis. Hepatology 1997;26:634-42.
13. Olaso E, Salado C, Egilegor E, Gutierrez V, Santisteban A, Sancho-Bru P, Friedman SL, Vidal-Vanaclocha F. Proangiogenic role of tumor-activated hepatic stellate cells in experimental melanoma metastasis. Hepatology 2003;37:674-85.
14. Rollins B J. Monocyte chemoattractant protein 1: a potential regulator of monocyte recruitment in inflammatory disease. Mol Med Today 1996;2:
198-204.
15. Charo IF., Myers SJ., Herman A, Franci C, Connolly AJ, Coughlin SR.
Molecular cloning and functional expression of two monocyte chemoattractant protein 1 receptors reveals alternative splicing of the carboxyl-terminal tails.
Proc Natl Acad Sci USA 1994;91:2752-6.
16. Murphy PM, Baggiolini M, Charo IF, Hebert CA, Horuk R, Matsushima K, Miller LH, Oppenheim JJ, Power CA. International union of pharmacology.
XXII. Nomenclature for chemokine receptors. Pharmacol Rev 2002;52:145-76.
17. Dambach DM, Watson LM, Gray KR, Durham SK, Laskin DL. Role of CCR2
in macrophage migration into the liver during acetaminophen-induced
hepatotoxicity in the mouse. Hepatology 2002;35:1093-103.
18. Ohta M, Kitadai Y, Tanaka S, Yoshihara M, Yasui W, Mukaida N, Haruma K, Chayama K. Monocyte chemoattractant protein-1 expression correlates with macrophage infiltration and tumor vascularity in human gastric carcinomas.
Int J Oncol 2003;22:773-8.
19. Tang KF, Tan SY, Chan SH, Chong SM, Loh KS, Tan LK, Hu HA. A distinct expression of CC chemokines by macrophages in nasopharyngeal carcinoma:
implication for the intense tumor infiltration by T lymphocytes and macrophages. Hum Pathol 2001;32:42-9.
20. Wang H, Nemoto-Sasaki Y, Kondo T, Akiyama M, Mukaida N. Potential involvement of monocyte chemoattractant protein (MCP)-1/CCL2 in IL-4-mediated tumor immunity through inducing dendritic cell migration into the draining lymph nodes. Int Immunopharmacol 2003;3:627-42.
21. Graves DT, Jiang YL, Williamson MJ, Valente AJ. Identification of monocyte chemotactic activity produced by malignant cells. Science 1989;245:1490-3.
22. Marra F, Romanelli RG, Giannini C, Failli P, Pastacaldi S, Arrighi MC, Pinzani M, Laffi G, Montalto P, Gentilini P. Monocyte chemotactic protein-1 as a chemoattractant for human hepatic stellate cells. Hepatology 1999;29:140-8.
23. Kuziel WA, Morgan SJ, Dawson TC, Griffin S, Smithies O, Ley K, Maeda N.
Severe reduction in leukocyte adhesion and monocyte extravasation in mice deficient in CC chemokine receptor 2. Proc Natl Acad Sci USA 1997;94:12053-8.
24. Nishihori H, Tsuji H, Wang H, Tahara H, Akiyama M, Ogawa Y, Matsushima K, Iwakura Y, Mukaida N. Participation of endogenously produced IFN-γ in interleukin-4-mediated tumor rejection. Hum Gene Ther 2000;11(5):659-68.
25. Weiss J, Zimmermann F. Tribromoethanol (Avertin) as an anaesthetic in mice.
Lab Anim 1999;33:192-3.
26. Ohnishi Y, Fujii H, Murakami K, Sakamoto T, Tsukada K, Fujimaki M,
Kojima M, Saiki I. A new pseudo-peptide analogue of the Arg-Gly-Asp (RGD) sequence inhibits liver metastasis of colon 26-L5 carcinoma cells.
Cancer Lett 1998;124:157-63.
27. Pierce RH, Vail ME, Ralph L, Campbell JS, Fausto N. Bcl-2 expression inhibits liver carcinogenesis and delays the development of proliferating foci.
Am J Pathol 2002;160:1555-60.
28. Kitamura K, Nakamoto Y, Akiyama M, Fujii C, Kondo T, Kobayashi K, Kaneko S, Mukaida N. Pathogenic roles of tumor necrosis factor receptor p55-mediated signals in dimethylnitrosamine-induced murine liver fibrosis.
Lab Invest 2002;82:571-83.
29. Martin L, Green B, Renshaw C, Lowe D, Rudland P, Leinster SJ., Winstanley J. Examining the technique of angiogenesis assessment in invasive breast cancer. Brit J Cancer 1997;76:1046-54.
30. Kitakata H, Nemoto-Sasaki Y, Takahashi Y, Kondo T, Mai M, Mukaida N.
Essential roles of tumor necrosis factor receptor p55 in liver metastasis of intrasplenic administration of colon 26 cells. Cancer Res 2002;62:6682-7.
31. Schafer S, Zerbe O, Gressner AM. The synthesis of proteoglycans in fat-storing cells of rat liver. Hepatology 1987;7:680-7.
32. Leenen P, de Bruijn M, Voerman J, Campbell P, van Ewijk W. Markers of mouse macrophage development detected by monoclonal antibodies. J Immunol Methods 1994;174:5-19.
33. Carmeliet P, Jain RK. Angiogenesis in cancer and other diseases. Nature 2002;407:249-57.
34. Musso O, Theret N, Campion JP, Turlin B, Milani S, Grappone C, Clement B.
In situ detection of matrix metalloproteinase-2 (MMP2) and the metalloproteinase inhibitor TIMP2 transcripts in human primary hepatocellular carcinoma and in liver metastasis. J Hepatol 1997;26:593-605.
35. Theret N, Musso O, Turlin B, Lotrian D, Bioulac-Sage P, Campion JP,
Boudjema K, Clement B. Increased extracellular matrix remodeling is associated with tumor progression in human hepatocellular carcinomas.
Hepatology 2001;34:82-8.
36. Gressner AM. Cytokines and cellular crosstalk involved in the activation of fat-storing cells. J Hepatol 1995; 22 (2 Suppl): 28-36.
37. Curran S, Murray GI. Matrix metalloproteinases in tumour invasion and metastasis. J Pathol 1999;189:300-8.
38. Yancopoulos GD, Davis S, Gale NW, Rudge JS, Wiegand SJ, Holash J.
Vascular-specific growth factors and blood vessel formation. Nature 2000;407:242-8.
39. Yoshida S, Ono M, Shono T, Izumi H, Ishibashi T, Suzuki H, Kuwano M.
Involvement of interleukin-8, vascular endothelial growth factor, and basic fibroblast growth factor in tumor necrosis factor alpha-dependent angiogenesis. Mol Cell Biol 1997;17:4015-23.
40. Cao Y, Linden P, Shima D, Browne F, Folkman J. In vivo angiogenic activity and hypoxia induction of heterodimers of placenta growth factor/vascular endothelial growth factor. J Clin Invest 1996;98:2507-11.
41. Trusolino L, Comoglio PM. Scatter-factor and semaphorin receptors: cell signalling for invasive growth. Nat Rev Cancer 2002;2:289-300.
42. Eubank TD, Galloway M, Montague CM, Waldman WJ, Marsh CB. M-CSF induces vascular endothelial growth factor production and angiogenic activity from human monocytes. J Immunol 2003;171:2637-43.
43. Louie JS, Weiss J, Ryhanen L, Nies KM, Rantala-Ryhanen S, Uitto J. The production of collagenase by adherent mononuclear cells cultured from human peripheral blood. Arthritis Rheum 1984;27:1397-404.
44. Shapiro SD, Kobayashi DK, Pentland AP, Welgus HG. Induction of
macrophage metalloproteinases by extracellular matrix. Evidence for enzyme-
and substrate-specific responses involving prostaglandin-dependent
mechanisms. J Biol Chem 1993;268:8170-5.
45. Braunhut SJ, Moses MA. Retinoids modulate endothelial cell production of matrix-degrading proteases and tissue inhibitors of metalloproteinases (TIMP).
J Biol Chem 1994;269:13472-9.
46. Silletti S, Kessler T, Goldberg J, Boger DL. Cheresh DA. Disruption of matrix metalloproteinase 2 binding to integrin alpha vbeta 3 by an organic molecule inhibits angiogenesis and tumor growth in vivo. Proc Natl Acad Sci USA 2001;98:119-24.
47. Itoh T, Tanioka M, Yoshida H, Yoshioka T, Nishimoto H, Itohara S. Reduced angiogenesis and tumor progression in gelatinase A-deficient mice. Cancer Res 1998;58:1048-51.
48. Nakashima E, Mukaida N, Kubota Y, Kuno K, Yasumoto K, Ichimura F, Nakanishi I, Miyasaka M, Matsushima K. Human MCAF gene transfer enhances the metastatic capacity of a mouse cachectic adenocarcinoma cell line in vivo. Pharm Res1995;12:1598-604.
49. Weber KS, Nelson PJ, Grone HJ, Weber C. Expression of CCR2 by endothelial cells: implications for MCP-1 mediated wound injury repair and In vivo inflammatory activation of endothelium . Arterioscler Thromb Vasc Biol 1999;19:2085-93.
50. Salcedo R, Ponce ML, Young HA, Wasserman K, Ward JM, Kleinman HK, Oppenheim JJ, Murphy WJ. Human endothelial cells express CCR2 and respond to MCP-1: direct role of MCP-1 in angiogenesis and tumor progression. Blood 2000;96:34-40.
51. Mantovani A, Bottazzi B, Colotta F, Sozzani S, Ruco L. The origin and
function of tumor associated macrophages. Immunol Today 1992;13:265-70.
LEGENDS TO FIGURES
Figure 1 - Expression of CCR2 and its ligands in the liver. (a) RT-PCR analysis was performed on total RNA extracted from the livers of WT or CCR2 KO mice at the indicated time intervals after tumor cell injection as described in Material and Methods. RT-PCR analyses were performed, and representative results from 6 individual experiments are shown here. (b ) The ratios of chemokines and chemokine receptors to β-actin of the tumor-injected mice were calculated by designating the ratio of untreated WT mice as 1.0 and shown with SEM (n = 6). A statistical analysis failed to detect significant differences between WT and CCR KO mice at each time point. (c) Immunohistochemical analysis of CCL2 proteins and CCR2-positive cells. Immunohistochemical analysis was performed inside tumor foci ( c-i to c-v ) and in the sinusoids of tumor-free areas (c-vi ) of liver tissues of WT mice 10 days (c-i, ii, iii, v and vi ) and 14 days (c-iv) after tumor cell injection using rabbit anti-mouse CCL2 (c-i to c-iv ) or goat anti-mouse CCR2 antibodies( c-v and c-vi). Representative results from at least 6 individual animals in each group are shown. Original magnification, ×400 (c-i to c-v ) and × 1000 (c-vi ). Scale bars are 50 μm. ( d) The numbers of CCL2-positive cells inside tumor areas was enumerated and the cell density was determined on five randomly chosen tumor areas in WT (closed bars) and CCR2 KO mice (open bars) at the indicated time intervals after tumor injection (n = 6).
A statistical analysis failed to detect significant differences between WT and CCR KO mice at each time point. ( e) Time course of CCL2 protein contents in liver homogenate after colon 26 injection. All values and bars represent the mean and SEM calculated on the results from 6 individual animals, respectively.
**, p<0.01.
Figure 2 - Accumulation of macrophages inside tumor foci. (a)
Immunohistochemical analysis using F4/80 antibody was performed on liver tissues obtained from WT (upper panels) and CCR2 KO mice (lower panels) at the indicated time intervals after tumor cell injection. Representative results from 6 animals in each group are shown here. Original magnification, ×200. Scale bar, 50 μm. Original magnification of the insets, ×400. (b) The number of F4/80-positive cells was enumerated and the cell density was determined on five randomly chosen tumor areas in WT (closed bars) and CCR2 KO mice (open bars), or non-tumor areas in WT (dotted bars) and CCR2 KO mice (striped bars) at the indicated time intervals after tumor injection (n = 6). All values and bars represent the mean and SEM calculated on the results from 6 individual animals, respectively. **, p<0.01.
Figure 3 - Intratumoral αSMA-positive cell density. ( a to d).
Immunohistochemical analysis using anti- αSMA mAb was performed on liver tissues obtained from WT mice (a and c) and CCR2 KO mice (b and d) at 10 days (a and b) and 14 days after the tumor injection (c and d) as described in Material and Methods. Representative results from 6 individual animals in each group are shown here. Original magnification, ×400. Scale bar, 50μ m. (e) The densities of intratumoral αSMA-positive areas in WT mice (closed bars) and CCR2 KO mice (open bars) were determined as described in Material and Methods. All values and bars represent the mean and SEM calculated on the results from 6 individual animals, respectively. *, p<0.05.
Figure 4 - Immunohistochemical detection of neovascularization inside metastasis foci. (a to d) Immunostaining with anti-CD34 antibody was performed on liver obtained from WT mice ( a and c) and CCR2 KO mice (b and d) at 10 days (a and b) and 14 days (c and d) after tumor cell injection.
Representative results from 6 individual animals in each group are shown here.
Original magnification, ×400. Scale bar, 50μ m. (e) Intratumoral microvessel density (IMVD) in WT (closed bars) and CCR2 KO mice (open bars) were determined as described in Material and Methods. All values and bars represent the mean and SEM calculated on the results from 6 individual animals, respectively. *, p<0.05.
Figure 5 - Gene expression of angiogenic factors and MMPs. (a) RT-PCR analysis was performed on total RNAs extracted from the livers of WT and CCR2 KO mice at the indicated time intervals after the tumor injection as described in Material and Methods. RT-PCR analyses were performed, and representative results from 6 individual experiments are shown. ( b) The ratios of these factors to β-actin of the tumor-injected mice were calculated by designating the ratio of untreated WT mice as 1.0 and shown with SEM (n = 6).
Figure 6 - Identification of MMP2-expressing cells by double-color immunofluorescence analyses. Liver tissues of WT ( a and upper panel of b) and CCR2 KO mice (b, lower panel) were obtained 14 days after tumor cell injection.
Double-color immuofluorescence analyses were performed using the combination of anti-MMP2 and anti-F4/80 antibodies (a) or anti-MMP2 and anti-α SMA antibodies (b). Immunoreactive MMP2 were visualized individually in Cy3 (red), while either F4/80 or α SMA antigens were envisioned in FITC (green). Images were digitally merged. Representative results from six individual animals are shown here. Original magnification, ×200 ( a); ×400 (b, c ). Scale bar, 50 μm.
Figure 7- Identification of CCR2-expressing cells. Liver tissues of WT mice
were obtained 14 days after tumor cell injection. ( a, b) Double-color
immuofluorescence analyses were performed using the combination of anti-CCR2
and anti-F4/80 antibodies ( a) or anti-CCR2 and anti-αSMA antibodies (b)
Immunoreactive CCR2 were visualized individually in i (Cy3, red) while either F4/80 or αSMA antigens were envisioned in ii (FITC, green). Images were digitally merged in iii. Representative results from three individual animals are shown here. Original magnification, × 400. Scale bar, 50 μm. ( c) RT-PCR analysis was performed for CCR2 gene expression in hepatic stellate cells isolated from untreated WT mice as described in Material and Methods. HSC, hepatic stellate cell; MNC, spleen mononuclear cells served as a positive control;
No-RT, without reverse transcription, served as a negative control.
Table I - The sequences of the primers and the conditions used for RT-PCR analysis
Sense primer Antisense primer Cy cles Product
(bp)
Gene Bank Accession
number CCL2 A A G C C A G C T C T C TC T TC C T C C C T C TC TC T T G A G C T TG G T G 3 2 2 4 7 N M 0 11 3 3 3 CCL7 C A A G A A A C A A A A G AT C C C C A A G G A AT TC T G C A G C TA A C A C A AT G 3 2 4 5 2 N M 0 1 3 6 5 4 CCL12 A G G TC C C T G TC AT G C T T C T G T C T GG A C C C AT TC C T TC T T G 3 2 2 3 0 N M 0 11 3 3 1
CCR2 VEGF bFGF PlGF HGF flt-1 flk-1 MMP2 MMP9 MMP13 TIMP-1 TIMP-2
A G A GG T C TC G G TT G G G T T G T C T GC T G TAC C TC C AC C AT G C C A A G T
A C A C G TC A A A C TA C A A C TC C A C C C AC AC C C A GC TC A C G TAT T TA
G C T TG G C ATC C A C G AT G T TC T TA G G G GG T T C T C C ATA C C C C AG C T TC C A A G TG G C TAA G G G A G T T GG C A G T GC A ATAC C T A G T T T G G T G T C G C G G A G C A C C T GG T C T TC T G GC AC AC G C T C T GG C ATC C T C T T G T T GC TA A G A C G TA G T G ATC A G AG C C A
AT C ATA AC G T TC T G G GC AC C C T G C A A G TA C G T T C G T T TA A C T C A
T C A G C TC T TA GC A G A C AT T G G T C C C C T C TA C AT G C C TT C A AT G C
C C C TC AC AT G G TC C TG AT C C TATC T TC AT G G A G G C C T T G G C ATA AT G GA AT T T GG G G TC G G C C AT C C T TC TC A A A GT T G T TAC AT GA G C G C T T C C G GC AC G C A G C G C TC A G TC TC T T C A C A G G G ATC TC C A A G T GC AC A A G TA C C AC G C GC A A GA A C C AT
3 2 3 5 3 5 3 5 3 5 3 5 3 5 3 5 3 5 3 5 3 5
3 7 6 5 0 9 2 9 5 3 8 7 3 7 2 5 3 1 6 2 0 6 6 6 7 5 4 6 1 0 5 8 3
3 5 4 9 0
N M 0 0 9 9 1 5 N M 0 0 9 5 0 5 N M 0 0 8 0 0 6 X 8 0 1 7 1 N M 0 1 0 4 2 7 N M 0 1 0 2 2 8 X 7 0 8 4 2 N M 0 0 8 6 1 0 N M 0 1 3 5 9 9 N M 0 0 8 6 0 7 N M 0 11 5 9 3
N M 0 11 5 9 4 β-actin T G T G AT GG T G G GA AT G G G T C A G T T T G AT G TC A C G C A C G AT TT C C 2 5 5 1 4 N M 0 0 7 3 9 3
Abbreviation used in Table I. VEGF, vascular endothelial growth factor; bFGF,
basic fibroblast growth factor; PlGF, placental growth factor; HGF, hepatocyte
growth factor; flt-1, FMS-like tyrosine kinase 1/VEGF receptor 2; flk-1, fetal
liver kinase, protein-tyrosine kinase receptor/VEGF receptor 1
Genoty pe Day s after injection
No of mice
Incidence Liver weight
(g)
Liver to body weight
ratio (%)
Macroscopic foci numbers
Foci numbers per cm2 , 1
% tissue involved
WT
CCR2 KO
WT
CCR2 KO
10
10
14
14
17
14
17
16
16/17
14/14
15/17
15/16
1.30± 0.010 1.26± 0.014 3.51± 0.061 2.01± 0.049**
6.13± 0.046 5.74± 0.041 16.74±
0.30 8.85± 0.20**
35.54± 2.16 30.29±
1.86 ND
ND
12.20± 1.53 11. 03±
2.29 45.79±
1.90 16.82±
1.15*
2.75± 0.20 1.52±
0.19 48.50±
2.42 12.48±
1.08**
Table II - Tumor formation in WT and CCR2 KO mice. WT and CCR2 KO mice were sacrificed at the indicated time intervals after tumor cell injection to determine the incidence of liver tumors, the liver weight, the liver to body weight ratio, the numbers of tumor foci in the liver, the foci number per cm
2and % tissue involved by tumor as described in Material and Methods. All the parameters were determined in mice, which developed liver tumor foci. Each value represents mean ± SEM. *, p<0.001; **, p<0.0001 compared between WT and CCR2 KO mice at the same time points. ND, not determined due to difficulties in macroscopical separation of individual tumors.
1