The Roles of Introgression and Climate Change in the Rise to Dominance of Acropora Corals
Author Yafei Mao, Evan P. Economo, Noriyuki Satoh journal or
publication title
Current Biology
volume 28
number 21
page range 3373‑3382.e5
year 2018‑11‑05
Publisher Elsevier Ltd
Rights (C) 2018 The Author(s).
Author's flag publisher
URL http://id.nii.ac.jp/1394/00000843/
doi: info:doi/10.1016/j.cub.2018.08.061
Creative Commons?
Attribution‑NonCommercial‑NoDerivatives 4.0 International (https://creativecommons.org/licenses/by‑nc‑nd/4.0/)
Article
The Roles of Introgression and Climate Change in the Rise to Dominance of Acropora Corals
Graphical Abstract
Highlights
d
Identification of introgression with genomic evidence in corals
d
Population expansion coincides with mass extinction of corals
d
The importance of ecological opportunity in the rise to dominance of Acropora corals
d
The evolutionary history of Acropora shaped by introgression and climate change
Authors
Yafei Mao, Evan P. Economo, Noriyuki Satoh
Correspondence
[email protected] (Y.M.), [email protected] (E.P.E.), [email protected] (N.S.)
In Brief
Mao et al. show that a major introgression event as well as recurrent gene flow across Acropora coral species and Acropora lineages profited from climate- driven mass extinctions in the Plio- Pleistocene, indicating that introgression and ecological opportunity (from climate- driven mass extinction) play important roles in the adaptive radiation of Acropora.
Mao et al., 2018, Current Biology28, 3373–3382
November 5, 2018ª2018 The Author(s). Published by Elsevier Ltd.
https://doi.org/10.1016/j.cub.2018.08.061
Current Biology
Article
The Roles of Introgression and Climate Change in the Rise to Dominance of Acropora Corals
Yafei Mao,1,2,3,*Evan P. Economo,2,*and Noriyuki Satoh1,*
1Marine Genomics Unit, Okinawa Institute of Science and Technology Graduate University, Onna, Okinawa 904-0495, Japan
2Biodiversity and Biocomplexity Unit, Okinawa Institute of Science and Technology Graduate University, Onna, Okinawa 904-0495, Japan
3Lead Contact
*Correspondence:[email protected](Y.M.),[email protected](E.P.E.),[email protected](N.S.) https://doi.org/10.1016/j.cub.2018.08.061
SUMMARY
Reef-building corals provide the structural basis for one of Earth’s most spectacular and diverse—
but increasingly threatened—ecosystems. Modern Indo-Pacific reefs are dominated by species of the staghorn coral genus Acropora , but the evolutionary and ecological factors associated with their diversifi- cation and rise to dominance are unclear. Recent work on evolutionary radiations has demonstrated the importance of introgression and ecological op- portunity in promoting diversification and ecological success. Here, we analyze the genomes of five staghorn coral species to examine the roles of intro- gression and ecological opportunity in the rise to dominance of Acropora. We found evidence for a his- tory marked by a major introgression event as well as recurrent gene flow across species. In addition, we found that genes with topologies mismatching the species tree are evolving faster, which is suggestive of a role for introgression in spreading adaptive genetic variation. Demographic analysis showed that Acropora lineages profited from climate-driven mass extinctions in the Plio-Pleistocene, indicating that Acropora exploited ecological opportunity opened by a new climatic regime favoring species that could cope with rapid sea-level changes. Collec- tively, the genomes of reef-building corals have recorded an evolutionary history shaped by intro- gression and climate change, suggesting that Acropora—among most vulnerable corals to stressors—may be critical for understanding how reefs track the impending rapid sea-level changes of the Anthropocene.
INTRODUCTION
Reef-building corals support one of the most productive and diverse ecosystems on the planet, but they are increasingly threatened due to global climate change and other Anthropo- genic stressors [1, 2]. Modern Indo-Pacific reefs are dominated by species of the staghorn coral genusAcropora (Anthozoa:
Acroporidae), one of the most diverse coral genera with close
to 150 species [3–5], but the evolutionary and ecological factors associated with their diversification and rise to dominance are unclear. Understanding those factors provides critical context for evaluating the resilience of theAcropora, and thus reef eco- systems as a whole, to the ongoing global changes of the Anthropocene.
Recent work on evolutionary radiations across a wide range of both animal and plant taxa has demonstrated the impor- tance of introgression and ecological opportunity in promoting diversification and ecological success [6, 7]. Introgression can promote diversification by generating the genotypic and phenotypic variance necessary for natural selection and adap- tation and can facilitate the spread of favorable alleles across species [7, 8]. Given the complexity of morphological variation in corals, problems with resolving phylogenetic relationships, and other evidence, the idea that introgression is important for coral evolution has long been suspected and debated [3, 9–12]. Previous population studies found evidence for gene flow between different ‘‘species’’ in corals [13, 14]. In addition, the incongruence between the species trees and single/
multiple gene trees suggested introgression in different line- ages ofAcropora[3, 15, 16]. Yet, distinguishing introgression from incomplete lineage sorting (ILS) is challenging in corals [17, 18].
Ecological opportunity, the ‘‘wealth of evolutionarily acces- sible resources little used by competing taxa’’ [19], provides a favorable selective environment for diversification. There are several ways to trigger an evolutionary radiation via ecological opportunity [20–22]: colonization of a new area, mass extinction, and evolution of a key innovation. In particular, mass extinction can remove dominant taxa and generate new resources and/or niches for the species that persist [21, 22]. In the Plio-Pleisto- cene, seawater temperature and sea level change periodically with the glacial-interglacial cycle initiated by the northern hemi- sphere glaciation (NHG) around 2.75 million years ago (mya) [23, 24]. The fossil record shows that mass extinctions of near- shore marine organisms occurred around 23 mya, probably due to the onset of the NHG in Plio-Pleistocene, generating massive empty niches [25–27]. Interestingly, theAcroporafossils have been found in coral hotspots from the Eocene to the present [28, 29]; however, it became one of the dominant reef components after the onset of the NHG [4, 28, 30]. This pattern has led some to suggest that the massive empty niches created by the onset of the NHG-induced mass extinctions provided ecological opportunity for the rise of Acropora to dominant status [4, 31].
Current Biology28, 3373–3382, November 5, 2018ª2018 The Author(s). Published by Elsevier Ltd. 3373
Here, using the genomes of five reef-building coral species, we investigate the roles of introgression and ecological opportu- nity in the rise to dominance of the genusAcropora. We first use phylogenomic and coalescent hidden Markov model ap- proaches to test for the presence and nature of introgression in coral evolution. Second, we examine demographic changes in the coral lineages in the Plio-Pleistocene and evaluate whether coral expanded to fill ecological opportunity caused by major shifts in glacial cycles (Figure S1).
RESULTS
Clustering of Gene Families and Reconstruction of Species Tree
Our group decoded the genome ofA. digitifera as first coral genome (422 Mb, 28,280 gene models) [1] and more recently have further characterized the genomes ofA. tenuis(408 Mb, 26,445 gene models), A. gemmifera (407 Mb, 30,776 gene models),A. subglabra (432 Mb, 30,922 gene models), and A. echinata (411 Mb, 28,958 gene models) (http://
marinegenomics.oist.jp/;Method Details;Data S1). Based on adult morphological similarity [3, 5],A. tenuisbelongs to a spe- cies group named the A. selago group, A. digitifera and A. gemmifera are categorized into the A. humilis group, and
A. subglabraandA. echinatabelong to theA. echinatagroup (Figure 1A). Previous analyses of molecular phylogeny of Acroporaspecies were carried on comparison of rDNA and/or mitochondrial gene sequences or SNP data [3, 15, 16, 32]. We here performed phylogenomic analyses using full genome se- quences of the five species.
Orthologous and paralogous genes were identified across all the five species, and the five species shared 7,494 gene families, which accounted for 66.89% of predicted proteins (58,887 out of 88,030) (Date S1). EachAcroporagenome had very few unique gene families, suggesting that they were closely related to each other (Figure 1B). Our gene family cluster analysis showed that 1,215 gene families were shared in theA. gemmiferaand A. subglabraspecies pair, a much higher number of specifically shared gene families in this species pair compared with any other species pairs, suggesting that they might have a closer ge- netic relationship (Figure 1B). Phylogenomic tree reconstruction based on a concatenated alignment of 4,954 single-copy orthologs found an identical fully resolved topology with both maximum likelihood (ML) and Bayesian methods, in which sister taxa were not from the same morphological species group, indicating morphological convergence. Morphological conver- gence is also observed in previous studies [3, 15, 16] (Figures 1C andS2).
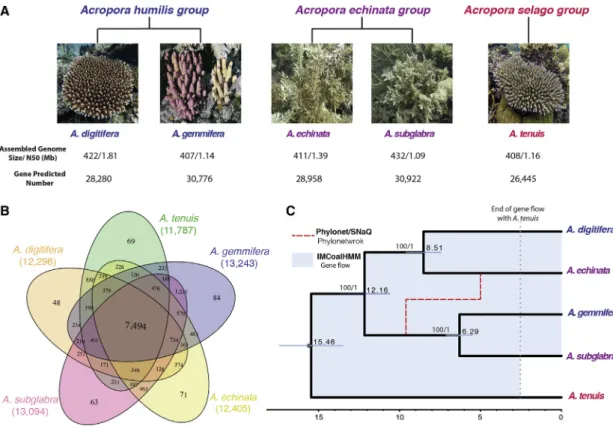
Figure 1. The Evolutionary History ofAcroporaInferred from Five Genomes
(A) Adult morphology of fiveAcroporaspecies annotated by species group and genome statistics (photos ofAcroporaprovided by Dr. Zayasu).
(B) Venn diagram of shared and unique gene families in fiveAcroporaspecies.
(C) Fossil-calibrated phylogenetic tree inferred with 3,361 single-copy orthologs with BEAST2 (black). Phylonetwork analysis inferred a single major introgression event between the stem branch ofA. gemmifera/A. subglabraand the lineage leading toA. echinata(red dashed line). In addition to this major introgression event, IMCoalHMM inferred background gene flow among all pairs of lineages marked in the blue shade. The gene flow betweenA. tenuisand the other lineages ended 2.5 mya (gray dotted line). See alsoFigure S2.
Introgression Identified inAcroporawith Phylogenomic and Comparative Genomic Evidence
We used phylonetwork theory to test for major introgression events in the history of these five lineages, an approach that has been used in concert with coalescent theory to distinguish introgression from ILS [17]. We reconstructed gene trees for each of the 4,954 single-copy orthologs with ML and Bayesian methods, respectively (Data S1). Of those, half (49%) had a gene-tree topology identical to the whole-genome phylogeny, 14% of the loci had a secondary topology, while the remaining 37% loci were distributed across the remaining topologies (Fig- ure 2A). We used Bayesian concordance analysis as a first indi- cator of possible introgression, although this alone does not distinguish introgression from other sources of gene-tree discor- dance (e.g., ILS). We found that the concordance factor in the clade ofA. digitiferaandA. echinatawas less than 0.8, suggest- ing that the incongruence might be caused by introgression [33, 34] (Figure S3). However, in order to clearly distinguish introgres- sion from incomplete lineage sorting, we used the gene trees to infer reticulate evolution with the phylogenetic network ML and pseudo-ML methods based on PhyloNet and SNaQ, respec- tively [17, 18] (Method Details). Both analyses consistently in- ferred a phylonetwork with a single reticulation between the branch ofA. gemmifera/A. subglabraandA. echinata, indicating that introgression occurred in Acropora (Figures 2B and 2C;
Table S1). Specifically, the result showed that a substantial minority of the genetic material composing the lineage A. echinata(20.3% inferred by PhyloNet, 13.8% by SNaQ) is derived from introgression from the branch leading to A. gemmifera/A. subglabra. We additionally tested whether non-species-tree genes were clustered in the genome and found that they were not significantly clustered (Method Details).
The ABBA-BABA test has been widely applied to non-model organisms for detection of introgression on genomic-wide level based on SNP patterns [35]. We performed the ABBA-BABA
A
B C
Figure 2. A Major Introgression Event In- ferred by Phylonetwork
(A) The five most common gene-tree topologies inferred with MrBayes. The frequency of each topology was scored across 4,954 single-copy orthologous gene trees inferred with MrBayes with BUCKy.
(B) Phylonetwork inferred by SNaQ. The phylo- network was inferred from quartet concordance factors (CFs) estimated by BUCKy. Proportions of the introgressed genome (g) are shown in the hybrid branch.
(C). Phylonetwork inferred by Phylonet. The phy- lonetwork with highest likelihood inferred from 4,643 rooted maximum likelihood (ML) trees setting the reticulation number to 1. The proportion of the genome introgressed (g) is shown on the hybrid branch. See alsoFigure S3andTable S1.
test to confirm the introgression detected by the phylonetwork approach.A. tenuis was chosen as the outgroup because its placement as the most distal species showed a high degree of concordance among gene trees, suggesting that A. tenuis and other four Acropora lineages have been genetically isolated for some time. We found significantly different numbers of ABBA and BABA patterns when we tested whether introgression occurred fromA. gemmiferaorA. subglabratoA. echinata(Z =5.15, Z =5.37), indicating that introgression had occurred among A. gemmifera, A. subglabra, and A. echinata (Table 1). In contrast, when we tested whether introgression occurred from A. echinata or A. digitifera to the clade of A. gemmifera/
A. subglabra, we did not detect any signal of introgression (Table 1). Therefore, the ABBA-BABA test was consistent with the phylonetwork analysis illustrating one major introgression event between the branch of A. gemmifera/A. subglabra and A. echinata(Figure 1C). Taken together, results of the Bayesian concordance analysis, phylogenetic network ML, pseudo-ML, and ABBA-BABA tests all inferred evidence for a single major reticulation event between the branch of A. gemmifera/
A. subglabraandA. echinata(Figures 1C,2B, 2C, andS3;Ta- bles 1andS1).
The phylonetwork/ABBA-BABA analysis identified one major introgression event in the history of these five species, but those methods are better suited to inferring major episodes of introgression rather than low-level, recurrent migration among lineages [18, 36], as would be expected under the syngameon hypothesis [5, 12, 16]. Our gene trees analysis showed that 37% of gene trees’ topologies match neither the species-tree topology nor the topology consistent with the inferred introgres- sion event (Figure 2A). We hypothesized that this is due to recurrent gene flow after speciation betweenAcroporaspecies, which under the syngameon hypothesis, could facilitate adapta- tion of different morphologies and ecologies [3, 5, 7]. The coales- cent hidden Markov model (IMCoalHMM) approach can infer speciation with gene flow between related species pairs [36].
We applied whole-genome alignments of each species pair to a speciation-with-isolation model and a speciation-with-
migration model and then compared them with Akaike informa- tion criterion (AIC). We found that whole-genome alignments of each pair of Acropora species were better explained by the speciation-with-migration than the speciation-with-isolation model (Figure 3;Table S2). In addition, we estimated that the gene flow between A. tenuis and other four species ceased around 2.5 mya and that the species pairs among the other four species ceased at present (Figure 3). In all, we found the ma- jor introgression event and recurrent gene flow among the five Acroporaspecies.
Evolutionary Rates and Patterns of Selection
Since introgression has apparently occurred, it raises the ques- tion of what role the transfer of genetic material may play in coral evolution. We hypothesized that if introgression were involved with adaptive evolution, loci that are involved in introgression should be evolving faster than those that are not. To test this, we compared evolutionary rates in genes that matched the spe- cies tree (species-tree genes), with those that have a different to- pology (non-species-tree genes). Although a discordant gene tree is not in itself definitive evidence of introgression for a given locus (due to other explanations such as ILS), on the whole, genes involved with introgression should be highly overrepre- sented in this discordant group compared to the group matching the species tree.
We found elevated rates of evolution among the non-species- tree genes and the major introgression topology genes relative to species-tree genes in the three lineages involved with the major introgression event (A. gemmifera/A. tenuis, A. subglabra/A.
tenuis, andA. echinata/A. tenuisbut notA. digitifera/A.tenuis) (p < 0.001, Mann-Whitney test,Figures 4A–4D andS4;Method Details). The fact that rates of evolution were higher in both the donor and recipient lineages is consistent with several scenarios:
(1) there was a period of rapid evolution of some loci localized in time to the branch before the major introgression event, and these loci were more likely to be transferred during the introgres- sion event; (2) there are some genes that are generally prone to rapid evolution both before and after the major introgression event, and these were more likely to be transferred during the major introgression event; or (3) a subset of genes could have evolved faster independently in the different lineages after the major introgression event, and these were more likely to be transferred during the introgression event even though it happened before the accelerated evolution. We performed two tests to distinguish between these scenarios by testing for accel- erated evolution on different branches individually. First, we compared evolutionary rates among branches for the loci with the major introgression topology (Figure S5A) and found that rates were higher on the branch before the introgression event compared with the branches after the event (p < 0.001, Mann- Whitney test). Second, we compared evolutionary rates in the major-introgression-topology genes to species-tree genes and found that the major introgression topology genes were evolving faster than species-tree genes before the major introgression event (Figure S4; p < 0.001, Mann-Whitney test) but not after (Figures S5B and S5C; p = 0.155 in A. subglabra, p = 0.042 in A. gemmifera). We interpret this to support the scenario whereby a period of enhanced selection happened before the Table 1. Statistics of ABBA-BABA Test
H1 H2 H3 (Hybrid candidate) nABBA nBABA Z
A.echinata A.digitifera A.gemmifera 333,782 342,525 5.1467
A.echinata A.digitifera A.subglabra 334,935 343,984 5.3674
A.gemmifera A.subglabra A.echinata 280,690 280,863 0.1152
A.gemmifera A.subglabra A.digitifera 284,045 285,194 0.7861
Figure 3. Syngameon Hypothesis Sup- ported by IMCoalHMM
Results of speciation with migration model inferred with IMCoalHMM. For each species pair, horizon- tal lines indicate divergence time (inferred through phylogenomic analysis), and boxes denote distri- bution of the end of migration over. All pairs inferred migration until essentially the present, except pairs includingA. tenuismarked with a red box. Error bars reflect SEM with n = 10 replicates.
See alsoTable S2.
introgression event, and the loci under selection were more likely to be transferred to the new lineage (Method Details).
We performed Gene Ontology (GO) analysis to examine whether there are any functional differences between species- tree genes and non-species-tree genes. We found that ontol- ogies, including G-protein-coupled receptors, binding proteins, and transporters in relation to DNA replication, oxidation-reduc- tion reaction, cell apoptosis, and iron and amino acid transporta- tion, are significantly more likely to have topologies that do not match the species tree (Table S3). We also identified30 (out of 1,539) of the non-species-tree genes that are under positive selection (dN/dS > 1) (Tables S4 and S5) [37]. The non-spe- cies-tree genes were more likely to be under positive selection (33 out of 1,539) compared to species-tree genes (42 out of 3,361) (c2test: p < 0.025).
Demography Associated with Global Climate Change In part due to the phylogenetic difficulties introduced by incon- gruent loci, it has been a challenge to infer the timescale of
Acropora evolution using molecular data, with average crown ages ranging from 6 to 36 mya in previous studies [15, 32]. Using subsets of loci with gene trees that match the dominant species- tree topology, we inferred a crown age of these five species at 15 mya, with the remaining splits in the tree occurring before 6 mya (Method Details) (Figures 1C andS6).
Using the timescale ofAcroporaevolution established by the phylogenomic analysis, we evaluated demographic changes in Acropora lineages and linked them to Earth’s geologic history. We estimated the average mutation rate ofAcropora as 2.9 3 108 per site per generation (Method Details), and then the demographic history was respectively simulated with each local density of heterozygotes using the pairwise sequen- tially Markovian coalescent (PSMC) model [38]. The PSMC analysis showed the five species’ demographic histories from 4 mya to 10 ka (thousand years ago) (Figure S7). Generally, the five species had similar demographic histories with a population expansion from 2 mya and then decline after 900 ka during the Mid-Pleistocene Transition ([MPT]; 0.75–1.25 mya)
A B
D C
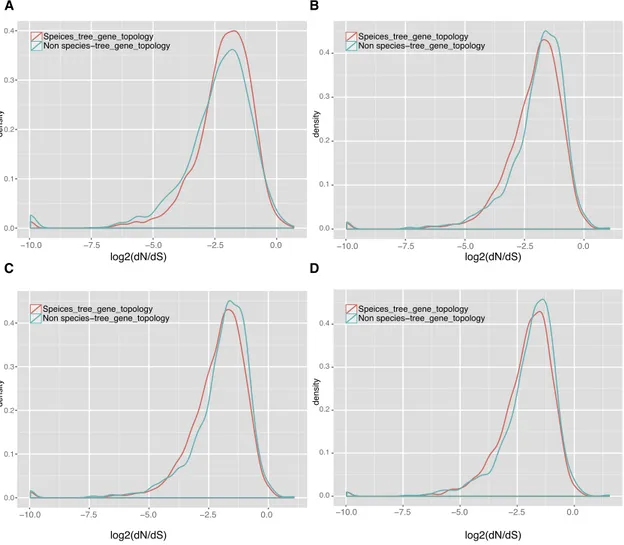
Figure 4. Evolutionary Rates of Species-Tree and Non-species-tree Genes
(A–D) Distributions of dN/dS value of the 4,954 single-copy orthologs matching the species-tree topology (3,361 single-copy orthologs) or not matching the species-tree topology (1,593 single-copy orthologs) in (A)A. digitifera, (B)A. echinata, (C)A. gemmifera, and (D)A. subglabra. Non-species-tree genes evolved significantly faster than species-tree genes (p < 0.001, Mann-Whitney test) in all lineages exceptA. digitifera, which was not involved with the major introgression event. See alsoFigures S4andS5.
(Figure 5). The MPT in particular—a period where the amplitude of glaciation-driven sea-level oscillations increased dramatically [39]—has been identified as a period of local extinction in corals [40].
DISCUSSION
The staghorn corals of the genusAcropora, one of the most diverse coral genera with close to 150 species [3, 4], constitute the foundation of modern coral reef ecosystems, but much work remains to reconstruct their evolutionary history and iden- tify the processes shaping their rise to dominance. Understand- ing the latter is critical for anticipating coral responses to the ongoing multifaceted changes of the Anthropocene [2, 4, 41].
Toward that end, the present analysis of the genomes of five Acroporaspecies addresses two long-standing issues in coral evolution: the roles of introgression and climate-driven ecolog- ical opportunity in shaping their histories and rise to dominance.
This study is, to our knowledge, the first to demonstrate genome-scale evidence of introgression in coral evolution using phylogenomic and comparative genomic methods to distinguish introgression from ILS, supporting previous hypotheses [3, 11, 12, 15]. Beyond the major introgression we detected, we also showed that the small gene flow existed after speciation. The reason why we only detected one major introgression event is that small gene flow has lower resolution to be inferred by the phylonetwork method as a major introgression event [18, 36].
In addition, our phylogenomic analysis indicates that the clus- tering of adult morphology conflicts with the phylogenetic analysis, which has also been shown in the previous studies [3, 16]. This conflict between morphological and genetic relation- ships suggests the occurrence of introgression and/or morpho- logical convergence in these five species, but there is still much work needed to focus on the mechanisms of the conflict by
Figure 5. Demographic History ofAcropora Lineages
(A) Sea-level changes in the past 5 Ma indicated with the onset of northern hemisphere glaciation ([NHG]; dashed line) and the Mid-Pleistocene Transition ([MPT]; gray shade). The onset of NHG and ensuing sea-level fluctuation are associated with mass extinction in the fossil record.
(B) Demographic history inference of fiveAcropora species. Effective population size (Ne) over time were estimated from patterns of heterozygosity with generation time (g = 5) and average neutral mutation rate per generation (m= 2.9310–8) for each species using the pairwise sequentially Markovian coalescent (PSMC) model. See also Figure S6.
convergent evolution and/or adaptive introgression with more taxon sampling [42, 43].
Previous studies have shown that intro- gression promotes diversification in other groups of organisms [6, 7]. For example, two color loci (B/D, N/Yb) have been sug- gested to play a crucial role in mimicry of Heliconius[42]. Our evolutionary rates analyses are consistent with an adaptive role of gene flow in Acropora, although the evidence presented here is far from definitive. The major introgression event apparently occurred after a period of rapid evolution during which the genes involved with introgression were—on average—evolving at faster rates than other genes.
This implies that mutations in the donor lineage retained a selec- tive advantage after arriving in the recipient lineage. However, we cannot rule out that some other unmodeled evolutionary process, such as convergent molecular evolution or gene con- version, is contributing to misleading inferences about adaptive evolution. Thus, while these results are suggestive of an adaptive role of introgression, further work investigating this issue in more detail, and from different perspectives, is necessary to confirm the result and understand the precise mechanisms of how intro- gression may contribute to the adaptive evolution of corals.
After accounting for lack of congruence introduced by intro- gression, we inferred the age of the common ancestor of extant Acropora (using only non-introgressed loci) to be within the Miocene (95% highest posterior density [HPD]:
13.517.4 million years [Ma]). This set a timescale forAcropora evolution that we applied to the demographic analysis for testing ecological opportunity in Acropora. Although the five species diverged over 15 mya, they all show relatively similar demo- graphic expansion and contraction in the last 3 Ma. The fossil record shows that mass extinctions of nearshore marine organ- isms occurred around 23 Ma, probably due to onset of the northern hemisphere glaciation in Plio-Pleistocene, resulting in massive empty niches [25, 26, 31], and the timing of the demo- graphic expansion broadly coincides with predictions of the hypothesis that glaciation-driven mass extinction opened niche space forAcropora, which could better cope with rapid sea-level changes since the onset of northern hemisphere glaciation (Fig- ure 5). On the other hand, the reasons for the demographic
decline of all five lineages since the MPT are more enigmatic, but it could be indicative of increased niche-filling and competition due to either radiation of new Acropora lineages or the recovery of other coral lineages as they adapt to more rapid sea-level changes and increase in abundance [4, 15]. Notably, the demographic history ofAcropora, the dominant coral of the Indo-Pacific, is remarkably similar to the demographic pattern recently inferred in species of stony corals in the Caribbean [31] and matches broader dynamics inferred from the fossil re- cord [4]. This implies that the demographic expansion of certain coral species following a glaciation-driven mass extinction was a generalized global event and not limited to a single taxonomic group or region. This shaped the composition of the surviving reef communities, preferentially favoring rapidly dispersing and growing groups such asAcropora.
We do acknowledge the possibility that gene flow (or popula- tion structure) could in principle have an influence in representing Nechange of a single lineage with PSMC [44–47]. As far as we know, there are no methods that fully account for hybridization in the calculation of demographic history that could be applied to our data, and such analyses are commonly used in the presence of hybridization in other studies [48, 49]. However, we do not believe this to be the most likely explanation for the patterns in our data for the following reasons. First, the basic pattern we found—increase to a peak during the MPT followed by decline—was in both the different putative ‘‘syngaemon’’
groups, includingA. tenuisin one and the rest of the species in the other. Second, different lineages have different levels of introgression—for example,A. echinatais the recipient of the major introgression event, but all show a similar demographic pattern. Third, a previous population-level analysis on A. millepora, which was limited to the past 500 Ky for methodo- logical reasons, matched the demographic results from PSMC [44]. Thus, while we cannot completely rule out a role of hybrid- ization in the demographic analysis, it seems unlikely such an effect would cause the analyses to be biased in a way that matches our specific a priori predictions based on previous studies.
If the recent dominance of the staghorn corals and other species with similar life histories can be attributed to their abil-
Figure 6. A Hypothetical Evolutionary Model ofAcroporaBased on Results of Our Study and Previous Research
Tree topologies in purple, blue, and red represent gene flow with speciation since Miocene, enabling syngameon groups inAcropora, and the horizontal black line represents the gene flow barrier between synameon groups. Light purple dotted line repre- sents the mass extinction in Plio-Pleistocene that enabled an ecological opportunity for the diversi- fication and rise to dominance ofAcropora. The orange shade represents period time of MPT and gray shades represent the unknown population size. The width of blue shade represent the popu- lation size estimated in this study.
ity to cope with the rapid sea-level changes of the Plio-Pleistocene, it is tempting to reason that modern reefs should be well suited to keep up with the climate-driven rapid sea-level changes of the Anthropocene. However, if reefs need fast dispersers and rapid growers to keep up with sea- level changes, this apparent strength could prove to be an ecosystem-level weakness. Many taxa with life histories adapted for fast growth and high dispersal rates are more vulnerable to stressors including disease, predators, and environmental perturbations [50, 51]. Indeed, among the corals, Acropora are known to have relatively fast growth rates and are among the most sensitive to common Anthropo- cene disturbances—for example, they are very prone to bleaching [4, 51, 52]. Their global diminishment would undermine the ability of coral reef communities to keep up with rapid sea-level changes and further threaten the persistence of ecosystems critical for two-thirds of marine species [26].
In all, our comparative genomic analyses provide insights into the mechanisms involved in the evolution and ecological dominance of Acropora. We found that modern Acropora has diversified since the Miocene and that this history has been marked by both major introgression events and recur- rent gene flow within networks of species. The extant species are grouped into at least two reciprocally isolated networks (one including A. tenuis and one including the other four species in this study). In addition, Acropora capitalized on ecological opportunity opened by rapid sea-level changes in Plio-Pleistocene (Figure 6). In classic model systems such as African Great Lake cichlids and Gala´pagos finches, rapid radiation was facilitated by ancient introgression and ecolog- ical opportunity (from colonization of a new habitat) [8, 43, 53].
Our study suggests that introgression and ecological opportu- nity (from climate-driven mass extinction) play important roles in the adaptive radiation of Acropora as well. Further work from a variety of perspectives is needed to unravel the detailed roles and mechanisms of how introgression and ecological opportunity shaped the evolutionary history of Acropora. This evolutionary history provides critical context for evaluating the resilience ofAcropora, and thus reef eco- systems as a whole, to the ongoing global changes of the Anthropocene.
STAR+METHODS
Detailed methods are provided in the online version of this paper and include the following:
d KEY RESOURCES TABLE
d CONTACT FOR REAGENT AND RESOURCE SHARING
d EXPERIMENTAL MODEL AND SUBJECT DETAILS
d METHOD DETAILS
B Genomic data and phylogenetic tree reconstruction B Phylonetwork inference
B Genome-wide Patterson’s D statistics B Speciation modeling using IMCoalHMM B Demography history reconstruction using PSMC B Genome evolution analysis
B Testing for clustering of introgression genes B Gene ontology
d QUANTIFICATION AND STATISTICAL ANALYSIS
d DATA AND SOFTWARE AVAILABILITY SUPPLEMENTAL INFORMATION
Supplemental Information includes seven figures, five tables, and one data file and can be found with this article online athttps://doi.org/10.1016/j.cub.2018.
08.061.
ACKNOWLEDGMENTS
We thank Dr. Chuya Shinzato for providing the genomic data. We thank Dr.
Yuna Zayasu for providing the coral photos and Prof. E. J. Rohling for providing the original sea-level change data. This study was supported by OIST funding to the Marine Genomics Unit and was funded by JSPS grants (17J00557 to Y.M., 17K15180 to E.P.E.).
AUTHOR CONTRIBUTIONS
Y.M., E.P.E., and N.S. conceived the research. E.P.E. and N.S. supervised the project. Y.M. analyzed the data. Y.M., N.S., and E.P.E. wrote the paper.
DECLARATION OF INTERESTS
The authors declare no competing interests.
Received: May 15, 2018 Revised: August 2, 2018 Accepted: August 29, 2018 Published: October 18, 2018 REFERENCES
1.Shinzato, C., Shoguchi, E., Kawashima, T., Hamada, M., Hisata, K., Tanaka, M., Fujie, M., Fujiwara, M., Koyanagi, R., Ikuta, T., et al. (2011).
Using the Acropora digitifera genome to understand coral responses to environmental change. Nature476, 320–323.
2.Ainsworth, T.D., Heron, S.F., Ortiz, J.C., Mumby, P.J., Grech, A., Ogawa, D., Eakin, C.M., and Leggat, W. (2016). Climate change disables coral bleaching protection on the Great Barrier Reef. Science352, 338–342.
3.van Oppen, M.J., McDonald, B.J., Willis, B., and Miller, D.J. (2001). The evolutionary history of the coral genusAcropora(Scleractinia, Cnidaria) based on a mitochondrial and a nuclear marker: reticulation, incomplete lineage sorting, or morphological convergence? Mol. Biol. Evol. 18, 1315–1329.
4.Renema, W., Pandolfi, J.M., Kiessling, W., Bosellini, F.R., Klaus, J.S., Korpanty, C., Rosen, B.R., Santodomingo, N., Wallace, C.C., Webster,
J.M., and Johnson, K.G. (2016). Are coral reefs victims of their own past success? Sci. Adv.2, e1500850.
5.Wallace, C. (1999). Staghorn corals of the world: a revision of the genus Acropora(CSIRO publishing).
6.Berner, D., and Salzburger, W. (2015). The genomics of organismal diver- sification illuminated by adaptive radiations. Trends Genet.31, 491–499.
7.Seehausen, O. (2004). Hybridization and adaptive radiation. Trends Ecol.
Evol.19, 198–207.
8.Meier, J.I., Marques, D.A., Mwaiko, S., Wagner, C.E., Excoffier, L., and Seehausen, O. (2017). Ancient hybridization fuels rapid cichlid fish adap- tive radiations. Nat. Commun.8, 14363.
9.Veron, J.E.N. (1995). Corals in space and time: the biogeography and evo- lution of the Scleractinia (Cornell University Press).
10.Vollmer, S.V., and Palumbi, S.R. (2002). Hybridization and the evolution of reef coral diversity. Science296, 2023–2025.
11.Willis, B.L., Van Oppen, M.J.H., Miller, D.J., Vollmer, S.V., and Ayre, D.J.
(2006). The role of hybridization in the evolution of reef corals. Annu.
Rev. Ecol. Evol. Syst.37, 489–517.
12.Richards, Z.T., and Hobbs, J.P.A. (2015). Hybridisation on coral reefs and the conservation of evolutionary novelty. Curr. Zool.61, 132–145.
13.Ladner, J.T., and Palumbi, S.R. (2012). Extensive sympatry, cryptic diver- sity and introgression throughout the geographic distribution of two coral species complexes. Mol. Ecol.21, 2224–2238.
14.Shinzato, C., Mungpakdee, S., Arakaki, N., and Satoh, N. (2015). Genome- wide SNP analysis explains coral diversity and recovery in the Ryukyu Archipelago. Sci. Rep.5, 18211.
15.Richards, Z.T., Miller, D.J., and Wallace, C.C. (2013). Molecular phyloge- netics of geographically restricted Acropora species: implications for threatened species conservation. Mol. Phylogenet. Evol.69, 837–851.
16.Rosser, N.L., Thomas, L., Stankowski, S., Richards, Z.T., Kennington, W.J., and Johnson, M.S. (2017). Phylogenomics provides new insight into evolutionary relationships and genealogical discordance in the reef- building coral genusAcropora. Proc Biol Sci.284, 20162182.
17.Yu, Y., Dong, J., Liu, K.J., and Nakhleh, L. (2014). Maximum likelihood inference of reticulate evolutionary histories. Proc. Natl. Acad. Sci. USA 111, 16448–16453.
18.Solı´s-Lemus, C., and Ane, C. (2016). Inferring Phylogenetic Networks with Maximum Pseudolikelihood under Incomplete Lineage Sorting. PLoS Genet.12, e1005896.
19.Schluter, D. (2000). The ecology of adaptive radiation (OUP Oxford).
20.Losos, J.B. (2010). Adaptive radiation, ecological opportunity, and evolu- tionary determinism. American Society of Naturalists E. O. Wilson award address. Am. Nat.175, 623–639.
21.Stroud, J.T., and Losos, J.B. (2016). Ecological Opportunity and Adaptive Radiation. Annu. Rev. Ecol. Evol. Syst.47, 507–532.
22.Yoder, J.B., Clancey, E., Des Roches, S., Eastman, J.M., Gentry, L., Godsoe, W., Hagey, T.J., Jochimsen, D., Oswald, B.P., Robertson, J., et al. (2010). Ecological opportunity and the origin of adaptive radiations.
J. Evol. Biol.23, 1581–1596.
23.Rohling, E.J., Foster, G.L., Grant, K.M., Marino, G., Roberts, A.P., Tamisiea, M.E., and Williams, F. (2014). Sea-level and deep-sea-temper- ature variability over the past 5.3 million years. Nature508, 477–482.
24.Herbert, T.D., Peterson, L.C., Lawrence, K.T., and Liu, Z. (2010). Tropical ocean temperatures over the past 3.5 million years. Science328, 1530–
1534.
25.O’Dea, A., Jackson, J.B.C., Fortunato, H., Smith, J.T., D’Croz, L., Johnson, K.G., and Todd, J.A. (2007). Environmental change preceded Caribbean extinction by 2 million years. Proc. Natl. Acad. Sci. USA104, 5501–5506.
26.Pimiento, C., Griffin, J.N., Clements, C.F., Silvestro, D., Varela, S., Uhen, M.D., and Jaramillo, C. (2017). The Pliocene marine megafauna extinction and its impact on functional diversity. Nat Ecol Evol.1, 1100–1106.
27. Talluto, M.V., Boulangeat, I., Vissault, S., Thuiller, W., and Gravel, D.
(2017). Extinction debt and colonization credit delay range shifts of eastern North American trees. Nat Ecol Evol.1,https://doi.org/10.1038/s41559- 017-0182.
28.Renema, W., Bellwood, D.R., Braga, J.C., Bromfield, K., Hall, R., Johnson, K.G., Lunt, P., Meyer, C.P., McMonagle, L.B., Morley, R.J., et al. (2008).
Hopping hotspots: global shifts in marine biodiversity. Science 321, 654–657.
29.Wallace, C.C., and Rosen, B.R. (2006). Diverse staghorn corals (Acropora) in high-latitude Eocene assemblages: implications for the evolution of modern diversity patterns of reef corals. Proc. Biol. Sci.273, 975–982.
30.Wallace, C.C. (2012). Acroporidae of the Caribbean. Geologica Belgica.
15, 388–393.
31.Prada, C., Hanna, B., Budd, A.F., Woodley, C.M., Schmutz, J., Grimwood, J., Iglesias-Prieto, R., Pandolfi, J.M., Levitan, D., Johnson, K.G., et al.
(2016). Empty Niches after Extinctions Increase Population Sizes of Modern Corals. Curr. Biol.26, 3190–3194.
32.van Oppen, M.J., Catmull, J., McDonald, B.J., Hislop, N.R., Hagerman, P.J., and Miller, D.J. (2002). The mitochondrial genome of Acropora tenuis (Cnidaria; Scleractinia) contains a large group I intron and a candidate con- trol region. J. Mol. Evol.55, 1–13.
33.Cui, R., Schumer, M., Kruesi, K., Walter, R., Andolfatto, P., and Rosenthal, G.G. (2013). Phylogenomics reveals extensive reticulate evolution in Xiphophorus fishes. Evolution67, 2166–2179.
34.Larget, B.R., Kotha, S.K., Dewey, C.N., and Ane, C. (2010). BUCKy: gene tree/species tree reconciliation with Bayesian concordance analysis.
Bioinformatics26, 2910–2911.
35.Durand, E.Y., Patterson, N., Reich, D., and Slatkin, M. (2011). Testing for ancient admixture between closely related populations. Mol. Biol. Evol.
28, 2239–2252.
36.Mailund, T., Halager, A.E., Westergaard, M., Dutheil, J.Y., Munch, K., Andersen, L.N., Lunter, G., Pru¨fer, K., Scally, A., Hobolth, A., and Schierup, M.H. (2012). A new isolation with migration model along com- plete genomes infers very different divergence processes among closely related great ape species. PLoS Genet.8, e1003125.
37.Barshis, D.J., Ladner, J.T., Oliver, T.A., Seneca, F.O., Traylor-Knowles, N., and Palumbi, S.R. (2013). Genomic basis for coral resilience to climate change. Proc. Natl. Acad. Sci. USA110, 1387–1392.
38.Li, H., and Durbin, R. (2011). Inference of human population history from individual whole-genome sequences. Nature475, 493–496.
39.Elderfield, H., Ferretti, P., Greaves, M., Crowhurst, S., McCave, I.N., Hodell, D., and Piotrowski, A.M. (2012). Evolution of ocean temperature and ice volume through the mid-Pleistocene climate transition. Science 337, 704–709.
40.Getty, S.R., Asmerom, Y., Quinn, T.M., and Budd, A.F. (2001). Accelerated Pleistocene coral extinctions in the Caribbean Basin shown by uranium- lead (U-Pb) dating. Geology29, 639–642.
41.Hughes, T.P., Kerry, J.T., A´lvarez-Noriega, M., A´lvarez-Romero, J.G., Anderson, K.D., Baird, A.H., Babcock, R.C., Beger, M., Bellwood, D.R., Berkelmans, R., et al. (2017). Global warming and recurrent mass bleach- ing of corals. Nature543, 373–377.
42.Heliconius Genome, C.; Heliconius Genome Consortium (2012). Butterfly genome reveals promiscuous exchange of mimicry adaptations among species. Nature487, 94–98.
43.Lamichhaney, S., Berglund, J., Almen, M.S., Maqbool, K., Grabherr, M., Martinez-Barrio, A., Promerova´, M., Rubin, C.J., Wang, C., Zamani, N., et al. (2015). Evolution of Darwin’s finches and their beaks revealed by genome sequencing. Nature518, 371–375.
44.Matz, M.V., Treml, E.A., Aglyamova, G.V., and Bay, L.K. (2018). Potential and limits for rapid genetic adaptation to warming in a Great Barrier Reef coral. PLoS Genet.14, e1007220.
45.Mazet, O., Rodrı´guez, W., and Chikhi, L. (2015). Demographic inference using genetic data from a single individual: Separating population size variation from population structure. Theor. Popul. Biol.104, 46–58.
46.Mazet, O., Rodrı´guez, W., Grusea, S., Boitard, S., and Chikhi, L. (2016). On the importance of being structured: instantaneous coalescence rates and human evolution–lessons for ancestral population size inference? Heredity (Edinb)116, 362–371.
47.Hawks, J. (2017). Introgression Makes Waves in Inferred Histories of Effective Population Size. Hum. Biol.89, 67–80.
48.Foote, A.D., Vijay, N., A´vila-Arcos, M.C., Baird, R.W., Durban, J.W., Fumagalli, M., Gibbs, R.A., Hanson, M.B., Korneliussen, T.S., Martin, M.D., et al. (2016). Genome-culture coevolution promotes rapid diver- gence of killer whale ecotypes. Nat. Commun.7, 11693.
49.A´rnason, U´ ., Lammers, F., Kumar, V., Nilsson, M.A., and Janke, A. (2018).
Whole-genome sequencing of the blue whale and other rorquals finds sig- natures for introgressive gene flow. Science Advances4, eaap9873.
50.Kittel, T.G.F. (2013). The Vulnerability of Biodiversity to Rapid Climate Change. In Climate Vulnerability: Understanding and Addressing Threats to Essential Resources, R.A. Pielke, ed. (Academic Press), pp. 185–201.
51.Darling, E.S., Alvarez-Filip, L., Oliver, T.A., McClanahan, T.R., Coˆte, I.M., and Bellwood, D. (2012). Evaluating life-history strategies of reef corals from species traits. Ecol. Lett.15, 1378–1386.
52.Goreau, T.F., and Goreau, N.I. (1959). The physiology of skeleton forma- tion in corals. II. Calcium deposition by hermatypic corals under various conditions in the reef. Biol. Bull.117, 239–250.
53.Wagner, C.E., Harmon, L.J., and Seehausen, O. (2012). Ecological oppor- tunity and sexual selection together predict adaptive radiation. Nature 487, 366–369.
54.Bhattacharya, D., Agrawal, S., Aranda, M., Baumgarten, S., Belcaid, M., Drake, J.L., Erwin, D., Foret, S., Gates, R.D., Gruber, D.F., et al. (2016).
Comparative genomics explains the evolutionary success of reef-forming corals. eLife5, e13288.
55.Li, L., Stoeckert, C.J., Jr., and Roos, D.S. (2003). OrthoMCL: identification of ortholog groups for eukaryotic genomes. Genome Res.13, 2178–2189.
56.Boratyn, G.M., Camacho, C., Cooper, P.S., Coulouris, G., Fong, A., Ma, N., Madden, T.L., Matten, W.T., McGinnis, S.D., Merezhuk, Y., et al.
(2013). BLAST: a more efficient report with usability improvements.
Nucleic Acids Res.41, W29–W33.
57.Katoh, K., Misawa, K., Kuma, K., and Miyata, T. (2002). MAFFT: a novel method for rapid multiple sequence alignment based on fast Fourier trans- form. Nucleic Acids Res.30, 3059–3066.
58.Abascal, F., Zardoya, R., and Telford, M.J. (2010). TranslatorX: multiple alignment of nucleotide sequences guided by amino acid translations.
Nucleic Acids Res.38, W7–W13.
59.Stamatakis, A. (2014). RAxML version 8: a tool for phylogenetic analysis and post-analysis of large phylogenies. Bioinformatics30, 1312–1313.
60.Ronquist, F., Teslenko, M., van der Mark, P., Ayres, D.L., Darling, A., Ho¨hna, S., Larget, B., Liu, L., Suchard, M.A., and Huelsenbeck, J.P.
(2012). MrBayes 3.2: efficient Bayesian phylogenetic inference and model choice across a large model space. Syst. Biol.61, 539–542.
61.Bouckaert, R., Heled, J., Ku¨hnert, D., Vaughan, T., Wu, C.-H., Xie, D., Suchard, M.A., Rambaut, A., and Drummond, A.J. (2014). BEAST 2: a soft- ware platform for Bayesian evolutionary analysis. PLoS Comput. Biol.10, e1003537.
62. Li, H. (2013). Aligning sequence reads, clone sequences and assembly contigs with BWA-MEM. arXiv, arXiv:1303.3997,https://arxiv.org/abs/
1303.3997.
63.Li, H., Handsaker, B., Wysoker, A., Fennell, T., Ruan, J., Homer, N., Marth, G., Abecasis, G., and Durbin, R.; 1000 Genome Project Data Processing Subgroup (2009). The Sequence Alignment/Map format and SAMtools.
Bioinformatics25, 2078–2079.
64.McKenna, A., Hanna, M., Banks, E., Sivachenko, A., Cibulskis, K., Kernytsky, A., Garimella, K., Altshuler, D., Gabriel, S., Daly, M., and DePristo, M.A. (2010). The Genome Analysis Toolkit: a MapReduce frame- work for analyzing next-generation DNA sequencing data. Genome Res.
20, 1297–1303.
65.Korneliussen, T.S., Albrechtsen, A., and Nielsen, R. (2014). ANGSD:
Analysis of Next Generation Sequencing Data. BMC Bioinformatics15, 356.
66.Harris, R.S. (2007). Improved pairwise alignment of genomic DNA (The Pennsylvania State University).
67.Yang, Z. (2007). PAML 4: phylogenetic analysis by maximum likelihood.
Mol. Biol. Evol.24, 1586–1591.
68.R Development Core Team (2013). R: A language and environment for sta- tistical computing (R Foundation for Statistical Computing).
69.Zdobnov, E.M., and Apweiler, R. (2001). InterProScan–an integration plat- form for the signature-recognition methods in InterPro. Bioinformatics17, 847–848.
70.Huang, W., Sherman, B.T., and Lempicki, R.A. (2009). Systematic and integrative analysis of large gene lists using DAVID bioinformatics re- sources. Nat. Protoc.4, 44–57.
71.Kajitani, R., Toshimoto, K., Noguchi, H., Toyoda, A., Ogura, Y., Okuno, M., Yabana, M., Harada, M., Nagayasu, E., Maruyama, H., et al. (2014).
Efficient de novo assembly of highly heterozygous genomes from whole-genome shotgun short reads. Genome Res.24, 1384–1395.
72.Simakov, O., Kawashima, T., Marletaz, F., Jenkins, J., Koyanagi, R., Mitros, T., Hisata, K., Bredeson, J., Shoguchi, E., Gyoja, F., et al. (2015).
Hemichordate genomes and deuterostome origins. Nature527, 459–465.
73.Zhao, S., Zheng, P., Dong, S., Zhan, X., Wu, Q., Guo, X., Hu, Y., He, W., Zhang, S., Fan, W., et al. (2013). Whole-genome sequencing of giant pandas provides insights into demographic history and local adaptation.
Nat. Genet.45, 67–71.
74.Hemond, E.M., and Vollmer, S.V. (2010). Genetic diversity and connectiv- ity in the threatened staghorn coral (Acropora cervicornis) in Florida. PLoS ONE5, e8652.
STAR + METHODS
KEY RESOURCES TABLE
CONTACT FOR REAGENT AND RESOURCE SHARING
Further information and requests may be directed to, and will be fulfilled by the Lead Contact, Yafei Mao ([email protected]).
EXPERIMENTAL MODEL AND SUBJECT DETAILS
Corals (A. digitifera,A. tenuis,A. gemmifera,A. echinataandA. subglabra) were sampled from Okinawa, Japan. All genomic data were downloaded fromhttp://marinegenomics.oist.jp/andhttp://reefgenomics.org/.
REAGENT or RESOURCE SOURCE IDENTIFIER
Deposited Data
The genome ofA. digitifera, [1] http://marinegenomics.oist.jp
The genome ofA. tenuis Marine genomic browser in OIST http://marinegenomics.oist.jp The genome ofA. gemmifera Marine genomic browser in OIST http://marinegenomics.oist.jp The genome ofA. echinata Marine genomic browser in OIST http://marinegenomics.oist.jp The genome ofA. subglabra Marine genomic browser in OIST http://marinegenomics.oist.jp The protein and CDS sequences
ofOrbicella. faveolata
[54] http://reefgenomics.org/
The protein and CDS sequences ofPorites. lobata
[54] http://reefgenomics.org/
The protein and CDS sequences ofPorites. australiensis
[54] http://reefgenomics.org/
The protein and CDS sequences ofPorites. astreoides
[54] http://reefgenomics.org/
Software and Algorithms
OrthoMCL [55] http://orthomcl.org/orthomcl/
BLAST [56] https://blast.ncbi.nlm.nih.gov/Blast.cgi?
CMD=Web&PAGE_TYPE=BlastDocs&DOC_
TYPE=Download
MAFFT [57] https://mafft.cbrc.jp/alignment/software/
TranslatorX [58] https://translatorx.org/
RAxML [59] https://sco.h-its.org/exelixis/web/software/raxml/
MrBayes [60] http://mrbayes.sourceforge.net/
BEAST2 [61] http://www.beast2.org/
PhyloNet [17] https://bioinfocs.rice.edu/phylonet
SNaQ [18] https://github.com/crsl4/PhyloNetworks.jl
BWA-MEM [62] https://github.com/lh3/bwa
SAMtools [63] http://samtools.sourceforge.net/
GATK [64] https://software.broadinstitute.org/gatk/
ANGSD [65] http://www.popgen.dk/angsd/index.php/ANGSD
LASTZ [66] https://www.bx.psu.edu/rsharris/lastz/
PAML4 [67] http://abacus.gene.ucl.ac.uk/software.html
R [68] https://www.r-project.org/
InterProScan [69] https://www.ebi.ac.uk/interpro/
DAVID [70] https://david.ncifcrf.gov/tools.jsp
METHOD DETAILS
Genomic data and phylogenetic tree reconstruction
Coral samples (A. digitifera, A. tenuis, A. gemmifera, A. echinata and A. subglabra) were collected from Okinawa, Japan and the sperms of each single colony from each species were used to isolate high-molecular weight DNAs in order to remove Symbiodinium as descried in a previous study [1]. PCR-free shotgun libraries of each species were prepared for genome sequencing with HiSeq 2500 in Rapid mode (Illumina). 127, 77, 64, 59 and 64 Gbp raw reads was generated forA. digitifera, A. tenuis, A. gemmifera, A. echi- nata, andA. subglabra, respectively. Based on K-mer estimation of genome size using the cleaned Illumina sequence reads, the genome sizes ofA. digitifera, A. tenuis, A. gemmifera, A. echinata,andA. subglabrawere estimated as 411, 409, 406, 409 and 441 Mbp, respectively, suggesting that each of genomes had high sequence coverage for genome assembly (SeeData S1). With Platanus assembler [71], we assembled genome sizes ofA. digitifera, A. tenuis, A. gemmifera, A. echinata, andA. subglabraas 422, 408, 407, 411, 432 Mbp, respectively, with good scaffold N50 value showing that we carried out a good draft genome assembly for each species (SeeData S1). Then, we performed genome annotations of each species withde novomethods based on repeats- masked genomes. As a result, 28,280 genes were predicted forA. digitifera, 28,958 forA. echinata, 30,776 forA. gemmifera, 30,922 forA. subglabra, and 26,445 forA. tenuis, respectively. The genomic data forAcropora, and more detail is available fromhttp://
marinegenomics.oist.jpandData S1.
We combined the predicted proteins of each species together and used Blastp [56] (2.2.30+) to do all-against-all Blast. Then, OrthoMCL was used with the default settings to cluster homologous proteins into 16,885 gene families [55]. We used a custom script to select 4,954 single-copy orthologous gene families, in which only one gene copy is included in each species.
Gene tree reconstruction
We used MAFFT [57] to align the amino acid sequences of each single-copy orthologs. We aligned coding sequences with TranslatorX based on amino acid alignments and we excluded the single-copy orthologous genes containing ambiguous ‘N’ [58].
PartitionFinder was used to find the best substitution model for RAxML (Version 8.2.2) [59] and MrBayes (Version 3.2.3) [60], and gene trees for all 4,954 loci were reconstructed using both programs. For each reconstruction of gene trees, we used same settings below:
RAxML:
f a -# autoMRE -m GTRGAMMA -q %s.pat -s %s -p 12345 -x 28754 -n %s Mrbayes:
unlink Tratio = (all) Revmat = (all) Statefreq = (all) Shape = (all) Pinvar = (all);
prset applyto = (all) ratepr = variable;
mcmcp ngen = 50000000 nchain = 4 relburnin = yes burninfrac = 0.25
printfreq = 50000 samplefreq = 10000 savebrlens = yes Stoprule = yes Stopval = 0.01;
Phylogenomic tree reconstruction
Alignments of 4,954 gene families’ coding sequences were concatenated into 10,547,082 bp total. The concatenated sequences were used to reconstruct the phylogenomic tree with RAxML and MrBayes under a GTR+CAT+I model or a GTR+G+I model, respec- tively. As well, we applied -autoMRE to generate bootstrap in RAxML and we run MrBayes with setting: ngen = 100000000 relburnin = yes burninfrac = 0.25 printfreq = 50000 samplefreq = 10000 savebrlens = yes Stoprule = yes Stopval = 0.01. The phylogenomic tree was regarded as the species tree ofAcropora.
Species tree dating
In order to infer the divergence time ofAcropora and set the timescale of Acropora evolution, we selected 817 single-copy orthologous genes among fiveAcroporaand two outgroups,Orbicella(Orbicella. faveolata) andPorites (Porites. lobata; Porites. aus- traliensis and Porites. astreoides), using OrthoMCL and transcriptome data ofOrbicellaandPorites[54]. Then, we selected 3,361 genes with gene trees that were concordant with the species tree (((A. gemmifera,A. subgrabla), (A. echinata,A. digitifera)), A. tenuis). We blasted the 817 single-copy orthologous genes to the 3,361 genes (((A. gemmifera,A. subgrabla), (A. echinata, A. digitifera)),A. tenuis), and found 440 single-copy orthologous genes that are shared between all taxa and have gene trees that match the species tree. We concatenated these sequences and used them to infer a time-calibrated phylogeny. First, we partitioned the concatenated coding sequences by codon position. Molecular clock and trees, but not substitution model, were linked across partitions. Then, divergence time was estimated using the HKY substitution model, relaxed lognormal clock model, and calibrated Yule prior with the divergence time in previous study:OrbicellaandPoritessplit 153 mya splitPoritesandAcroporasplit at 84 mya [61, 72]. We ran BEAST2 three times independently, 50 million Markov chain Monte Carlo (MCMC) generations for each run, then we used Tracer to check the log files and we found that ESS of each of parameters were greater than 200. We chose the highest likelihood tree generated by BEAST2 to present in this study showing the crown age of these fiveAcroporaspecies to be approx- imately 15.6 mya (95% highest posterior density (HPD): 15.3915.87 Ma). Finally, after inferring the crown age, we used a larger dataset to infer the divergence times for nodes within theAcroporaclade. For this, we concatenated the 3,361 single-copy orthol- ogous genes with gene trees matching the species tree topology, and used them for a BEAST2 analysis with setting as above, and calibrating the the crown age to 15.46 Ma.
Phylonetwork inference
Bayesian concordance analysis using BUCKy
We used BUCKy (1.4.4) to summarize concordance among gene trees generated by MrBayes, by reconstructing the primary concor- dance tree and to estimating concordance factors (CFs) with default setting [34] (alpha = 1).
Phylonetwork inferrence from gene trees using Phylonet and SNaQ
We selected 4,643 Maximum likelihood (ML) trees with bootstrap support values greater than 50. Each of the trees was rooted with A. tenuis, and used to infer the phylonetwork first with the PhyloNet ML method [17]. Reticulation parameters of 0, 1, 2, 3 were applied and run 10 times each. PhyloNet includes AIC, AICc and BIC, and a cross validation method to compare models of increasing complexity (i.e., more reticulation events). Following the original study introducing the method [17], we give priority to the cross-vali- dation method if it prefers fewer reticulations even if there are small gains in AIC or BIC from adding more reticulations (See alsoTable S1). The cross-validation was implemented using the built-in function (phylonet_ML_CV), setting set the maximum reticulate nodes = 2. We ran 100 runs, of which 61 runs finished successfully. 58 of the 61 runs inferred an optimal network with reticulate node = 1 and 3 over the 61 runs found an optimal network with reticulate node = 0, moreover, the globally highest likelihood network was a run with reticulation = 1. Finally, we then repeated the analysis 100 further times with reticulation parameter set to 1 and found the same topology was inferred consistently. BIC was consistent with the cross-validation method in favoring reticulations = 1, while AIC showed small improvements for an additional reticulation. Due to the greater accuracy of the cross-validation method [17] and agreement with BIC, we consider the phylonetwork with a single reticulation to be the most robust result.
As an additional test, quartet CFs estimated by BUCKy were used to infer the phylonetwork with SNaQ [18]. The concatenated phylogenomic tree was used as the initial tree to infer phylonetwork of reticulation equal to 0 and then the result of tree was then used to infer phylonetwork with reticulation equal to 1 and so on. The phylonetwork with the reticulation equal to 1 was the only topology inferred by SNaQ under different reticulation settings.
Genome-wide Patterson’s D statistics
TheA. tenuisgenome was used as the reference for mapping shotgun reads from the other four species using BWA with default settings [62]. Further, PICARD was used to mask duplications. Then, Samtools was used to index and sort Bam files [63], while Genome Analysis Toolkit (GATK) was used for insertion/deletion realignment [64]. ANGSD was used to perform Genome-wide ABBA-BABA tests with quality control ‘‘base quality > 30, mapping quality >60, minimum depth (summing all 4 samples) > 80 and maximum depth (summing all 4 samples) < 600’’ (-doAbbababa 1 -blockSize 3000000 -anc Aten.fa -doCounts 1 -minQ 30 -minMapQ 60 -P 24 -setMinDepth 80 -setMaxDepth 600) [65]. The whole genome alignments of commands were shown below:
bwa mem -R ‘@RGytID:H277GBCXX:1ytSM:ytLB:ytPL:illumina1’ -t 24 Aten.fa .R1.trimmed .R2.trimmed > .sam samtools view -bS .sam -o .bam
samtools fixmate -O bam .bam _fixmate.bam rm .sam
samtools sort -@ 24 -O bam -o _sorted.bam -T /tmp/_temp _fixmate.bam rm _fixmate.bam
java -jar picard-tools-2.1.0/picard.jar MarkDuplicates INPUT = _sorted.bam OUTPUT = _DM_sorted.bam METRICS_FILE = .bam.metrics
samtools index _DM_sorted.bam
java -jar GenomeAnalysisTK.jar -T RealignerTargetCreator -nt 24 -R Aten.fa -I _DM_sorted.bam -o _realignment_targets.list java -jar GenomeAnalysisTK.jar -T IndelRealigner -R Aten.fa -I _DM_sorted.bam -targetIntervals _realignment_targets.list -o _realigned_reads.bam
samtools index _realigned_reads.bam
Speciation modeling using IMCoalHMM Genome alignments
Shotgun reads of each species were mapped toA. tenuisassembled genomes as described above to generate BAM file. Then, the consensus sequence of each species was generated by Samtools with settings: mapping quality greater than 50, reads quality greater than 30, and read coverage greater than 10. The consensus sequences of each species on the same scaffolds of A. tenuiswere considered as whole genome alignments. We selected 238 scaffolds, of which length are greater than 50 Kb, to make pairwise alignments of each species and then these were used in subsequent analysis.
Speciation with isolation and speciation with migration modeling
For each pair of taxa, we fit the speciation with isolation model and speciation with migration model respectively using IMCoalHMM [36]. We generated 10 bootstrap samples for each pair by sampling with replacement 238 scaffolds from original 238, and we ran both the speciation-with-migration and speciation-with isolation models on each bootstrap samples.
We calculated AIC values for the speciation-with-isolation model and speciation-with-migration model, then, we estimated the delta AIC (delta AIC = speciation with isolation AIC (IAIC) - speciation with migration AIC (IMAIC)) (See alsoTable S2). The values less than 1 of delta AIC represented the speciation with isolation model was better otherwise the speciation with migration was better.
For isolation period and migration periods parameters estimation under the speciation with migration model, we assumed that we have already known the divergent time between each pair from the our time-calibrated phylogenomic tree and calculate them as below:
tua_splitting_period = tua1_isolation_period+tua_migration_period T_siplitting_age = substitution rate* tua_splitting_period
T1_isoaltion_time = substitution rate* tua1_isolation_period = (T_siplitting_age/ tua_splitting_period)* tua1_isolation_period
Demography history reconstruction using PSMC Mutation rate estimation
First, we aligned four species’ shotgun data toA.tenuisusing LASTZ with setting [66] (–seed = 12of19–notransition–chain–gapped–
inner = 2000–ydrop = 3400–gappedthresh = 6000–hspthresh = 2200–strand = plus–format = axt). We removed all the gap sites and ambiguous ‘N’ sites. Then, we calculated the number of consensus sequences and divergent sequences. The mutation rate was calculated as the formula:m= (counts of divergent loci / (counts of divergent loci+ counts of consensus loci)) / (2*divergence time)*(generation time) [73].
ForA. gemmifera: (76154410/(76154410+351440506)/(2315.5)) x 53106= 2.873108 ForA. echinata: (67411262/(67411262+318366635)/(2315.5)) x 53106= 2.823108 ForA. subgrabla: (78384122/(78384122+372773032)/(2315.5)) x 53106= 2.803108 ForA. digitifera:(79427941/(79427942+363368171)/(2315.5)) x 53106= 2.893108 Average: (2.873108+2.823108+2.803108+2.893108)/4 = 2.93108
Demographic history reconstruction
Shotgun reads of each species were mapped to their own assembled genomes as described above to generate BAM files. Then the consensus sequence of each species was generated by Samtools with settings: mapping quality greater than 50 and reads quality greater than 30. The demographic history of each species was reconstructed using the PSMC model with settings [38] (-N25 -t15 -r5 -p ‘‘4+25*2+4+6’’). The neutral mutation rate was estimated using the divergent time and sequence divergence estimated by the LASTZ as described above [66]. Generation time was assumed to be 5 years for each species [44, 74]. Bootstrapping of demographic inference was generated for each of species following previous study [73].
samtools mpileup -q 50 -Q 30 -uf .fa _realigned_reads.bamjbcftools call -cjperl vcfutils.pl vcf2fq -d 16 -D 96jgzip > .fq.gz fq2psmcfa -q20 .fq.gz > .psmcfa
psmc -N25 -t15 -r5 -p ‘‘4+25*2+4+6’’ -o .psmc .psmcfa psmc2history.pl .psmc
perl utils/psmc_plot.pl -g 5 -u 3e-8 _out .psmc utils/splitfa .psmcfa > _split.psmcfa
seq 100jxargs -i echo psmc -N25 -t15 -r5 -b -p ‘‘4+25*2+4+6’’ -o _round-{}.psmc _split.psmcfajsh cat .psmc _round-*.psmc > _combined.psmc
psmc_plot.pl -p -g 5 -u 2.9e-8 _combined _combined.psmc
Genome evolution analysis
As our findings support that there is no gene flow betweenA. tenuisand other fourAcroporalineages, and thus we estimated evolutionary rates (dN/dS, nonsynonymous/synonymous substitution ratios) for four pairs of species (A. gemmifera/A. tenuis, A. sub- glabra/A. tenuis, A. echinata/A. tenuis,andA. digitifera/A. tenuis), the first three of which include lineages involved in the major intro- gression event inferred by the phylonetwork analysis (Figure 1C).
Pairwise dN/dS of the four species pairs was calculated with PAML using codeml based on the coding sequences alignment of 4,954 single orthologs genes [67]. We first divided 4,954 single-copy orthologous genes into two groups, ‘‘species tree genes’’
and ‘‘non species-tree genes.’’ We also performed the same test by comparing genes with trees matching the second most common topology (the major introgression event) compared to species tree genes, and excluding genes with other topologies. We found similar result on these two analyses. (Figures 4andS4).
In order to know where selection occurred at, we proposed several alternative scenarios (see above). We then performed two tests, first based on the major introgression topology genes, we reconstructed an ancestral sequence (the ancestral sequence of A. echinata,A. gemmiferaandA. subgrabla, Ancestral_node_1) as well as we reconstructed an ancestral sequence (the ancestral sequence ofA. digitifera,A. echinata,A. gemmiferaandA. subgrabla, Ancestral_node_2). We examined evolutionary rates between the ancestral sequences (Ancestral_node_2 /Ancestral_node_1) to represent the relative evolutionary rate before the major introgres- sion event and the other three pairs (A. echinata/ Ancestral_node_1,A. gemmifera/ Ancestral_node_1, andA. subgrabla/ Ances- tral_node_1) to represent the branches which selection occurred after the major introgression event; and found that rates were higher on the branch (Ancestral_node_2 / Ancestral_node_1) (Figure S5A). Second, we reconstructed the ancestral sequence (the ancestral
sequence ofA. gemmiferaandA. subgrabla, Anc_gem_sub), which represents the branch status after the major introgression event, and then, we calculated dN/dS on specific species paris (A. gemmifera/Anc_gem_sub andA. subglabra/Anc_gem_sub, respectively) and found that the major introgression topology genes were evolving similar with species-tree genes in these two species pairs, respectively, indicating that selection did not occur independently after the major introgression event (Figures S5B and S5C).
The ancestral sequences at internal nodes were reconstructed with PAML using codeml based on their ML phylogeny and the corresponded coding sequences [67]. The distribution of dN/dS ratio was plotted with ggplot2 in R and the significance tests of the differences between dN/dS distributions were evaluated by a Mann-Whitney test in R [68].
Testing for clustering of introgression genes
We performed a simple non-parametric test of gene clustering to test if species with gene trees mismatching the species-tree topology were clustered in the genome. First, we created a distance matrix for single-copy genes as follows. If two single-copy genes are on the same scaffold and they clustered within 2 genes, the distance scores is 5. If two single-copy genes are on the same scaffold and they clustered within 25 genes, the distance scores is 3. If two single-copy genes are on the same scaffold and they clustered within 510 genes, the distance scores is 1. If two single-copy genes are on the same scaffold and they clustered beyond 10 genes; or two single-copy genes are on different scaffolds, the distance score is 0.
Second, we randomly chose 100,000 distance scores from the distance matrix by sampling with replacement and calculated an average distance coefficient: f_null (f_null = sum of scores of all pairs/100,000) and repeated this process 1000 times to generate a null model distribution of clustering of single-copy genes. The 95% CI of the f_null distribution is (0.00216,0.00347). Finally, we calcu- lated the distance coefficient of non-species trees based on above distance matrix (f_non_spe = sum of scores of non-species tree pairs/the number of non-species tree pairs), f_non_spe is 0.0026. Thus, we conclude genes mismatching the species tree topology are not more clustered than expected by chance compared to species tree topology genes.
Gene ontology
We applied the protein sequences to Interproscan’s databases, GO, KEGG and Unipathway [69]. Then, the protein sequences were used to blast to Uniport database and the best hits were used to do GO enrichments with DAVID 6.7 [70]. We used the introgression genes (1,593 single-copy orthologs) as gene list and the rest of single-copy orthologs (3,361 single-copy orthologs) as background (See also Tables S3, S4 and S5).
QUANTIFICATION AND STATISTICAL ANALYSIS
Statistical analyses were conducted in R (version 3.4) (https://www.R-project.org/), using built-in functions. Statistical significance was tested using the Mann-Whitney test function (Figures 4,S4, andS5).
DATA AND SOFTWARE AVAILABILITY
The custom scripts have been deposited in the Mendeley Data under link: https://doi.org/10.17632/tf8dzkynsm.1#file- fa63d57c-86b2-48e7-a548-6590f17bccbd.