ORIGINAL ARTICLE
PREVALENCE OF IRRITABLE BOWEL SYNDROME AND ITS RELATION TO LIFESTYLE AND DEPRESSION QUOTIENT IN
A JAPANESE GENERAL POPULATION
Keiko Kumeta1),Kazuma Danjo1),Masashi Matsuzaka1),Ippei Takahashi1), Kiyotaka Watanabe1),Kaori Iwane1),Ryosuke Tsuya1),Takashi Umeda1),
Ken Sato2),Shinsaku Fukuda2) and Shigeyuki Nakaji1)
Abstract We analyzed the prevalence of irritable bowel syndrome (IBS) and its relation to lifestyle and depression quotient in a general population in Japan. Seven-hundred and sixty-three adults (288 males and 465 females) were enrolled in a cross-sectional study of the Iwaki Health Promotion Project in 2008. Self-questionnaires regarding smoking habit, alcohol consumption, exercise habit, dietary habit and depression quotient (Center for Epidemiologic Studies Depression Scale) were given out. Each participant was checked for IBS according to the Rome II criteria. The odds ratios for IBS prevalence were calculated using a multiple logistic regression analysis with age, body mass index, depression quotient, exercise habit, smoking habit, alcohol consumption and five dietary patterns as the explanatory variables. In genders, depression quotient showed high odds ratios for the incidence of IBS. Alcohol consumption showed a significantly high odds ratio for the incidence of IBS in males and the Japanese traditional dietary pattern had a significantly lower odds ratio in females. In conclusion, in order to prevent the occurrence of IBS in a general population in Japan, abstinence from alcohol for men, the Japanese traditional dietary pattern for women and mental management in both genders may be recommend.
Hirosaki Med.J. 62:144―165,2011
Key words: irritable bowel syndrome; dietary pattern; Japanese traditional dietary pattern;
alcohol consumption; depression quotient.
原 著
国内一地域の一般住民における過敏性腸症候群の有病率と 生活習慣 ・ 抑うつ度との関係
久米田 桂 子1) 檀 上 和 真1) 松 坂 方 士1) 高 橋 一 平1)
渡 邉 清 誉1) 岩 根 かほり1) 津 谷 亮 佑1) 梅 田 孝1)
佐 藤 研2) 福 田 眞 作2) 中 路 重 之1)
抄録 我々は国内一地域の一般住民において IBS と生活習慣及び抑うつ度との関係を検討した.一般住民763名(男性 288人,女性475人)に,質問票による調査を実施した.食事内容は因子分析で 5 つの食事パターンに分類した.IBS の 有無を従属変数に,年齢,抑うつ度,BMI,喫煙,飲酒,運動,5 つの食事パターンを独立変数として,多重ロジスティッ ク回帰分析を行い,IBS の有無に対するオッズ比を算出した.その結果,IBS に対するオッズ比は,男女とも抑うつ度 が有意に高値であった.一方,飲酒が男性でのみ有意に高いオッズ比を示し,和食パターンの食生活が女性でのみ有意 に低いオッズ比を示した.日本人の IBS の予防で,節酒は男性に,和食パターンの食生活は女性に,メンタルヘルス対 策は両性に必要と考えられた.
弘前医学 62:144―165,2011
キーワード:過敏性腸症候群;食事パターン;和食;飲酒;抑うつ度.
1)Department of Social Medicine, Hirosaki University Graduate School of Medicine
2)Department of Gastroenterology and Hematology, Hirosaki University Graduate School of Medicine Correspondence: S. Nakaji
Received for publication, December 20, 2010 Accepted for publication, January 5, 2011
1)弘前大学大学院医学研究科社会医学講座
2)弘前大学大学院医学研究科消化器血液内科学講座
別刷請求先:中路重之 平成22年12月20日受付 平成23年 1 月 5 日受理
Introduction
Irritable bowel syndrome (IBS) is a common disorder producing abdominal pain, distension and disturbed bowel function characterized by diarrhea, constipation, or an alternating passage form of the two extremes in the absence of structural or biochemical abnormalities which may lead to any serious organ problems
1). The pathogenesis of IBS is likely to be multifactorial condition involving a number of different mechanisms including disrupted gut microbiota function, immunological dysfunction, food allergy / intolerance, altered gut motility, psychological / stress factors and genetic predisposition
1, 2, 3). As no specific functional or structural correlates have been consistently demonstrated, IBS still remains a clinically defined illness diagnosed by exclusion according to different definitions and various diagnostic criteria.
Epidemiologically, IBS is common with major effect on lifestyle and health care. It may substantially interfere with lifestyle and cause absenteeism. Recent community-based studies in the world have reported that the prevalence of IBS varies strikingly from 3 to 20% among countries (Table 1). There seem to be differences in disease epidemiology between the eastern and the western world, while the prevalence in Japan (6.1%) as well as those in the East Asian countries (3.6 to 8.0%) is similar to those in the western countries (2.9 to 12 %).
The paucity of community-based epide- miological studies in Japan stimulated us into another investigation. The objective of the present study was to analyze the prevalence of IBS and its relation to lifestyle factors including dietary habits and depressive symptomatology among a Japanese general population in a rural area.
In investigating an etiologic relation between IBS and dietary habits, diet has traditionally been studied in terms of nutrients. Diet is,
however, a complex and complicated set of exposures in a causal relationship between health and disease, and approaches to examine single nutrients or isolated foodstuffs may lead to an erroneous outcome
28). Dietary pattern analysis which allows us to examine the effect of diet as a whole and to describe associations with diseases beyond those described for single nutrients or foods should be employed
28,29)
as done in the studies of gastric cancer
30), constipation
31), breast cancer
32), colorectal cancer
33)
, diabetes
34), Alzheimerʼs disease
35)and so forth. This will be the first study to analyze the relation between IBS prevalence and dietary patterns in a general population in Japan.
Subjects and Methods
Subjects and Study design
A total of 763 volunteers (288 males and 475 females with an age of 20 to 86 years) who had participated in the Iwaki Health Promotion Project in 2008 were studied. This project was a community-based cohort study, comprising the local residents living in Iwaki district, a rural area of a Japanese city, Hirosaki, to investigate their health conditions and lifestyles.
Four kinds of questionnaire on lifestyle, dietary habit, psychiatric condition and bowel habits during the previous 12 months were asked. Any subjects with incomplete questionnaires and/or medications of a laxative and/or history of gastrointestinal malignancies had been excluded from the present study.
The medical staffs (physicians and nurses) of this project had helped the subjects to fill the questionnaires, if needed.
This study was approved by the Ethics
Committee of Hirosaki University Graduate
School of Medicine and informed consent was
obtained from all the subjects before entering
the study.
Data Collection 1) Lifestyle factors
A self-questionnaire on smoking habits including quantities of consumed tobacco, drinking habits including amount of consumed alcohol beverages, exercise habit (physical activity) and past history of diseases were given out to each subject. For smoking habits, the subjects were classified into three groups: non- smoker; ex-smoker; and current smoker. Ex- smoker was defined as the subjects who had smoked but had stopped more than one year before the interview. The amounts of alcohol consumed per day were calculated to classify the subjects into five groups stratified by drinking level: non-drinker (lifetime abstainer) ; ex-drinker
(no drinks in the past year) ; current light drinker
(< 21 [g / d]) ; current moderate drinker (21 - 60 [g / d]) ; current heavy drinker (t 60 [g / d]) .
Physical activity was any personally fixed regular form of gymnastic exercises including stretching/
flexibility exercises, walk, jog, calisthenics and so forth. The level of physical activity was classified, depending on the frequency (opportunity) of its practice, into five ranks: none (0) [/ wk]; once (1)
or less [/ wk]; 2 or 3 times [/ wk], 4 or 5 times [/ wk]; 6 or 7 times [/ wk].
2) Food intake frequency
Frequency of food intake was investigated using a semi-quantitative questionnaire (FFQ:
food frequency questionnaire) . Food consisted of twenty-four kinds of foodstuffs: three kinds of staple (rice, bread, and noodle) ; miso soup;
fifteen kinds of non-staple foods (light-colored vegetables, green-yellow vegetables, fish, tofu, natto, meat, ham/sausage, konnyaku, mushrooms, seaweed, fruits, dairy products, milk, peanuts /
Table 1 Prevalence of Rome II Criteria-Defined Irritable Bowel Syndrome in Eastern and Western Countries Based on Community-Based Studies
Author Year of Publication Country Sample Size Prevalence M / F Ratio Eastern Populations
Sperber 4) 2007 Israel 1,000 2.9 1 / 2.06
Karaman 5) 2003 Turkey 998 19.1 1 / 1.76
Yilmaz 6) 2005 Turkey 3,000 10.2 1 / 1.55
Hoseini-Asi 7) 2003 Iran 4,726 5.8 1 / 1.17
Jafri 8) 2007 Pakistan 1,167 14.0 1 / 1.00
Masud 9) 2001 Bangladesh 2,426 8.5 1 / 1.84
Perveen 10) 2009 Bangladesh 1,503 7.7 1 / 1.28
Rajendra 11) 2004 Malaysia 949 14.0 1 / 1.40
Gwee 12) 2004 Singapore 2,276 8.6 1 / 1.21
Lau 13) 2002 Hong Kong 1,298 3.6 1 / 1.06
Kwan 14) 2002 Hong Kong 1,000 6.6 1 / 1.30
Lee 15) 2009 Hong Kong 2,005 5.4 1 / 1.35
Xiong 16) 2004 China 4,178 5.7 1 / 1.25
Zhao 17) 2010 China 16,091 4.6 1 / 1.22
Han 18) 2006 Korea 1,066 6.6 1 / 0.85
Park 19) 2010 Korea 1,009 8.0 1 / 1.50
Kumano 20) 2004 Japan 4,000 6.1 1 / 1.73
Western Populations
Ehlin 21) 2003 UK 22,586 2.90 - 8.26 1 / 2.7 - 3.8
Wilson 22) 2004 UK 8,386 10.5 1 / 2.12
Thompson 23) 2002 Canada 1,149 12.1 1 / 1.74
Saito 24) 2003 USA 643 4.7 1 / 0.66
Andrews 25) 2005 USA 31,829 6.6 1 / 1.75
Dapoigny 26) 2004 France 20,000 4.7 1 / 1.54
Hillila 27) 2004 Finland 3,631 5.1 1 / 1.04
almond and potato) ; two kinds of seasonings
(soy / brown sauce and dressing mayonnaise) ; fried foods; dairy dishes bought from shops; and sweets / crisps.
For obtaining the frequency data, an individual measurement scale specific to each foodstuff which consists of five ranks in order of increasing amount was configured. The ranks were assigned the numbers 1 through 5
(ordered-categorical scale). An example of such a scale was for rice: ʻ1ʼ for none [rice bowl/wk]; ʻ2ʼ for 1- 2 [rice bowl / wk]; ʻ3ʼ for 4-6 [rice bow l/
wk]; ʻ4ʼ for 1 [rice bowl / d]; and ʻ5ʼ for 2 or more [rice bowl / d].
3) Depression quotient
To make a correct evaluation of each subjectʼs depressive symptomatology, his / her depression quotient was utilized. Test for depression quotient was based on the Center for Epidemiologic Studies Depression Scale
(CES-D)
36). In brief, this scale is a self screening test for helping an individual to determine his or her depression quotient. The test consists of 20 items (questions) related to depressing feelings and behaviors during the past week: 16 questions for positive diagnosis of depression;
and 4 questions for negative. Each of 16 ʻpositiveʼ questions is assigned one scoring value of 0, 1, 2 or 3, whereas each of 4 ʻnegativeʼ questions one scoring value of 3, 2, 1 or 0. Added scoring values from the 20 items should range between 0 and 60. A score larger than or equal to 16 suggests a clinically significant level of psychological distress. However, this does not necessarily indicate a clinical depression.
ʻDepressionʼ or ʻdepressive symptomsʼ appearing later in the text or tables denote any positive depressive symptomatology with CES-D score t 16.
4) IBS diagnosis
Diagnosis (presence / absence) of ir-
ritable bowel syndrome was based on the Japanese version of the Rome II Modular Questionnaire (R II MQ)
37), which consists of four major questionnaires and eleven additional questionnaires. The four major questionnaires are for the diagnosis of IBS, and the eleven additional questionnaires are for the categorization of IBS into 3 clinical subgroups (subtypes) associated with defecation or a change in bowel habit:
IBS-C, IBS-D and Unclassifiable IBS. In brief, the history of establishment of the Rome criteria is as follows: A set of criteria to distinguish IBS from organic bowel disease was first proposed by Manning
38)in 1978. Though historically important, these criteria were not sensitive or specific, especially in men
39). A consensus panel created the Rome I criteria to provide a standardized diagnosis for research and clinical practice in 1990. They were updated to be the Rome II criteria to include a modular questionnaire for clinical investigation in1999, in which the diagnosis of irritable bowel syndrome requires that, prior to examination, patients must have abdominal discomfort or pain, not necessarily consecutive, lasting at least 12 weeks during the preceding 12 months that is associated with 2 or more of the followings: relief by defecation; onset associated with a change in frequency of stool; and onset associated with a change in form (appearance) of stool. In the criteria, IBS was categorized according to bowel movement into 3 clinical subgroups: IBS-C
(constipation predominant), IBS-D (diarrhea predominant) , and Unclassifiable IBS. The Rome II criteria were again updated to establish the Rome III criteria in 2006, which are more precise in specifying the abdominal conditions: abdominal pain or discomfort must be present at least 3 days per month during the previous 3 months to examination. Later, Unclassifiable IBS in the Rome II criteria was subdivided into IBS-M
(mixed diarrhea and constipation) and IBS-A
(alternating diarrhea and constipation) .
5) BMI
Height and body weight of the subjects were measured and their body mass indices (BMIs)
were calculated as weight [kg] / height [m
2], which were used to classify the physique of the subjects into lean (BMI d 18.0), normal (18.0 <
BMI < 25.0) or obese (BMI t 25.0).
Statistical Analysis
1) Dietary pattern derivation
The aim of estimating dietary patterns in the subjects of this study was to relate their dietary habits to the risk of IBS. Factor analysis was the method for determination of dietary patterns.
Factor analysis is a multivariate statistical method used to describe variability among observed variables in terms of a potentially smaller number of unobserved latent variables called factors. In short, this method was applied to the identification of factors (dietary patterns) in a set of measurements (the intake frequencies of the 24 foodstuffs).
Principal component analysis was used for extraction of factors. This method examines the spatial distribution of the objects so as to identify groupings and the relationships between them. The first factor extracted is the one that accounts for the maximum possible variance in the data set. The second factor, independent of the first, is to be the one that explains the greatest share of the remaining variance, and so on, without the extracted factors being correlated with each other.
Determination of the number of factors was based on the eigenvalue plot (scree plot), which plots the total variance (i.e., eigenvalue per se)
of each factor. The place where the smooth decrease of eigenvalues appears determines the maximum number of factors.
Factor loadings
per seare measurement of correlations between factors derived from and the original measurements. To obtain a clear pattern of loadings, that is, factors that are
somehow clearly marked by high loadings for some variables and low loadings for others, orthogonal rotation by the varimax method (the variance-maximizing rotation) was performed.
Factor loadings of more than 0.3 were consid- ered to be significant. Within a factor, positive loading indicated that the foodstuff was directly associated with the factor. The strength of loading represented the magnitude of con- tribution of the foodstuff to the factor, while, negative loading indicated that the foodstuff was inversely associated with the factor.
To evaluate the risk of IBS for the subjects relating to one factor (dietary pattern), they were assigned to either “high intake” or “low intake” group in the dietary pattern. This group division was configured as follows: After the varimax rotation, the factor scores for one dietary pattern (i.e., for all of the subjects)
and that for each individual subject were calculated by summing the intake frequencies of the foodstuffs weighted by the factor loading.
If the mean of the sums from the all subjects is smaller than the sum from the individual subject, he or she was affiliated to high intake group, and vice versa.
2) Odds ratio calculation
To estimate risk factors on prevalence of IBS, multivariate-adjusted odds ratios (ORs) and 95%
confident intervals (CIs) were calculated using multivariate logistic regression analysis with the presence or not of IBS in each subject as the objective variable and the age (4 categories) , depression (Yes / No) , BMI (three categories) , t o bacco s moking (3 ca teg ories), alcohol consumption (5 categories), physical activity
(5 categories) and dietary patterns (5 patterns with high or low intake subdivision) as the explanatory variables.
3) Comparisons among groups
Comparisons among groups were performed
by the chi square test or Fisherʼs exact test for categorical data and t-test for continuous data. All p-values were two-tailed and were considered significant at p < 0.05.
All statistical analyses (including dietary pattern derivation and odds ratio calculation)
were performed using ver.12.0J of the SPSS software package (SPSS Inc. Chicago, IL, USA).
Results
Prevalence of IBS
The ages of the study population ranged from 20 to 86 years with an average age of 56.3 ±13.1 [yr]. A female-to-male preponderance of 1.65 : 1 was seen. The subjects aged less than 35 years accounted for approximately 7% in both genders, and those aged 50 years or older accounted for 65.6% in males and 73.7% in females. There was no statistical difference in age distribution between the two gender groups (p > 0.3) . The crude age- and gender-specific prevalence of IBS and the prevalence by the bowel pattern subtypes were described in Table 2. The overall prevalence of IBS was 68 / 763 (8.9 %) . The prevalence estimated by gender was 22 / 288 (7.6%) for males and 46 / 475 (9.7%) for females, indicating a minimal trend of female
preponderance (p > 0.3) . The prevalence related to the age groups was 10 / 51 (19.6 %) for age [yr] < 35; 22 / 173 (12.7%) for 35 d age <50; 23 / 303 (7.6 %) for 50 d age < 65; and 13 / 233 (5.5
%) for 65
d age. This downward trend of IBSprevalence with increasing age was statistically significant (p < 0.003) . As to the proportion of IBS by gender and age, 21.9 % of females with IBS were age [yr] < 35; and 31.6 % of those were age < 50; whereas, 15.8 % of males with IBS were age < 35; and 30.8 % of those were age < 50. The prevalence of IBS decreased with increasing age for both genders (p < 0.01 for males; p = 0.053
(near-significant) for females) .
For the total subjects, the prevalence of IBS according to the bowel pattern subtypes was: 21 / 763 (2.8 %) for IBS-C (constipation- predominant); 19 / 763 (2.5 %) for IBS-D
(constipation -predominant); and 28 / 763 (3.7
%) for Unclassifiable-IBS. The prevalence of IBS-C was more common (p < 0.03) in females
(18 / 475, 3.8 %) than in males (3 / 288, 1.0 %).
The proportions of IBS subjects given an overall subgroup classification were: 21 / 68
(30.8 %) for IBS-C, 19 / 68 (27.9 %) for IBS-D and 28 / 68 (41.2 %) for Unclassifiable IBS.
The subtype proportions in IBS females were 18 / 46 (39.1 %) for IBS-C, 11 / 46 (23.9 %) for IBS-D, and 17 / 46 (47.0 %) for unclassifiable
Table 2 Prevalence of IBS Based on Demographic Data
Male (n = 288) Female (n = 475) Total (n = 763)
With IBS
(n = 22)
Without IBS
(n = 266)
With IBS
(n = 46)
Without IBS
(n = 429)
With IBS
(n = 68)
Without IBS
(n = 695)
Age [y] - 34 3 (15.8) 16 (84.2) 7 (21.9) 25 (78.1) 10 (19.6) 41 (80.4)
35 - 49 12 (15.0) 68 (85.0) 10 (10.8) 83 (89.2) 22 (12.7) 151 (87.3)
50 - 64 3 ( 3.0) 97 (97.0) 20 ( 9.9) 183 (90.1) 23 ( 7.6) 280 (92.4)
65 - 4 ( 4.5) 85 (95.5) 9 ( 6.1) 138 (93.9) 13 ( 5.5) 233 (94.5)
IBS subtype IBS-C 3 ( 1.0) 18 ( 3.8) 21 ( 2.8)
IBS-D 8 ( 2.8) 11 ( 2.3) 11 (15.0)
IBS-U 11 ( 3.8) 17 ( 3.6) 17 ( 3.0)
n (%)
IBS-U: Unclassifiable IBS
IBS; whereas those for males with IBS were 2 / 22 (13.6 %) for IBS-C, 8 / 22 (36.4 %) for IBS-D and 11 / 22 (50.0 %) for Unclassifiable IBS, respectively.
Dietary Patterns
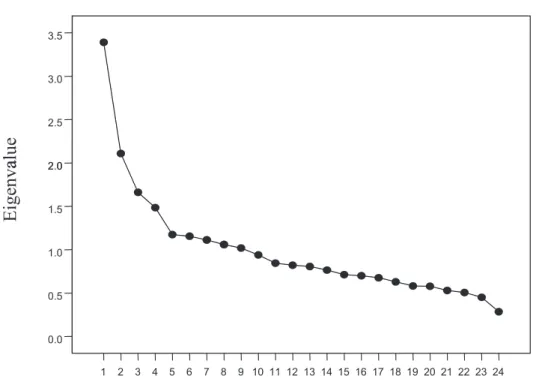
In the eigenvalue plot (scree plot), the place where the smooth decrease of eigenvalues appeared at the fifth factor (Fig. 1), therefore, the number of factors was determined five.
The factor loading matrix is shown in Table 3. In the factor analysis, high positive loadings indicate strong associations between given foodstuffs and factors (i.e. patterns), while negative loadings indicate negative associations.
Five patterns (i.e. Factor 1 through 5) were identified. Factor 1, which heavily loaded on light-colored vegetables and green-yellow vegetables, was labeled ʻvegetable-dominantʼ pattern. Factor 2, with high loadings on miso
soup, tofu, rice and natto was labeled ʻJapanese traditional patternʼ; Factor 3, with high loadings on dressing / mayonnaise, meat, fried foods, soy / brown source, ham / sausage and dairy dishes brought from shops was labelled ʻhyper- oilyʼ pattern; Factor 4, with high loadings on konnyaku, mushrooms and seafood was labelled ʻlow energyʼ pattern; and Factor 5, with high loadings on fruits, dairy products, bread, milk and peanuts / almond was labelled ʻadditional food-dominantʼ pattern. The five dietary patterns, in a whole, accounted for 26.8 % of variance in food intake. Assignment of each subject to either high intake or low intake group was listed in Table 4-1 for males and Table 4-2 for females, respectively.
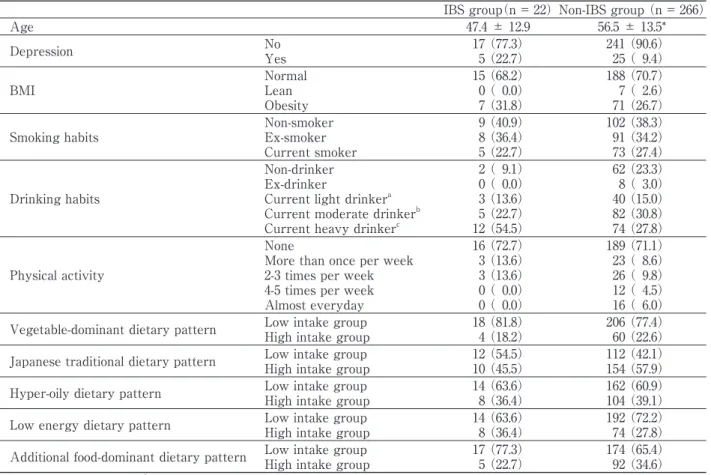
Characteristics of subjects with or without IBS
Characteristics of male and female subjects with or without IBS are shown in Table 4-1
Figure 1 Eigenvalue plot (Scree plot) showing eigenvalue for each component (factor). In this plot diagram, the place where the smooth decrease appears determines the maximum number of factors to be 5. Data for factor extraction were obtained from a semi-quantitative food intake frequency questionnaire (i.e., food frequency questionnaire, FFQ) over 24 of foodstuffs answered by the 763 people.
3.5
3.0
2.5
alue
2 02.0Eigenva
1.5 1.00.5
24 23 22 21 20 19 18 17 16 15 14 13 12 11 10 9 8 7 6 5 4 3 2 1 0.0
F t b
Factor number
and Table 4-2, separately. Items appearing in the tables were defined and categorized in conformity with those described in the method
(data collection). Detailed demographic data of IBS prevalence is also presented in Table 2.
The overall prevalence of the depressive symptoms (i.e. CES-D depression score
t 16)was 136/ 763 (17.8 %) with a significant (p <
0.01) female-to-male ratio of 106 / 763 (13.9 %)
versus 30 / 763 (3.9 %). Among the 136 subjects with the depressive symptoms, 23 subjects had IBS symptoms; therefore, the overall comorbidity (simply denoting the co-existence of depression and IBS in this study) was 23 / 136 (16.9 %) with a female-to-male ratio of 18 / 106 (15.1 %) versus 5 / 30 (16.7 %).
1) Male subjects
No significant difference was found in any corresponding item except age between the subjects with IBS (IBS group) and those without (Non-IBS group). The mean age of the IBS group (47.4 ± 12.9 [yr]) was significantly
(p < 0.01) lower than that of the Non-IBS group
(56.5 ± 13.5 [yr]). The subjects with depressive symptoms in the IBS group (5 / 22, 22.7 %)
versus those in the Non-IBS group (25 / 266, 9.4
%) was statistically near-significant (p = 0.064).
As for the attribute of Current heavy drinker
(alcohol consumption t 60 [g / d]), the subjects in the IBS group (12 / 14, 85.7 %) versus those in the Non-IBS group (74 / 134, 54.4 %) was statistically significant (p < 0.02).
Table 3 Factor-Loading Matrix for the Five Dietary Patterns (n = 763)a, b Factor 1
Vegetable-dominant
Factor 2 Japanese traditional
Factor 3 Hyper-oily
Factor 4 Low energy
Factor 5 Additional food-dominant
Light-coloured vegetables 0.82 0.03 0.18 0.15 0.16
Green-yellow vegetables 0.73 0.19 0.12 0.07 0.20
Miso soup 0.07 0.50 0.10 -0.01 0.03
Fish 0.10 0.47 -0.05 0.10 0.09
Tofu 0.02 0.43 0.04 0.25 0.12
Rice 0.02 0.42 -0.02 -0.07 -0.10
Natto 0.00 0.36 0.01 0.15 0.10
Dressing Mayonnaise 0.22 0.00 0.44 0.07 0.12
Meat -0.02 0.11 0.43 0.07 0.02
Fried foods 0.21 -0.02 0.43 -0.04 -0.02
Soy / Brown sauce 0.20 0.14 0.43 -0.03 0.01
Ham / Sausage -0.12 -0.12 0.42 0.25 -0.01
Daily dishes from shops -0.07 -0.19 0.30 0.05 0.07
Konnyaku 0.08 0.08 0.06 0.68 0.15
Mushrooms 0.12 0.17 0.10 0.51 0.11
Seaweeds 0.03 0.42 -0.04 0.43 0.15
Noodles -0.09 -0.14 0.15 0.16 0.00
Fruits 0.18 0.13 0.00 0.02 0.51
Dairy products 0.04 0.02 0.04 0.23 0.38
Bread -0.02 -0.24 0.12 0.04 0.35
Milk 0.05 0.10 -0.10 0.04 0.33
Peanuts / almond 0.00 -0.05 0.22 0.16 0.32
Sweets / crisps 0.12 0.06 0.24 -0.03 0.25
Potato 0.04 0.18 0.14 0.18 0.24
Percentage of Variance 6.1% 6.0% 5.2% 5.2% 4.3%
a Data from the food intake frequency questionnaire.
b Absolute value of loading >0.3 were boldfaced.
2) Female subjects
The mean age of the IBS group (52.7 ± 13.5 [yr])
was significantly lower (p <0.01) than that of the Non-IBS group (57.1 ± 12.7 [yr]) . The subjects with the depressive symptoms in the IBS group
(18/ 46, 39.1 %) versus those found in the Non- IBS group (88/429, 20.5 %) were also significantly different (p < 0.01) . More of the subjects with IBS belonged to the low intake group of the ʻJapanese traditionalʼ dietary pattern (30/46, 65.2
%, p < 0.01) when compared with those without IBS (196/429, 45.7 %) .
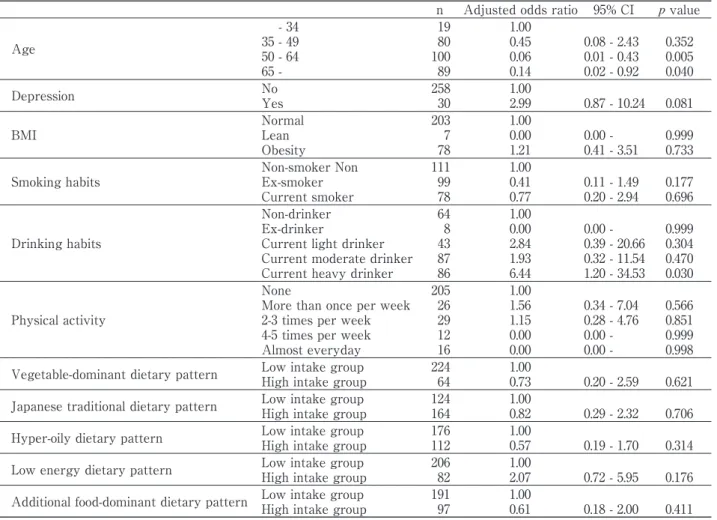
Risk factors for IBS (odds ratios)
To estimate risk factors on prevalence of IBS, multivariate-adjusted odds ratios (ORs) and 95
% confidence intervals (CIs) were calculated for each category of the above-mentioned categorical data. The results were presented in Table 5-1 for males and Table 5-2 for females, respectively.
1) Male subjects
The prevalence of IBS decreased with in- creasing age (p < 0.01): The adjusted OR for IBS was [OR:0.45, 95%CI: 0.08 - 2.43] for 35 d age [yr] < 49; [OR: 0.06 95%CI: 0.01-0.43] for 50 d age
< 65; and [OR: 0.14 , 95%CI: 0.02 - 0.92] for 65 d age.
With the non-drinking group as the referent, the current heavy drinking group (alcohol consumption
t 60 g / d) presented a highTable 4-1 Characteristics of the Male Subjects in the IBS and Non-IBS groups
IBS group(n = 22)Non-IBS group (n = 266)
Age 47.4 ± 12.9 56.5 ± 13.5*
Depression No
Yes
17 (77.3)
5 (22.7)
241 (90.6)
25 ( 9.4)
BMI
Normal Lean Obesity
15 (68.2)
0 ( 0.0)
7 (31.8)
188 (70.7)
7 ( 2.6)
71 (26.7)
Smoking habits
Non-smoker Ex-smoker Current smoker
9 (40.9)
8 (36.4)
5 (22.7)
102 (38.3)
91 (34.2)
73 (27.4)
Drinking habits
Non-drinker Ex-drinker
Current light drinkera Current moderate drinkerb Current heavy drinkerc
2 ( 9.1)
0 ( 0.0)
3 (13.6)
5 (22.7)
12 (54.5)
62 (23.3)
8 ( 3.0)
40 (15.0)
82 (30.8)
74 (27.8)
Physical activity
None
More than once per week 2-3 times per week 4-5 times per week Almost everyday
16 (72.7)
3 (13.6)
3 (13.6)
0 ( 0.0)
0 ( 0.0)
189 (71.1)
23 ( 8.6)
26 ( 9.8)
12 ( 4.5)
16 ( 6.0)
Vegetable-dominant dietary pattern Low intake group High intake group
18 (81.8)
4 (18.2)
206 (77.4)
60 (22.6)
Japanese traditional dietary pattern Low intake group High intake group
12 (54.5)
10 (45.5)
112 (42.1)
154 (57.9)
Hyper-oily dietary pattern Low intake group High intake group
14 (63.6)
8 (36.4)
162 (60.9)
104 (39.1)
Low energy dietary pattern Low intake group High intake group
14 (63.6)
8 (36.4)
192 (72.2)
74 (27.8)
Additional food-dominant dietary pattern Low intake group High intake group
17 (77.3)
5 (22.7)
174 (65.4)
92 (34.6)
Mean±SD or n (%), * p <0.01
a Current light drinker: alcohol consumption < 21 g / day
b Current moderate drinker: alcohol consumption 21-60 g / day
c Current heavy drinker: alcohol consumption t 60 g / day
estimate of [OR: 6.44, 95 % CI: 1.20-34.53], suggesting an excess alcohol ingestion to be a risk of IBS.
2) Female subjects
Depression (defined in the method) was found to produce a high odds ratio [OR: 2.21, 95
% CI: 1.10-4.44] for prevalence of IBS, suggesting an importance of mental care against its occurrence. As for the dietary patterns, the high intake group of the ʻJapanese traditionalʼ pattern presented a smaller odds ratio of [OR:
0.46, 95 % CI: 0.22-0.94] when compared with the low intake group (referent), which sustains some prophylactic effect of the ʻJapanese traditionalʼ dietary pattern on prevalence of IBS.
Table 6 summarizes the relationship among the IBS clinical subtypes, the ʻJapanese traditionalʼ dietary pattern and odds ratios. A very small ratio of [OR: 0.07, CI: 0.01-0.41] was found in the Unclassifiable IBS, but not in the IBS-C
(constipation dominant) or IBS-D (diarrhea dominant).
Discussion
We attempted to analyze the prevalence of IBS and its relation to life style factors including dietary pattern and psychosomatic character in a general population of a rural area in Japan.
Some outstanding features of this study, we believe, were determination of dietary pattern
Table 4-2 Characteristics of the Female Subjects in the IBS and Non-IBS Groups
IBS group (n = 46)Non-IBS group (n = 429)
Age 52.7±13.5 57.1±12.7 *
Depression No
Yes
28 (60.9)
18 (39.1)
341 (79.5)*
88 (20.5)
BMI
Normal Lean Obesity
36 (78.3)
5 (10.9)
5 (10.9)
317 (73.9)
18 ( 4.2)
94 (21.9)
Smoking habits
Non-smoker Ex-smoker Current smoker
40 (87.0)
4 ( 8.7)
2 ( 4.3)
365 (85.1)
41 ( 9.6)
23 ( 5.4)
Drinking habits
Non-drinker Ex-drinker
Current light drinkera Current moderate drinkerb Current heavy drinkerc
33 (71.7)
1 ( 2.2)
9 (19.6)
2 ( 4.3)
1 ( 2.2)
323 (75.3)
11 ( 2.6)
71 (16.6)
18 ( 4.2)
6 ( 1.4)
Physical activity
None
More than once per week 2-3 times per week 4-5 times per week Almost everyday
41 (89.1)
3 ( 6.5)
0 ( 0.0)
2 ( 4.3)
0 ( 0.0)
302 (70.4)
35 ( 8.2)
40 ( 9.3)
22 ( 5.1)
30 ( 7.0)
Vegetable-dominant dietary pattern Low intake group High intake group
24 (52.2)
22 (47.8)
231 (53.8)
198 (46.2)
Japanese traditional dietary pattern Low intake group High intake group
30 (65.2)
16 (34.8)
196 (45.7)*
233 (54.3)
Hyper-oily dietary pattern Low intake group High intake group
19 (41.3)
27 (58.7)
238 (55.5)
191 (44.5)
Low energy dietary pattern Low intake group High intake group
31 (67.4)
15 (32.6)
255 (67.4)
147 (32.6)
Additional food-dominant dietary pattern Low intake group High intake group
21 (45.7)
25 (54.3)
206 (48.0)
223 (52.0)
Mean±SD or n (%), * p <0.01
a Current light drinker: alcohol consumption < 21 g / day
b Current moderate drinker: alcohol consumption 21-60 g / day
c Current heavy drinker: alcohol consumption t 60 g / day
with factor analysis and estimation of the risk factors (odds ratios) for the disease by logistic regression analysis.
Prevalence of IBS
Irritable bowel syndrome (IBS) is a common gastrointestinal functional disease affecting general peoples worldwide. Basically, the diagnosis is based on the identification of symptoms according to Manning, the Rome I, Rome II or Rome III criteria, therefore it may be inevitable that prevalence of IBS varies enormously depending on the diagnostic criteria used
40). In other words, prevalence of IBS varies substantially depending on the specific definition of IBS used
41).
As for the Rome II criteria, epidemiological
studies utilizing the criteria have yielded a prevalence of as low as 2.2 %
42)to as high as 39.3 %
43). It is probable that inappropriate use and/or intrinsic limitations of the criteria may be responsible for this discrepancy. Nonetheless, we used the Rome II criteria to compare the estimates from this study with those of recent population-based studies using the same criteria
(Table 1).
The overall prevalence of 8.9 % in this study fell in the same range of the estimates in the Western (4.7-12.1 %) or the East Asian countries (3.6 - 8.0 %) as shown in Table1.
A most recent study has also reported that current Asia IBS prevalence is at least equal to that of the Western countries
44).
It is commonly believed that women are
Table 5-1 Adjusted Odds Ratios for IBS in the Males
n Adjusted odds ratio 95% CI p value
Age
- 34 35 - 49 50 - 64 65 -
19 80 100 89
1.00 0.45 0.06 0.14
0.08 - 2.43 0.01 - 0.43 0.02 - 0.92
0.352 0.005 0.040
Depression No
Yes
258 30
1.00
2.99 0.87 - 10.24 0.081 BMI
Normal Lean Obesity
203 7 78
1.00 0.00 1.21
0.00 - 0.41 - 3.51
0.999 0.733 Smoking habits
Non-smoker Non Ex-smoker Current smoker
111 99 78
1.00 0.41 0.77
0.11 - 1.49 0.20 - 2.94
0.177 0.696
Drinking habits
Non-drinker Ex-drinker
Current light drinker Current moderate drinker Current heavy drinker
64 8 43 87 86
1.00 0.00 2.84 1.93 6.44
0.00 - 0.39 - 20.66 0.32 - 11.54 1.20 - 34.53
0.999 0.304 0.470 0.030
Physical activity
None
More than once per week 2-3 times per week 4-5 times per week Almost everyday
205 26 29 12 16
1.00 1.56 1.15 0.00 0.00
0.34 - 7.04 0.28 - 4.76 0.00 - 0.00 -
0.566 0.851 0.999 0.998 Vegetable-dominant dietary pattern Low intake group
High intake group
224 64
1.00
0.73 0.20 - 2.59 0.621 Japanese traditional dietary pattern Low intake group
High intake group
124 164
1.00
0.82 0.29 - 2.32 0.706 Hyper-oily dietary pattern Low intake group
High intake group
176 112
1.00
0.57 0.19 - 1.70 0.314 Low energy dietary pattern Low intake group
High intake group
206 82
1.00
2.07 0.72 - 5.95 0.176 Additional food-dominant dietary pattern Low intake group
High intake group
191 97
1.00
0.61 0.18 - 2.00 0.411
2-3 times more likely to develop IBS than men.
Irrespective of the diagnostic criteria used, IBS prevalence estimates support a female preponderance with a ratio of 2 - 4:1
40). The prevalence by gender in this study exhibited an estimate of 9.7% in females and 7.6% in males with a female-to-male ratio of 1.3:1, which was close to the minimum of ratios of 2:1 to 1:1 reported in a study in North America
45). An insignificant difference in the gender prevalence has been reported from Korea
18), where the living environment including culture and custom does not widely differ from that of Japan, though the role of different cultural influence in IBS is still unclear. Recent information that female preponderance in Asia is common but not uniquely existed
44)or a female-to-male ratio
of 1.36:1 reported from Bangladeshi
10)may reinforce our observation.
Also believed is that IBS begins more often than not before the age of 35 (especially for females in the Western countries) or in the 10s through 40s, and therefore prevalence of IBS tends to decrease with age
9, 10, 41, 46, 47). In this study, the prevalence of IBS under the age of 35 years was about 19.6 %, which was nearly in agreement with 22.1 % estimated among Japanese college students diagnosed by the Rome II criteria as having IBS
48). Like in other studies
9, 41), a downward trend of IBS prevalence with increasing age was also noted in this study.
The Rome II criteria defined clinical subtypes
(subgroups) of IBS associated with defecation or a change in bowel habit: IBS-C (constipation-
Table 5-2 Adjusted Odds Ratios for IBS in the Females
n Adjusted odds ratio 95% CI p value
Age
- 34 35 - 49 50 - 64 65 -
32 93 203 147
1.00 0.46 0.63 0.48
0.14 - 1.46 0.22 - 1.82 0.14 - 1.70
0.187 0.394 0.256
Depression No
Yes
369 106
1.00
2.21 1.10 - 4.44 0.026 BMI
Normal Lean Obesity
353 23 99
1.00 1.63 0.45
0.50 - 5.33 0.17 - 1.23
0.416 0.120 Smoking habits
Non-smoker Non Ex-smoker Current smoker
405 45 25
1.00 0.64 0.54
0.17 - 1.76 0.13 - 3.21
0.308 0.585
Drinking habits
Non-drinker Ex-drinker
Current light drinker Current moderate drinker Current heavy drinker
356 12 80 20 7
1.00 0.73 0.93 0.87 1.51
0.07 - 7.35 0.40 - 2.17 0.16 - 4.72 0.15 - 15.49
0.787 0.865 0.873 0.729
Physical activity
None
More than once per week 2-3 times per week 4-5 times per week Almost everyday
343 38 40 24 30
1.00 0.52 0.00 0.74 0.00
0.14 - 1.90 0.00 - 0.16 - 3.50 0.00 -
0.321 0.998 0.703 0.998 Vegetable-dominant dietary pattern Low intake group
High intake group
255 220
1.00
1.26 0.64 - 2.48 0.503 Japanese traditional dietary pattern Low intake group
High intake group
226 249
1.00
0.46 0.22 - 0.94 0.033 Hyper-oily dietary pattern Low intake group
High intake group
257 218
1.00
1.30 0.63 - 2.68 0.473 Low energy dietary pattern Low intake group
High intake group
286 189
1.00
0.93 0.45 - 1.91 0.845 Additional food-dominant dietary pattern Low intake group
High intake group
227 248
1.00
1.37 0.70 - 2.70 0.359
predominant); IBS-D (diarrhea-predominant);
and Unclassifiable-IBS. For Unclassifiable- IBS, it has also been called “alternating”
subtype, IBS-A, because, in some examinees, diarrhea and constipation alternate. Published prevalence estimates by clinical subgroup vary largely. Thompson in Canada
23), Saito in North America
45)and Shiotani in Japan
49)have reported an almost equal and high percentage
(approximately 50%) of IBS-C and IBS-D. While, Penny in United Kingdom
50)has reported a very low portion of 1% for IBS-C, 40.9% of IBS-D and a vey high ratio of 58.1% for IBS-A. The percentages of IBS subtypes in this study were:
IBS-C, 31.8 %; IBS-D, 27.9 %; and Unclassifiable- IBS (IBS-A), 41.2%. Mearin et al. in Italy
51)reporting an estimate of 25% for IBS-A subtype commented that most of the IBS- A subjects in their cohort had considered themselves constipated. As clinical manifestations of IBS-A are more akin to IBS-C than to IBS-D subtype, Penny et al.
50)have cleimed the necessity of regular review of patientsʼ IBS subgroup classification to optimize patient care. A fairly high percentage of Unclassifiable-IBS (41.2%)
we observed might be due to the use of the strict Rome II criteria, which simply defines the subjects (registrants), not fitting into an arbitrary diarrhea or constipation subgroup, as the unclassifiable one; this may be overly simplistic and even misleading. Therefore, some portion of Unclassifiable-IBS in our study might
have been assigned to IBS-C. In the present study, constipation-predominant subtype was found to be more prevalent in women (3.8 %)
than in men (1.0 %), conforming the findings of most of other studies.
Dietary Patterns
There has been an increasing recognition of the importance of the use of dietary patterns as a means of incorporating the multidimensional property of diet into epidemiological studies of diseases with complex etiologies. Dietary pattern analysis utilizes the correlations with intakes of foods or nutrients to describe a general dietary pattern, which can then be related to risk of diseases. More simply, the epidemiological background of the use of dietary patterns is that because diets are composed of foods consumed in combinations, humans are exposed simultaneously to multiple factors, both nutrient and non-nutrient, that could impact positively or negatively on a disease risk
28, 29). In the present study, dietary patterns were assessed by means of factor analysis using principal component analysis based on a semi-quantitative FFQ on 24 foodstuffs answered by the 763 registrants (288 males and 475 females).
Five factors, i.e., 5 dietary patterns were identified: Vegetable-dominant, Japanese traditional, Hyper-oily, Low energy, and Additional food-dominant. Among these dietary patterns, the ʻJapanese traditionalʼ variety had
Table 6 The Japanese Traditional Dietary Pattern and IBS Subtypes in the Females
IBS Subtype n Adjusted odds ratio 95% CI p value
IBS-C Low intake group
High intake group
11 7
1.00
0.45 0.15 - 1.34 0.152
IBS-D Low intake group
High intake group
4 7
1.00
2.84 0.62 - 12.94 0.178
IBS-U Low intake group
High intake group
15 2
1.00
0.07 0.01 - 0.41 0.003
Total Low intake group
High intake group
30 16
1.00
0.46 0.22 - 0.94 0.033 IBS-U: Unclassifiable IBS
high loadings on miso soup, fish, tofu, rice and natto in order. In other words, this dietary pattern was characterized by a high intake of soy products, fish and rice. Okubo et al, in their study on dietary patterns, had also identified their ʻJapanese traditionalʼ pattern with high loadings of rice, miso soup and soy product, together with low (negative) loadings of bread and confectionaries
31). Interestingly, our ʻJapanese traditionalʼ diet seemed to have prophylactic effect on the prevalence of IBS in female subjects in this study (to be discussed below) .
Risk Factors
IBS is considered a psychosomatic disorder resulting from a combination of three interact- ing mechanisms: psychosocial factors, altered gastrointestinal motility and transit and increased sensitivity of the intestine or colon.
The etiological theories thus far postulated include disrupted microbiota function, im- m u n o l o g i c a l d y s f u n c t i o n , f o o d a l l e r g y / intolerance, altered gut motility, psychological / stress factors and genetic predisposition
1-3)
. Epidemiological or clinical studies across the world have consistently reported impacts of so-called lifestyle factors as risks on the onset and course of IBS. In the present study, we evaluated psychological stress / distress, smoking habits, drinking (alcohol) habits, frequency of exercise, and dietary habits for risk factors of IBS.
1) Depression
Depressed or distressed psychological conditions have long been thought to play a major role in IBS
52-55)but how they relate to IBS or which one (psychological condition or IBS)
comes first still remain to be solved
56). Studies so far show that they may tend to co-exist
53, 54,57)
. Although the most common mental aliment suffered by people with IBS is depression and anxiety (including panic and generalized anxiety
disorder), sever life stress, social stress and many other stresses in the living environment
(i.e. psychosocial factors) play a role in triggering or exacerbating the symptoms of IBS as well
57-59).
Hillilä MT et al
60)studied the comorbidity of depression (defined according to the Beck D e p r e s s i o n I n v e n t o r y S h o r t F o r m ) a n d gastrointestinal (GI) symptoms including IBS
(diagnosed with the Rome II ) in a general population of Finland and reported that the prevalence of depressive symptoms was 17%
and 54% of those with depressive symptoms had GI symptoms. Our study revealed that the prevalence of depressive symptoms (the CES-D
t 16) in a general population was 17.8 %, whichwas comparable to that reported by Hillilä et al. The overall concurrence of depression and IBS in this study was 33.8 %, which was also comparable to the ratio of 54 % reported by Hillilä et al. The concurrence rate by gender in this study was 39.5 % (18 / 46) for females and 22.7 % (5 / 22) for males, respectively (p >
0.27).
Among female participants, the prevalence of depressive symptoms was more frequent
(p < 0.01) in the IBS group (18 / 46, 39.1 %)
compared with that in the Non-IBS group
(88/429, 25.0%). The prevalence of IBS had a positive association with depressive symptoms with an estimate of [OR: 2.21, 95 % CI: 1.10 - 4.44], indicating a relationship between stressful or depressive psychological conditions and IBS prevalence, whereas, in male registrants, the prevalence of depressive symptoms was 5/22
(22.7%) for the IBS group versus 25 / 266 (9.4
%) for the Non-IBS group (a near-significant
difference, p = 0.064) and the risk of IBS
prevalence related to depressive symptoms was
[OR: 2.99, 95 % CI: 0.87 - 10.24]. Though it has
been said that female patients with IBS generally
have higher trait anxiety and neuroticism scores
than people without health problems with similar
gastrointestinal complications
61), our study showed that mental health care is important to reduce IBS prevalence in females and in males as well.
2) Smoking
Smoking has consistently been related to inflammatory bowel disease (IBD) in the epidemiological field. Patients with ulcerative colitis (UC) are usually non- or ex-smokers, while Crohnʼs disease (CD) is more common in smokers. The role of smoking on the development of IBD as truly as that of IBS still remains to be understood. Some studies postulated a beneficial effect of tobacco to reduce the risk of UC
62, 63)and referred to its protective effect even on IBS
64). A more recent study has reported a significant association of smoking with FGIDs including IBS occurring after bacterial gastroenteritis
65). As for the risk of IBS prevalence with smoking, Talley et al
66)and Locke et al
67)reported no association; Han et al
18)have shown an equivocal association with an estimate of [OR: 0.64, 95% CI: 0.37 - 1.12] ; but Nam et al
68)have reported a significant association with a value of [OR: 1.31, 95%CI: 1 - 1.71]. In the present study, the prevalence was not related to current- smoking with estimates of [OR: 0.77, 95% CI: 0.20 - 2.94] for males and [OR: 0.64, 95% CI: 0.13 - 3. 21] for females.
3) Alcohol
No pathophysiological mechanism unique to the association of alcohol with IBS has been identified. Altered gastrointestinal motility, psychological stress/distress and confirmed or perceived food allergy / intolerance are among the postulated mechanisms of effects of alcohol on the prevalence of IBS. Orocecal transit time in “social (habitual) drinkers” is significantly prolonged even after moderate amounts of alcohol compared with that in healthy teetotallers
69). High doses of alcohol slow
bowel motility
70)and cause mucosal damage of the gastrointestinal tract which may lead to diarrhea
70, 71). Psychological stress play a major role in IBS by precipitating exacerbation of symptoms through altered gastric emptying and / or colonic transit via the central nervous system / enteric nervous system
58, 59), where alcohol use may alleviate stress
72). Clinically, IBS has been known to be highly prevalent among alcoholics
73)but the association of alcohol consumption and IBS as well as IBD is still unclear
74).
Perceived food allergy andintolerance are medically unconfirmed, usually self-diagnosed and self-treated adverse food reactions. The former has an immunological basis, while the latter is not immune-mediated
75)
. Perceived food intolerance including alcohol is common in IBS
76, 77)but may not have substantial effects on lifestyle of those with food-attributed symptoms
78). Although there have been several community- or population-based studies regarding the relationship between alcohol and IBS symptoms, none of them seems to give an any comprehensive explanation because of the complexity of alcohol effects as stated above.
Saito et al
79), in their study of dietary nutrient composition and FGID, reported no implication of alcoholic in the pathogenesis of IBS
79). Talley et al.
66)and Locke et al.
67)detected no potential risk of alcohol use for this syndrome. While, Simren et al
76)and Monstbakken et al.
77)exploring the relationship between perceived food-related symptoms and the presence of anxiety and / or depression, advocated a possible role of alcohol in the production of IBS symptoms.
More recently, Han et al.
18)in their population-
based survey in Korea and Nam et al.
68)in their
health screenee undergoing colonoscopy, have
reported that current consumption of alcohol
had no relation to IBS with estimated risks
of [OR: 1.38, 95% CI: 0.81 - 2.35] and [OR: 1.25,
95% CI: 0.95-1.65], respectively. Halder et al.
72),
stratifying the registrants by gender, level of
psychological distress and consumed alcohol, have reported that in females with a low level of psychological distress, high alcohol use increased the odds of IBS (OR: 6.2, 95% CI: 2.2 - 17.6)
compared to moderate use (OR: 1.1, 95% CI: 0.5- 2.6) or none alcohol use (OR: 1.6, 95% CI: 0.7-3.4) . Assessing drinking habits in the present study, the proportion of male current heavy drinkers
(alcohol consumption
t 60 g / day)in the IBS group (54.5%) was significantly larger (p < 0.02)
than that in the Non-IBS group (27.8%), and the risk of excessive alcohol on IBS prevalence was estimated to be as high as [OR: 6.44, 95
% CI: 1.20-34.53]. The near-significantly higher prevalence of depressive symptoms in the IBS group might have been contributing to the occurrence of IBS through a stress-alleviating effect of alcohol
72).
Apart from the level of psychological distress, abstinence from excess alcohol consumption seems recommendable to prevent the prevalence of IBS at least for males living in Iwaki district, a rural area of a Japanese city.
4) Physical activity
It has been suggested that daily exercises including walking can maintain good bowel function and help to prevent constipation
80). Unfortunately, the measurement of the physical activity level of persons in the general population is difficult depending on each individual and therefore the data obtained in this study must also be regarded as no better than hints.
5) Diet
Subjects or patients with IBS often strongly believe that dietary intolerance significantly contributes to their symptomatology. Jones et al. put food intolerance as a major factor in the pathogenesis of IBS and demonstrated, for the first time, symptomatic response to an elimination diet in IBS patients
81). Two thirds of subjects with IBS perceive their symptoms to
be diet-related and they may therefore restrict their food intake or eliminate certain provocative dietary agents
76). Reported perceived triggers include carbohydrate and fatty foods, together with caffeine, alcohol and spices
82).
As already mentioned, we used dietary pattern analysis based on FFQ which utilizes the correlations between intakes of food or nutrients to describe a general dietary pattern, which can be related to a risk of diseases.
Several studies examining the dietary intakes of IBS patients have employed food frequency questionnaire (FFQ), a kind of dietary recall method asking the frequency of consumption of food items over a certain period of time
79,82)


![Table 6 summarizes the relationship among the IBS clinical subtypes, the ʻJapanese traditionalʼ dietary pattern and odds ratios. A very small ratio of [OR: 0.07, CI: 0.01-0.41] was found in the Unclassifiable IBS, but not in t](https://thumb-ap.123doks.com/thumbv2/123deta/5914234.2053788/10.892.96.805.179.653/summarizes-relationship-clinical-subtypes-ʻjapanese-traditionalʼ-dietary-unclassifiable.webp)