Functional Analysis of glioma‑associated homolog 1 in maintaining invasive and
mesenchymal‑like properties of melanoma cells
著者 イ ケトゥ グナルタ
著者別表示 I Ketut Gunarta journal or
publication title
博士論文本文Full 学位授与番号 13301甲第4633号
学位名 博士(理学)
学位授与年月日 2017‑09‑26
URL http://hdl.handle.net/2297/00054259
doi: 10.1111/cas.13294
Creative Commons : 表示 ‑ 非営利 ‑ 改変禁止 http://creativecommons.org/licenses/by‑nc‑nd/3.0/deed.ja
Dissertation
Functional Analysis of glioma-associated homolog 1 in maintaining invasive and mesenchymal-like properties of
melanoma cells
Graduate School of Natural Science & Technology Kanazawa University Division of Natural System
1424062011 I Ketut Gunarta
Chief Advisor:
Prof. Dr. Masafumi Iwami
2017, June 28
1 Contents
Acknowledgements ... 3
Abstract ... 4
Abbreviations ... 5
1. Introduction ... 7
2. Materials and methods... 10
Cell Culture ... 10
Plasmids, viral vector preparation, and viral infection ... 10
Western blot analysis ... 12
Quantitative reverse-transcription PCR (qRT-PCR) ... 13
Phalloidin staining and immunocytochemistry ... 14
Luc assay ... 15
Matrigel invasion assay ... 15
Cell migration assay ... 16
Thiazolyl Blue Tetrazolium Bromide (MTT) assay ... 16
Chromatin immunoprecipitation (ChIP) assays ... 17
Animal experiments ... 18
Statistical analysis ... 18
3. Results ... 19
Blockade of Shh signaling inhibits the invasion ability of melanoma cells without affecting their MITF expression and activity ... 19
Gli1 KD inhibits the invasion ability and migration of melanoma cells, independently of the regulation of MITF expression and activity ... 21
Gli1 KD prevents the lung metastasis ability of B16F10 cells ... 24
Gli1 KD induces a reversal of the mesenchymal-like phenotype ... 25
GLI1 transcriptionally regulates the expression of Snail1, Zeb1, and Twist1 ... 27
4. Discussion ... 30
2 References... 33
3 Acknowledgements
All praise to Lord Shiva for His richest grace and blessing that made me surrounded by great people throughout my life. My sincere gratitude to my supervisor, Dr. Katsuji Yoshioka for his patient and great mentoring that shaped my way of thinking as a researcher and as a person. Without his encouragement and good insight, I would never complete my study. I am thankful to Dr. Takeshi Suzuki for his great suggestion for the ChIP experiment, and to Dr. Tokiharu Sato and Dr. Ryota Nakazato for their critical comment, suggestion and helped on the experiment. I also would like to thank Dr.
Masafumi Iwami and Dr. Masaaki Yamaguchi for their advice, although it was a short advice and somewhat casual but had a big impact on me and helped me regained my confidence during my study. My great appreciation to all of my colleague in the Division of Molecular Signaling, for the supportive environment and their kind, helped on experiments, particularly to Li, Boldoo, and Suzuki.
In this last step of my formal education, I would like to thank the MEXT for my scholarship, my first mentor Artadana who introduced me to the world of biology, and Dr. Marselina who encouraged me to do my study abroad and be a researcher. Special thanks to my family, especially to my beloved wife, my mother, father and brother for their abundance of loves and sacrifices for me to pursue my dream. I feel relieved that I have finished my formal education and finally can start my real journey.
4 Abstract
The ability to reversibly switch between invasive and non-invasive phenotype has been considered to be critical for the high malignancy of melanoma. Increasing evidence suggests that this ability is determined by the activities of microphthalmia-associated transcription factor (MITF) and EMT-related transcription factors (EMT-TFs). GLI1 and GLI2, the components of Hedgehog (HH) pathway, are associated with progression and invasiveness of melanoma. Although GLI2 is known to suppress MITF expression and to promote invasive phenotype of melanoma, the role of GLI1 remains elusive. Here I show that inhibition of Shh-pathway by cyclopamine or GLI1 knockdown ( Gli1 KD) decreased migration and invasion activity of mouse and human melanoma without affecting MITF levels. I observed that Gli1 KD B16F10 melanoma cells exhibited a loss of mesenchymal- like characteristic as indicated by an increased expression of E-cadherin and a decreased expression of mesenchymal markers. To gain insight into the molecular mechanism, I analyzed several EMT-TFs that are known to regulate melanoma invasiveness. My analysis suggested that the expression of SNAIL1, ZEB1, and TWIST1, but not SNAIL2 and ZEB2, are directly regulated by GLI1. Collectively my findings suggest a regulatory role of GLI1 on a subset of EMT-TFs to promote invasive phenotype of melanoma independent of MITF.
5 Abbreviations
Ab antibody
BRAFi BRAF inhibitor BSA bovine serum albumin
DAPI 4’,6-diamidino-2-phenylindole ChIP chromatin immunoprecipitation DMSO dimethyl sulfoxide
dpi day post-infection
kb kilobase
EGFP enhanced green fluorescent protein EMEM Eagle's Minimum Essential Medium EMT epithelial-to-mesenchymal transition EMT-TF EMT-inducing transcription factor FBS fetal bovine serum
GLI1 glioma-associated oncogene homolog 1
KD knockdown
Luc luciferase
MEF mouse embryonic fibroblast
MITF microphthalmia-associated transcription factor MTT Thiazolyl Blue Tetrazolium Bromide
PATCH Patched
PBS phosphate buffered saline PCR polymerase chain reaction qPCR quantitative PCR
PD-1 programmed death 1 PFA paraformaldehyde
qRT-PCR quantitative reverse-transcription PCR
6 RPMI Roswell Park Memorial Institute
shGli1 shRNA targeting Gli1 Shh sonic hedgehog shLuc shRNA targeting Luc shRNA short hairpin RNA SMO Smoothened
TGF transforming growth factor
Tyr tyrosinase
7 1. Introduction
Melanoma incidence is increasing over past 50 years. It represents a small percentage of skin cancers, but is the major cause of mortality from these cancers.(1,2) The primary source of melanoma is melanocytes (pigment cells) that underwent a mutation that lead to the constitutive activation of MAPK signaling pathway. Approximately 50%
of melanomas harbor the activating BRAFV600E mutation.(3) Current therapies for metastatic melanoma provides only transient response and modest disease-free survival.
Although small molecule inhibitors targeting BRAF and MEK, a downstream effector of BRAF, are effective in BRAF-mutated melanoma, virtually all of the tumors develop resistance to the drugs, usually within a few months.(4-10) On the other hand, immune checkpoint inhibitors, such as an anti-programmed death 1 (PD-1) antibody, provide durable responses in patients with metastatic melanoma independent of the BRAF mutational status; however, a significant proportion of the patients either do not respond or develop resistance to the PD-1 immunotherapy.(11-15)
Tumor heterogeneity poses a major challenge for the effective treatment of cancer.
Accumulating evidence indicates that the heterogeneity in melanoma can be driven through phenotypic plasticity.(16-18) That is, the aggressiveness of melanoma appears to be due to the cancer cells’ ability to reversibly switch between different phenotypes with non-invasive and invasive potentials. Microphthalmia-associated transcription factor (MITF) plays an essential role in determining the melanocyte lineage and has been proposed to act as a rheostat for the cellular heterogeneity in melanoma.(17,19,20) In the rheostat model, low levels of MITF generate invasive, stem-like cells, whereas high MITF levels stimulate proliferation and inhibit invasion.
Acquisition of invasive phenotype is an important step for metastasis of melanoma which involves downregulation of melanocyte differentiation program accompanied by decreased expression of E-cadherin, increase expression of mesenchymal markers, and enhanced invasion. This process resembles the epithelial-mesenchymal transition (EMT)
8 in carcinoma. Epithelial-to-mesenchymal transition (EMT) is a dynamic and reversible phenotypic switching process from polarized epithelial cells to motile mesenchymal cells;
this process is essential for normal development and is widely thought to be a critical switch for tumor-cell invasiveness.(21-23) EMT is driven by an interconnected signaling network of EMT-inducing transcription factors (EMT-TFs), including SNAIL, TWIST, and ZEB. Recent studies have shown that some EMT-TFs play important roles in malignant melanoma, but their regulation and function are different from those in epithelial cancers.(24,25) These studies also suggest that the EMT-TFs SNAIL2 and ZEB2 act as tumor-suppressor proteins by activating an MTIF-dependent melanocyte differentiation program.
Hedgehog-Gli (HH-Gli) pathway is an intercellular signaling pathway playing a role in determining proper embryonic patterning and cell fate during development. HH-Gli pathway plays important roles in various cancers. Sonic hedgehog (Shh) signaling has critical roles in embryonic patterning, and aberrant Shh-signaling activation is implicated in various cancer types, including skin cancer.(26-29) The Shh signal is transduced by a receptor complex composed of two proteins, Patched (PTCH) and Smoothened (SMO).
The binding of Shh to PTCH relieves PTCH’s repression of SMO. HH-Gli signaling is active in hair follicles and required for normal proliferation of melanocyte. HH-Gli pathway also regulates proliferation, survival and self-renewal of melanoma. The transcription factor glioma-associated oncogene homolog 1 (GLI1) acts as a terminal, positive effector of Shh signaling. GLI1 is known to induce the expression of EMT-TFs to promote EMT and invasion in various cancers and has been proposed as an attractive target for cancer. GLI1’s expression and activity are also regulated through a non- canonical Shh pathway, such as those involving hypoxia or transforming growth factor (TGF)-β.(30-32) GLI1 has been suggested to be involved in melanoma progression, although its precise role and the mechanism underlying invasion remain unclear.
9 In the present study, I analyzed the role of HH-Gli pathway in the regulation of invasive phenotype with respect to EMT and MITF expression levels. Unexpectedly I found that modulation of MITF levels is not required for HH-Gli-induced EMT and invasion. My results showed HH-Gli pathway activation is capable of inducing invasion in MITF-overexpressing cells. I propose HH-Gli pathway may serves as a signaling cue that regulate EMT-TFs expression to drive invasive phenotype independent of the MITF.
Therefore targeting HH-Gli pathway might be effective for metastatic melanoma therapy.
10 2. Materials and methods
Cell Culture
B16F10 murine melanoma cells were obtained from Riken BioResource (Tokyo, Japan), and MeWo and G361 human melanoma cells from JCRB Cell Bank (Osaka, Japan).
B16F10 cells were cultured in Roswell Park Memorial Institute (RPMI) 1640 medium (Nissui Pharmaceutical, Tokyo, Japan) supplemented with 10% fetal bovine serum (FBS), and MeWo and G361 cells in Eagle's Minimum Essential Medium (EMEM) with non- essential amino acids (Wako, Tokyo, Japan) and 10% FBS. To prepare conditioned medium, NIH3T3 cells, a kind gift from Dr. Chiaki Takahashi (Kanazawa University, Kanazawa, Japan), were cultured in RPMI 1640 (Nissui Pharmaceutical) supplemented with 10% FBS. Mouse embryonic fibroblasts (MEFs) and HEK293T cells were cultured as described previously (33). In some experiments, cyclopamine (LKT Labs, St. Paul, MN, USA) and forskolin (Wako) were dissolved in dimethyl sulfoxide (DMSO) and added to the culture medium (see Figure 3.1 and Figure 3.2).
Plasmids, viral vector preparation, and viral infection
The pLVTH lentivirus plasmid vectors for short hairpin RNAs (shRNAs) were constructed as previously described.(34) In pLVTH, enhanced green fluorescent protein (EGFP) is encoded as a marker. Previously reported target sequences, which are listed in Table 1, were used to express shRNAs against mouse Gli1, human Gli1, and firefly Luciferase (Luc). Lentiviral vectors were produced as previously described.(34) B16F10, MeWo, and G361 cells were infected with the lentiviruses, and were analyzed at 7 days post-infection (dpi). The mammalian expression plasmid pCL20c-CMV-EGFP was described previously(34). To generate pCL20c-CMV-HA-GLI1, the JSAP1-coding sequence in pCL20c-CMV-HA-JSAP1(34) was replaced with the mouse GLI1-coding sequence. The potential promoter regions of Snail1, Zeb1, and Twist1 were obtained by polymerase chain reaction (PCR) using B16F10 genomic DNA as templates. The PCR
11 products were subcloned into a promoter-less pGL3 vector (Promega, Madison, WI, USA), and used for the Luc assays in Figure 5. All PCR products were verified by sequencing.
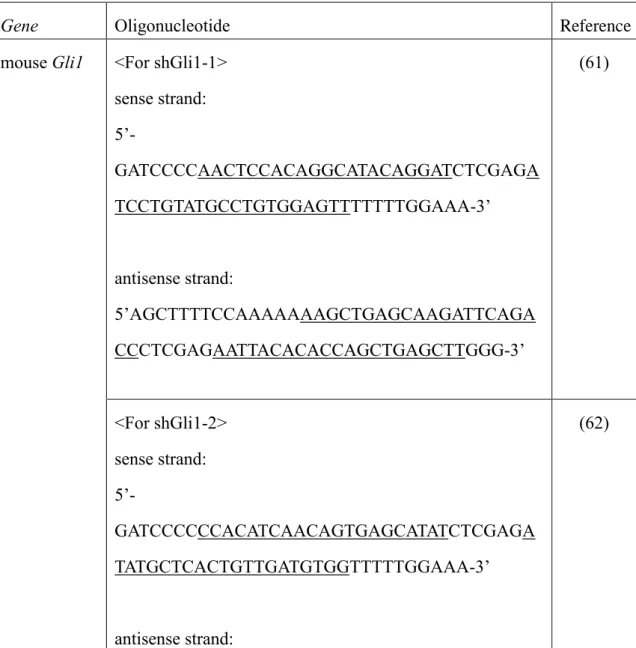
Table 1. List of oligonucleotides for the shRNA constructs used in this study. The underlined letters represent mouse Gli1, human Gli1, or firefly Luc sequences.
Gene Oligonucleotide Reference
mouse Gli1 <For shGli1-1>
sense strand:
5’-
GATCCCCAACTCCACAGGCATACAGGATCTCGAGA TCCTGTATGCCTGTGGAGTTTTTTTGGAAA-3’
antisense strand:
5’AGCTTTTCCAAAAAAAGCTGAGCAAGATTCAGA CCCTCGAGAATTACACACCAGCTGAGCTTGGG-3’
(61)
<For shGli1-2>
sense strand:
5’-
GATCCCCCCACATCAACAGTGAGCATATCTCGAGA TATGCTCACTGTTGATGTGGTTTTTGGAAA-3’
antisense strand:
(62)
12 5’-
AGCTTTTCCAAAAACCACATCAACAGTGAGCATAT CTCGAGATATGCTCACTGTTGATGTGGGGG-3’
human GLI1 sense strand: 5’-
GATCCCCAACTCCACAGGCATACAGGATCTCGAGA TCCTGTATGCCTGTGGAGTTTTTTTGGAAA-3’
antisense strand: 5’-
AGCTTTTCCAAAAAAACTCCACAGGCATACAGGAT CTCGAGATCCTGTATGCCTGTGGAGTTGGG-3’
(63)
firefly Luc sense strand: 5’-
GATCCCCGGCTATGAAGAGATACGCCTTCAAGAGA GGCGTATCTCTTCATAGCCTTTTTGGAAA -3’
antisense strand: 5’-
AGCTTTTCCAAAAAGGCTATGAAGAGATACGCCTC TCTTGAAGGCTATCTCTTCATAGCCGGG-3’
(64)
Western blot analysis
Total cell lysates were prepared and analyzed by Western blotting as previously described,(34) using rabbit anti-GLI1 H300 (sc-20687), rabbit anti-E-cadherin H108 (sc- 7870) (each diluted to 1:1000; Santa Cruz Biotechnology, Santa Cruz, CA, USA), rabbit
13 anti-MITF N2C1 (1:1000; GTX113776; GeneTex, Irvine, CA, USA), and mouse anti-α- tubulin (1:3000; #T5168; Sigma-Aldrich, St. Louis, MO, USA) antibodies (Abs).
Quantitative reverse-transcription PCR (qRT-PCR)
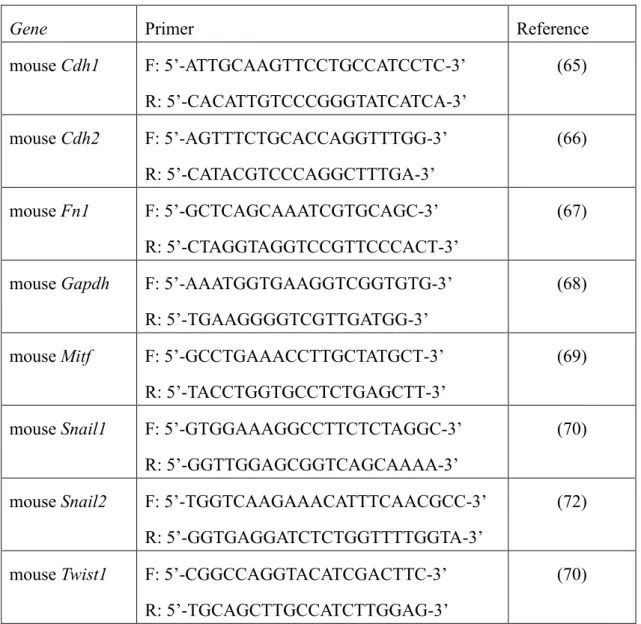
Total RNA was prepared and qRT-PCR was performed as previously described.(35) Primers used for qRT-PCR are listed in table 2.
Table 2. List of qRT-PCR primers used in this study.
F: Forward primer. R: Reverse primer
Gene Primer Reference
mouse Cdh1 F: 5’-ATTGCAAGTTCCTGCCATCCTC-3’
R: 5’-CACATTGTCCCGGGTATCATCA-3’
(65)
mouse Cdh2 F: 5’-AGTTTCTGCACCAGGTTTGG-3’
R: 5’-CATACGTCCCAGGCTTTGA-3’
(66)
mouse Fn1 F: 5’-GCTCAGCAAATCGTGCAGC-3’
R: 5’-CTAGGTAGGTCCGTTCCCACT-3’
(67)
mouse Gapdh F: 5’-AAATGGTGAAGGTCGGTGTG-3’
R: 5’-TGAAGGGGTCGTTGATGG-3’
(68)
mouse Mitf F: 5’-GCCTGAAACCTTGCTATGCT-3’
R: 5’-TACCTGGTGCCTCTGAGCTT-3’
(69)
mouse Snail1 F: 5’-GTGGAAAGGCCTTCTCTAGGC-3’
R: 5’-GGTTGGAGCGGTCAGCAAAA-3’
(70)
mouse Snail2 F: 5’-TGGTCAAGAAACATTTCAACGCC-3’
R: 5’-GGTGAGGATCTCTGGTTTTGGTA-3’
(72)
mouse Twist1 F: 5’-CGGCCAGGTACATCGACTTC-3’
R: 5’-TGCAGCTTGCCATCTTGGAG-3’
(70)
14 mouse Tyr F: 5’-CTCTGGGCTTAGCAGTAGGC-3’
R: 5’-GCAAGCTGTGGTAGTCGTCT-3’
(67)
mouse Vim F: 5’-GGACGTTTCCAAGCCTGACCTC-3’
R: 5’-CCGGTACTCGTTTGACTCCTGC-3’
(73)
mouse Zeb1 F: 5’-GATCCAGCCAAACGGAAACC-3’
R: 5’-TGGCGTGGAGTCAGAGTCAT-3’
(70)
mouse Zeb2 F: 5’-GGGACAGATCAGCACCAAAT-3’
R: 5’-GACCCAGAATGAGAGAAGCG-3’
(73)
human CDH2 F: 5’-TGCGGTACAGTGTAACTGGG-3’
R: 5’-GAAACCGGGCTATCTGCTCG-3’
(67)
human FN1 F: 5’-AGGAAGCCGAGGTTTTAACTG-3’
R: 5’-AGGACGCTCATAAGTGTCACC-3’
(67)
human GAPDH F: 5’-ACCCAGAAGACTGTGGATGG-3’
R: 5’-TCTAGACGGCAGGTCAGGTC-3’
(70)
human TYR F: 5’-CTGGAAGGATTTGCTAGTCCAC-3’
R: 5’-CCTGTACCTGGGACATTGTTC-3’
(74)
human VIM F: 5’-AGTCCACTGAGTACCGGAGAC-3’
R: 5’-CATTTCACGCATCTGGCGTTC-3’
(67)
Phalloidin staining and immunocytochemistry
B16F10 cells plated on coverslips coated with poly-L-lysine (Sigma-Aldrich) were fixed with 4% paraformaldehyde (PFA), washed with 0.1% Triton X-100 in phosphate buffered saline (PBS), and stained with rhodamine-phalloidin (1:500; Thermo Fisher Scientific, Waltham, MA, USA) and 4’,6-diamidino-2-phenylindole (DAPI; Sigma-Aldrich) to visualize F-actin and nuclei, respectively. Fluorescent images were captured with a fluorescence microscope (BX50, Olympus, Tokyo, Japan). Immunocytochemistry was performed by standard protocols as previously described,(34) using the rabbit anti-E-
15 cadherin H108 (1:200; Santa Cruz Biotechnology) Ab. The secondary Ab was goat Alexa fluor 568-conjugated anti-rabbit IgG Ab (1:1000; Thermo Fisher Scientific). Nuclei were stained with DAPI (Sigma-Aldrich). Fluorescent images were captured using a confocal laser scanning microscope (LSM510 META, Carl Zeiss, Oberkochen, Germany) with a 20x or 40x objective lens. In some experiments (Figure 3.9d), twelve Z-stack images at 1.2-μm intervals were acquired using the confocal microscope with a 40x objective lens.
Luc assay
To measure the GLI-mediated transcriptional repression in response to cyclopamine, B16F10 cells were plated in 12-well plates at 8 x 10⁴ cells per well, and were cotransfected with 950 ng of the Luc reporter vector (8xGLI-BS-Luc or 8xmGli-BS-Luc, kind gifts from Dr. Hiroshi Sasaki, Kumamoto University, Kumamoto, Japan)(36) and 50 ng of the Renilla Luc control vector (pRL-TK-Luc, Promega) using Lipofectamine LTX with Plus reagent (Thermo Fisher Scientific). Six hours after transfection, the medium was changed, and the cells were treated with either vehicle (DMSO) or cyclopamine for 24 hours. The cells were then lysed, and the Luc activity was measured as previously described.(34) To examine the effect of GLI1 overexpression on the potential promoters of Snail1, Zeb1, and Twist1, 350 ng of the Luc reporter vector containing the potential promoter region, 140 ng of either pCL20c-CMV-EGFP or pCL20c-CMV-HA-GLI1, and 10 ng of pRL-TK-Luc were cotransfected into HEK293T cells plated in 12-well plates at 2 x 10⁵ cells per well. Thirty-six hours after transfection, the cells were lysed, and subjected to Luc assays as described previously(34).
Matrigel invasion assay
The cell invasion assay was carried out using Transwell chambers with inserts of an 8- μm pore size (Corning, Corning, NY, USA). The upper chamber was pre-coated with Matrigel (300 μg/ml, 100 μl per well for B16F10 cells; 200 μg/ml, 100 μl per well for
16 MeWo cells, BD Biosciences, San Jose, CA, USA). NIH3T3-conditioned medium containing 10% FBS (for B16F10 cells) or EMEM complete growth medium supplemented with 10% FBS (for MeWo and G361 cells) was added to the lower chamber, which was pre-coated with 50 μl of fibronectin (50 μg/ml) (Thermo Fisher Scientific), and then 1x10⁵ cells were seeded on the upper chamber in serum-free medium containing 0.1% bovine serum albumin (BSA). In some experiments (Figure 3.1), cyclopamine was added to both the upper and lower chambers. At 24 hours (for B16F10 cells) or 30 hours (for MeWo and G361 cells) after seeding, the cells were fixed in 4% PFA and stained with 0.1% crystal violet. Cells remaining on the upper side of the inserts were scraped with cotton swabs, and cells on the lower side were counted.
Cell migration assay
To measure the cell migration activity, wound-healing (for B16F10 cells) and Transwell chamber (for MeWo and G361 cells) assays were performed. B16F10 cells were replated at a saturation density (2 x 10⁵ cells per well of a 12-well plate) in RPMI 1640 supplemented with 1% FBS, and incubated for 6 hours. The plates were then scratched manually with a sterile pipette tip. After being washed with RPMI 1640, the wounded regions were allowed to heal for 12 hours in RPMI 1640 medium supplemented with 1%
FBS. The cell movements were monitored using a cultured cell monitoring system (CCM- 1.4XYZ/CO2, Astec, Fukuoka, Japan). Video images were collected at 15-minute intervals for 12 hours. Transwell chamber migration assays were carried out as described above (Matrigel invasion assay) without pre-coating the upper chamber.
Thiazolyl Blue Tetrazolium Bromide (MTT) assay
The MTT assay was used to examine cell viability. B16F10, MeWo, or G361 cells were seeded in 24-well plates (8 x 10⁴ cells per well), and incubated overnight. The medium was then changed to serum-free medium containing 0.1% BSA, and the cells were
17 incubated for 24 hours to mimic the Matrigel invasion assay described above. In some experiments (Figure 3.2), cyclopamine was added to the culture medium. The cells were washed with PBS and incubated with MTT solution (0.5 mg/ml, Sigma) for 1 hour. The resulting insoluble formazan was dissolved in 0.04 N HCl in isopropanol, and the absorbance at 595 nm was measured.
Chromatin immunoprecipitation (ChIP) assays
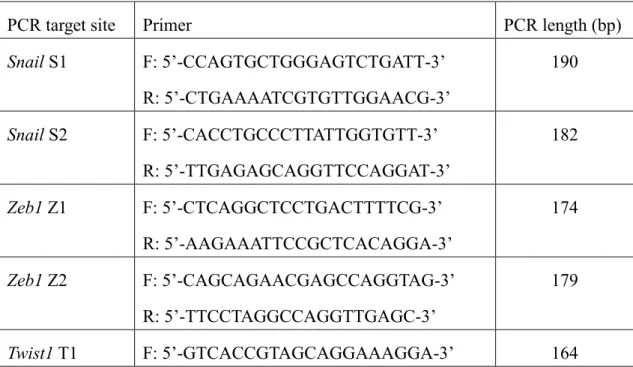
ChIP assays were performed essentially as described previously(37). B16F10 cells were fixed in formaldehyde, then lysed by sonication using a Bioruptor sonicator (CosmoBio, Tokyo, Japan). The lysates were immunoprecipitated with the rabbit anti-GLI1 H300 Ab (sc-20687; Santa Cruz Biotechnology) or control rabbit IgG (011-000-003; Jackson ImmunoResearch Laboratory, West Grove, PA, USA), and the precipitated DNA was subjected to quantitative PCR (qPCR). Primers used for the qPCR are listed in Table 3.
Table 3. List of qPCR primers used in this study.
F: Forward primer. R: Reverse primer
PCR target site Primer PCR length (bp)
Snail S1 F: 5’-CCAGTGCTGGGAGTCTGATT-3’
R: 5’-CTGAAAATCGTGTTGGAACG-3’
190
Snail S2 F: 5’-CACCTGCCCTTATTGGTGTT-3’
R: 5’-TTGAGAGCAGGTTCCAGGAT-3’
182
Zeb1 Z1 F: 5’-CTCAGGCTCCTGACTTTTCG-3’
R: 5’-AAGAAATTCCGCTCACAGGA-3’
174
Zeb1 Z2 F: 5’-CAGCAGAACGAGCCAGGTAG-3’
R: 5’-TTCCTAGGCCAGGTTGAGC-3’
179
Twist1 T1 F: 5’-GTCACCGTAGCAGGAAAGGA-3’ 164
18 R: 5’-CGGAAACCTCTAGTCCCAAG-3’
Twist1 T2 F: 5’-GACCCAGACAGTCCCCTGTT-3’
R: 5’-AACCATTCAAAACCGACCTG-3’
183
Animal experiments
All experimental procedures involving mice were approved by the Institutional Animal Care and Use Committee of Kanazawa University. To evaluate the cells’ metastatic ability, in vivo metastasis assays were performed in mice. B16F10 cells suspended in 200 μl of PBS containing 5% FBS were injected into the tail vein of 8-week-old male C57BL/6 mice (Sankyo Labo Service, Tokyo, Japan). The mice were sacrificed 14 days after the inoculation, and the lungs were fixed in 10% formaldehyde. The metastatic foci in the lungs were counted under a microscope to evaluate the development of pulmonary metastasis.
Statistical analysis
Significance was determined using a two-tailed unpaired Student’s t-test. Values of P <
0.05 were considered to be statistically significant.
19 3. Results
Blockade of Shh signaling inhibits the invasion ability of melanoma cells without affecting their MITF expression and activity
To examine the role of Shh signaling in maintaining the invasive phenotype of melanoma cells, I blocked the Shh-GLI signaling pathway using cyclopamine, an inhibitor of SMO. I used a highly metastatic murine melanoma cell line, B16F10 cells, which is widely used as a model system to study melanoma biology. B16F10 cells were treated with cyclopamine at relatively low concentrations, 2.5 µM and 5 µM. The inhibition of Shh-GLI signaling pathway was confirm as shown by decreased levels of GLI1 protein and of GLI-mediated transcriptional activity, in a dose-dependent manner (Figure 3.1a,b). In addition, I also examined the expression of GLI2 and GLI3, which mainly function as a transcriptional activator and repressor, respectively. GLI2 protein levels was decreased by cyclopamine, but to a lesser degree than GLI1 (Figure 3.1b). The processed, repressive form of GLI3 (GLI3-R) was slightly increased, and full-length GLI3 (GLI3-FL) was decreased, in cyclopamine-treated B16F10 cells in a dose- dependent manner (Figure 3.1c). As shown in Figure 3.1d,e, blocking Shh signaling with cyclopamine caused a dose-dependent decrease in invasion activity, in which a statistically significant difference was observed between cyclopamine-untreated and - treated B16F10 cells at 5 µM, but not 2.5 µM. There was no significant effect of cyclopamine at either concentration on cell viability, under the conditions used for the invasion assay (Figure 3.2).
The invasive phenotype of melanoma cells is often characterized by low levels of MITF. Therefore, I examined the expression levels of MITF in cyclopamine-treated B16F10 cells at 2.5 µM and 5 µM. The protein and mRNA levels of MITF were comparable among these cells (Figure 3.1b,f). There were also no significant differences in the mRNA levels Tyrosinase (Tyr), a MITF-target gene, in these cells (Figure 3.1g).
To rule out the possibility that the transcriptional regulation of the Mitf gene was impaired
20 Figure 3.1. Blockade of Shh signaling inhibits the invasion activity of melanoma cells. (a) B16F10 cells were cotransfected with a firefly Luc reporter plasmid containing GLI-binding sites (8xGli-BS-Luc) or mutated sites (8xmGli-BS-Luc) together with a Renilla Luc reporter plasmid, and were assayed for Luc activity, as described in Materials and Methods. (b,c) B16F10 cells were treated with cyclopamine for 48 hours at the indicated concentrations, and were then subjected to Western blotting using anti-GLI1, -GLI2, -MITF (b), and -GLI3 (c) Abs. Lane 1, cell lysate prepared from MEFs. α-tubulin was used as a loading control. (d) B16F10 cells were pre-treated with cyclopamine for 24 hours at the indicated concentrations, and were then subjected to a Matrigel invasion assay. Representative images captured using a microscope (BX50, Olympus) are shown. (e) Quantification of the results in (d). The average numbers of invading cells from five randomly chosen fields acquired using a 20x objective lens are shown. (f,g) B16F10 cells were untreated or treated with cyclopamine for 48 hours at the indicated concentrations, and the relative mRNA levels of Mitf (e) and Tyr (f) were then measured by qRT-PCR. The expression levels were normalized to Gapdh. Quantitative data are expressed as the mean ± S.E.M of three independent experiments. *P < 0.05; **P < 0.01;
***P < 0.001; n.s., not significant. Cyc, cyclopamine; NT, untreated.
21 in the B16F10 cells, I stimulated the cells with forskolin, a cAMP-elevating reagent known to induce Mitf expression. As expected, the protein levels of MITF and mRNA Tyr were increased, in the forskolin-treated B16F10 cells (Figure 3.3). Taken together, these results indicated that blocking the Shh signaling by cyclopamine at low concentration inhibits the invasion ability of B16F10 melanoma cells without affecting their MITF expression and activity.
Gli1 KD inhibits the invasion ability and migration of melanoma cells, independently of the regulation of MITF expression and activity
I next asked whether GLI1 is important for the invasive phenotype of melanoma cells. I knockdown Gli1 in B16F10 cells using two Gli1-targeting lentiviral shRNAs
Figure 3.2. Blockade of Shh signaling shows no significant effect on cell viability. B16F10 cells untreated or treated with cyclopamine at the indicated concentrations were cultured under the conditions used for the invasion assay (see Materials and Methods, Matrigel invasion assay), and were then analyzed by MTT assay. “0 μM cyclopamine” denotes vehicle treatment. The activities are shown as a percentage of the MTT activity of vehicle-treated control cells and are expressed as the mean ± S.E.M of three independent experiments. Cyc, cyclopamine; NT, untreated. n.s., not significant.
Figure 3.3. Forskolin induces the expression of MITF protein and its target gene Tyr. B16F10 cells were untreated or treated with either vehicle (DMSO) or forskolin (20 μM) for the indicated time (a) or for 24 hours (b), and the cells were then analzyed by Western blotting using an anti-MITF Ab (a) or by qRT-PCR with Tyr-specific primers (b). Anti-α-tubulin was used as a loading control in the Western blot. The relative mRNA levels of Tyr were normalized to Gapdh and are expressed as the mean ± S.E.M of three independent experiments. *P < 0.05. Ctrl., control; Fsk, forskolin; NT, untreated.
22 Figure 3.4. Gli1 KD inhibits the invasion and migration abilities of melanoma cells. (a) B16F10 cells were infected with lentiviral shLuc, shGli1-1, or shGli1-2 (termed B16F10_shLuc, B16F10_shGli1-1, and B16F10_shGli1-2 cells, respectively), and the protein levels of GLI1 and MITF were examined by Western blotting using anti-GLI1 and -MITF Abs. α-tubulin was used as a loading control. (b) Matrigel invasion assays were performed as in Figure 3.1b, using B16F10_shLuc, B16F10_shGli1-1, and B16F10_shGli1-2 cells.
Representative images of invading cells are shown. (c) Quantification of the results in (b), performed as described in Figure 3.1e. (d) B16F10_shLuc, B16F10_shGli1-1, and B16F10_shGli1-2 cells were analyzed by in vitro wound-healing assays. Phase-contrast time- lapse images at 0, 3, 6, and 9 hours are shown. Curved red lines indicate the boundary between the unscratched and scratched areas. (e) Quantification of wound size using ImageJ software (NIH). (f,g) Relative mRNA levels of Mitf (e) and Tyr (f) in B16F10_shLuc, B16F10_shGli1- 1, and B16F10_shGli1-2 cells were measured by qRT-PCR. The expression levels were normalized to Gapdh. Quantitative data are expressed as the mean ± S.E.M of three independent experiments. *P < 0.05; **P < 0.01; ***P < 0.001; n.s., not significant.
23 (shGli1-1 and shGli1-2) (Figure 3.4a), and then examined the invasion ability and migration of the Gli1-knockdown (Gli1 KD) cells. The invasion ability of the KD cells was substantially reduced compared to that of control B16F10 cells expressing a Luc- targeting lentiviral shRNA (shLuc) (Figure 3.4b,c). The cell migration activity was also inhibited by knocking down Gli1 (Figure 3.4d,e). No significant differences in viability were detected between the shLuc- and shGli1-expressing B16F10 cells under the culture conditions used for the invasion assay (Figure 3.5a). Furthermore, exogenous expression of GLI1 in B16F10 cells significantly increased the invasion activity (Figure 3.6). Then I analyzed the expression levels of MITF (protein and mRNA) and its target gene Tyr in the Gli1 KD B16F10 cells, and found that the MITF and Tyr levels were unchanged (Figure 3.4a,f,g), as seen in the cyclopamine-treated B16F10 cells. I also observed similar effects on the cell migration and invasion abilities and the MITF expression and activity in GLI1 KD MeWo (wild-type BRAF/NRAS) and G361 (BRAFV600E) cells, metastatic human melanoma cell lines (Figure 3.7). Taken together, these results strongly suggested that GLI1 plays a crucial role in maintaining the invasive phenotype of melanoma cells, independently of the regulation of MITF expression and activity.
Figure 3.5. Gli1 KD shows no significant effects on melanoma cell viability. B16F10_shLuc and B16F10_shGli1 (a), MeWo_shLuc and MeWo_shGli1 (b), and G361_shLuc and G361_shGli1 (c) cells were cultured under the conditions used for the invasion assay as in Figure 3.2, and were analyzed by MTT assay. The activities are shown as a percentage of the MTT activity of shLuc-expressing control cells and are expressed as the mean ± S.E.M of three independent experiments. n.s., not significant.
24 Gli1 KD prevents the lung metastasis ability of B16F10 cells
The decreased invasion and migration after Gli1 KD prompted us to examine the metastatic ability of the KD cells in vivo. I performed an experimental in vivo metastasis assay, in which B16F10 cells expressing shLuc (control) or shGli1 were injected into the mouse tail vein, and lung metastasis was evaluated. There were many fewer metastatic nodules in the lungs of mice injected with shGli1-expressing cells than in the lungs of control B16F10-injected mice (Figure 3.8), indicating that Gli1 KD decreases the lung metastasis ability of B16F10 cells.
Figure 3.6. GLI1 overexpression of GLI1 enhances the invasion activity of B16F10 cells.
(a,b) B16F10 cells were infected with a lentiviral vector (pCL20c-CMV(34)) expressing EGFP (control) or C-terminally HA-tagged GLI1 (GLI1-HA), and subjected to staining with DAPI and an anti-HA Ab (a) and to Westen blotting with anti-HA and anti-GLI1 Abs (b), as indicated. (c) Matrigel invasion assays using the infected cells were performed as described in Materials and Methods, except that half the number of cells (i.e., 5 x 10⁴) was used.
Representative images of invading cells are shown. (d) Quantification of the results in (c). The average numbers of invading cells, determined as described in the legend for Figure 3.1e, are shown.
25 Gli1 KD induces a reversal of the mesenchymal-like phenotype
Gli1 activity has been associated with EMT in various cancer. I question whether the decrease invasion and migration is also associated with this function in melanoma. In addition, I noticed that the Gli1 KD B16F10 cells tended to associate with each other and
Figure 3.7. Gli1 KD induces a reversal of the mesenchymal-like phenotype in MeWo and G361 cells. (a) The protein levels of GLI1 and MITF in MeWo_shLuc, MeWo_shGli1, G361_shLuc, and G361_shGli1 cells were examined by Western blotting, using anti-GLI1 and -MITF Abs. α-tubulin was used as a loading control. (b) Relative mRNA levels of TYR in MeWo_shLuc, MeWo_shGli1, G361_shLuc, and G361_shGli1 cells were measured by qRT- PCR. The expression levels were normalized to GAPDH. Quantitative data are expressed as the mean ± S.E.M of three independent experiments. (c) Transwell chamber migration assays were performed using MeWo_shLuc, MeWo_shGli1, G361_shLuc, and G361_shGli1 cells.
(d) Quantification of the results in (c). The average numbers of migrating cells are shown. (e) Matrigel invasion assays were performed as described in the legend for Figure 3.1b, using MeWo_shLuc, MeWo_shGli1, G361_shLuc, and G361_shGli1 cells. (f) Quantification of the results in (e). The average numbers of invading cells as in Figure 3.1c are shown. *P < 0.05;
**P < 0.01; ***P < 0.001; n.s., not significant.
26 Figure 3.8. Gli1 KD decreases the lung metastasis ability of B16F10 cells. (a) Representative images of the lungs of mice injected with B16F10_shLuc or B16F10_shGli cells. (b) Each open circle denotes the number of nodules representing the pulmonary metastasis ability of B16F10_shLucand 16F10_shGli1 cells in mice treated as in (a). Data are the means ± S.E.M (n = 15 mice per group). Scale bar, 0.5 cm.
Figure 3.9. Gli1 KD induces reversal of the mesenchymal-like phenotype. (a) B16F10_shLuc and B16F10_shGli1 cells, which express EGFP, were double stained with rhodamine- phalloidin and DAPI. Lower panels show higher-magnification images of the boxed areas in the upper panels. (b) Relative mRNA levels of E-cadherin (Cdh1) in the B16F10_shLuc and B16F10_shGli1 cells were measured by qRT-PCR. The expression levels were normalized to Gapdh and are expressed as the mean ± S.E.M of three independent experiments. (c) The protein levels of E-cadherin in B16F10_shLuc and B16F10_shGli1 cells were examined by Western blotting using an anti-E-cadherin Ab. α-tubulin was used as a loading control. (d) B16F10_shLuc and B16F10_shGli1 cells were double stained with DAPI and an anti-E- cadherin Ab. Lower panels show higher-magnification Z-stack images of the boxed areas in the upper panels. Z-stack images were acquired using a confocal microscope as described in Materials and Methods. (e) Relative mRNA levels of N-cadherin (Cdh2), vimentin (Vim), and fibronectin (Fn1) in B16F10_shLuc and B16F10_shGli1 cells were measured by qRT-PCR as in (b). *P < 0.05; **P < 0.01. Scale bars, 100 μm.
27 changed morphologically. Further examination by phalloidin staining showed that stress fiber formation was severely inhibited in the Gli1 KD cells (Figure 3.9a). Consistent with the changes in morphology and cytoskeletal structures, the expression levels of E- cadherin (protein and mRNA) were substantially increased, with the E-cadherin protein being predominantly localized to areas of cell-cell contact, in the Gli1 KD cells (Figure 3.9b-d). Furthermore, the mRNA expression levels of mesenchymal markers, such as N- cadherin and vimentin were significantly decreased in the Gli1 KD cells compared to the shLuc-expressing control cells (Figure 3.9e). Similar expression profiles of E-cadherin and mesenchymal markers were obtained using MeWo and G361 cells (Figure 3.10), although there were no increased cell-cell adhesion in both cell lines as observed in B16F10. These results may indicate that GLI1 regulates a subset of EMT-TFs to prevent the reverse transition from a mesenchymal-like to an epithelial-like phenotype.
GLI1 transcriptionally regulates the expression of Snail1, Zeb1, and Twist1
To gain insight into the molecular mechanism, I investigated whether GLI1 modulates the expression of key EMT-TFs, including SNAIL and ZEB family members.
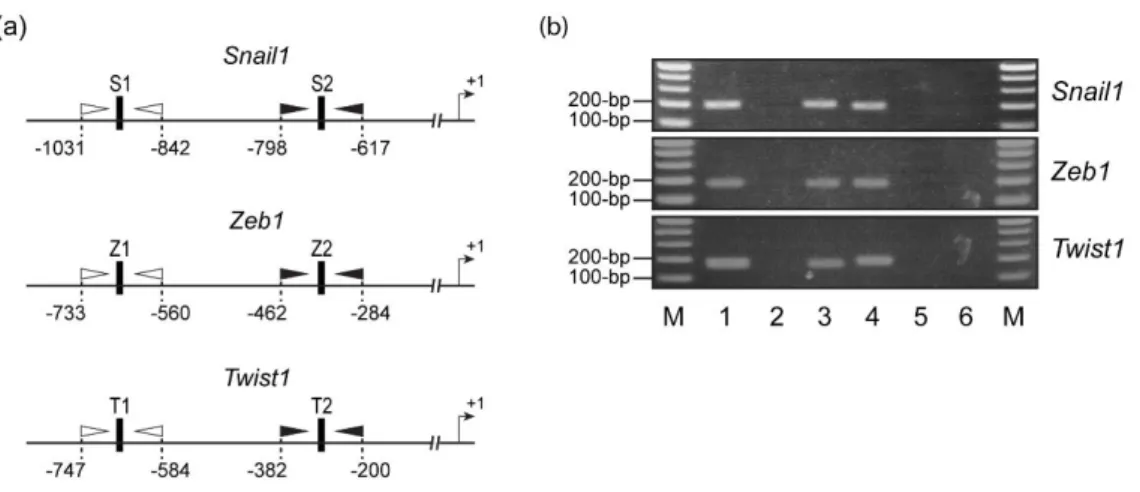
As shown in Figure3-11a, the mRNA levels of Snail1, Zeb1, and Twist1 were significantly decreased in the Gli1 KD B16F10 cells compared to the control B16F10 cells, whereas no significant differences in the Snail2 or Zeb2 mRNA levels were observed between the Gli1 KD and control cells. Using the MatInspector software(40), I identified several putative GLI-binding sites within the one-kilobase (1-kb) upstream region of the transcriptional start sites of Snail1, Zeb1, and Twist1 (termed S1 and S2 for Snail1; Z1, Z2, and Z3 for Zeb1; and T1, T2, and T3 for Twist1; see Figure 3.11b). I then conducted ChIP assays with an anti-GLI1 Ab in B16F10 cells. The precipitated DNAs were analyzed by qPCR using primers specific for the GLI1-binding sites. However, because the regions around Z3 and T3, which are close to transcriptional start sites, are GC-rich, I were unable to design specific primer sets and therefore did not perform ChIP
28 Figure 3.11. GLI1 transcriptionally regulates the expression of Snail1, Zeb1, and Twist1. (a) Expression of EMT-TFs in Gli1 KD B16F10 cells. Relative mRNA levels of Snail1, Snail2, Zeb1, Zeb2, and Twist1 in B16F10_shLuc and B16F10_shGli1 cells were measured by qRT- PCR. The expression levels were normalized to Gapdh and are expressed as the mean ± S.E.M of three independent experiments. (b) Scheme of the potential promoter regions of Snail1, Zeb1, and Twist1, and the Luc reporter. Numbers indicate the position relative to the transcriptional start sites (+1). Closed vertical boxes represent putative GLI-binding sites.
Core sequences of the GLI-binding motif are shown by uppercase letters, in which the underlined nucleotides differ from the consensus sequences. Open and closed arrowheads indicate qPCR primers. (c-h) ChIP and qPCR (c,e,g), and Luc (d,f,h) assays were performed as described in Materials and Methods. *P < 0.05; **P < 0.01; n.s., not significant.
29 experiments for them. The ChIP results revealed that GLI1 bound significantly to S1, Z1, and T1, but not to S2, Z2, or T2 (Figure 3.11c,e,g and Figure 3.12b). I then examined the effect of GLI1 overexpression on the potential promoters of Snail1, Zeb1, and Twist1 using reporter assays, and found that GLI1 overexpression substantially enhanced the promoter activities of the 1-kb regions. The activities were not significantly increased when the regions’ corresponding deletion derivatives were used (Figure 3.11d,f,h).
Collectively, these results strongly suggest that GLI1 binds directly to the promoters of Snail1, Zeb1, and Twist1, and regulates their expression. In addition, I found a significant co-occurrence between Gli1 and Zeb1 (P = 0.002) and between Gli1 and Sail1 (P = 0.004) by analyzing the TCGA cutaneous melanoma dataset (287 samples with RNA sequencing expression data) through the cBioPortal for cancer genomic data using mutual exclusivity analysis (41,42).
Figure 3.12. Primers used in ChIP assays, and agarose gels of PCR products. (a) Schematic representation of the regions surrounding putative GLI-binding sites in the promoter regions of Snail1, Zeb1, and Twist1. Closed vertical boxes indicate putative GLI-binding sites. Open and closed arrowheads represent primers (see Table S3) used for the ChIP and PCR analyses shown in Figure 5b. Numbers indicate positions relative to the transcriptional start sites (+1) of Snail1, Zeb1, and Twist1. (b) Agarose gels of PCR products. Chromatin was prepared from fixed and sonicated B16F10 cells expressing lentiviral shLuc, and subjected to PCR. Input DNA (lanes 1 and 4) and ChIP DNA with IgG (lanes 2 and 5) and anti-GLI1 Ab (lanes 3 and 6) were amplified by PCR (30 cycles) using primer sets for the Snail1 S1 (lanes 1-3) and S2 (lanes 4-6) sites, Zeb1 Z1 (lanes 1-3) and Z2 (lanes 4-6) sites, and Twist1 T1 (lanes 1-3) and T2 (lanes 4-6) sites. Lane M, 100-bp ladder DNA marker.
30 4. Discussion
The expression level of MITF is thought to be the key factor in determining the proliferative or invasive state of melanoma according to MITF-dependent phenotype switching model. MITF is a key molecule that regulates heterogeneity in melanoma, and the MITF rheostat model has become widely accepted in melanoma biology. In the present study, I demonstrated for the first time that the transcription factor GLI1 plays an important role in maintaining the invasive phenotype of melanoma cells without affecting the MITF expression and activity. I also showed that GLI1 prevents the reversal of the mesenchymal-like phenotype of melanoma cells, most likely by modulating a subset of EMT-TFs. These findings provide new insight into how a high degree of heterogeneity and plasticity is achieved and regulated in melanoma.
Microenvironmental factors, such as hypoxia or TGF-β, are known to influence both MITF expression and the phenotype switching of melanoma cells.(17,20,43-46) In addition, Pierrat et al.(43) reported that Mitf is down-regulated by GLI2 and TGF-β to antagonize the MITF activity. Furthermore, Faião-Flores et al.(46) recently showed that the GLI1 and GLI2 expressions increase upon the acquisition of BRAF inhibitor (BRAFi) resistance in melanoma cell lines and patient melanoma samples, where again the inverse correlation between GLI2 and MITF expression is observed. On the other hand, in this study I found that GLI1 exerts its function with little or no effect on the MITF expression and activity. Nevertheless, the results of the present study are not inconsistent with previous studies, considering the following points. First, Gli1 is a direct transcriptional target of GLI2.(47,48) Second, GANT61, a pharmacological inhibitor used in the previous studies, inhibits both the GLI1 and GLI2 activities.(49,50) Accordingly, as explained by Faião-Flores et al.,(46) the increased expression of GLI2 by TGF-β through a non- canonical Shh pathway results in an increase and decrease in GLI1 and MITF expression, respectively, which can be canceled by GANT61. Finally, although GLI1 and GLI2 have very similar consensus DNA-binding sites,(51) GLI2, but not GLI1, may specifically
31 regulate Mitf transcription along with GLI2-interacting cofactors, which have been proposed by Eichberger et al.(52) Taken together, it is conceivable that GLI1 and GLI2 play distinct roles in the transcriptional regulation of Mitf.
Recent studies have shown that a switch in the EMT-TF expression pattern from SNAIL2high/ZEB2high/TWIST1low/ZEB1low to SNAIL2low/ZEB2low/TWIST1high/ZEB1high occurs during melanoma progression.(24,25) Caramel et al.(24) further demonstrated that EMT-TF reprograming is associated with decreased MITF expression and activity. In addition, Richard et al.(53) reported that ZEB1 plays a key role as a major driver of melanoma cell plasticity and phenotypic resistance to BRAFi, and that Zeb1 KD increases the sensitivity to BRAFi in both MITFlow and MITFhigh cellular contexts. In this study, on the other hand, I found that Gli1 KD induced a mesenchymal-epithelial-like transition in melanoma cells, which was accompanied by severely decreased invasive and migratory properties, and by an increased expression of E-cadherin and downregulation of mesenchymal markers. I also observed decreased mRNA levels of Snail1, Zeb1, and Twist1, but not of Snail2 or Zeb2, in the Gli1 KD melanoma cells. It is reported that SNAIL1 and TWIST1 cooperatively control Zeb1 expression during EMT in epithelial cells.(54) Taken together with the results of my ChIP and Luc reporter assays (Figure 3.11), it is conceivable that GLI1 directly regulates the transcriptional expression of a subset of EMT-TFs, including Snail1 and Twist1, as in non-melanoma cancer cells,(55,56) to maintain the invasive activity of melanoma cells through MITF-independent mechanisms.
Further studies are needed to clarify this issue.
An increased expression of Gli1 has been observed in BRAFi-resistant melanoma cells and patient samples,(46) as well as during melanoma progression.(57) Taken together with my present results, GLI1 may play a role in generating a high level of intratumor heterogeneity in melanoma. Targeting GLI1 may therefore be an effective approach for melanoma therapy. Indeed, accumulating evidence suggests that GLI antagonists, of
32 which GANT61 has been most extensively studied in vitro and in animal models, are promising therapeutic candidates for a wide range of cancers, including melanoma.(58)
Current therapy for metastatic melanoma using MEK inhibitor or BRAF inhibitor possess a great challenge. An alternative differentiation therapy by inducing MITF- dependent melanocyte differentiation program has been proposed recently (59). However, since high or low expression of MITF may contribute to drug resistance mechanism, further understanding is required. Recently, several studies link the EMT and MITF- dependent phenotype switching. However, ~14% of melanoma showed high expression of MITF and EMT marker and metastatic melanoma with high expression of MITF showed worse outcome as compared to the melanoma with low expression of MITF (60). These evidence together with my study suggest that in a certain condition, high MITF expression may coexist with EMT which give rise to melanoma subtype with high malignancy. Certainly, further understanding of this process might be helpful to design an effective therapy for metastatic melanoma.
33 References
1. Miller AJ, Mihm MC Jr. Melanoma. N Engl J Med 2006; 355: 51-65.
2. Tsao H, Chin L, Garraway LA, Fisher DE. Melanoma: from mutations to medicine.
Genes Dev 2012; 26: 1131-55.
3. Davies H, Bignell GR, Cox C et al. Mutations of the BRAF gene in human cancer.
Nature 2002; 417: 949-54.
4. Sosman JA, Kim KB, Schuchter L et al. Survival in BRAF V600-mutant advanced melanoma treated with vemurafenib. N Engl J Med 2012; 366: 707-14.
5. Chapman PB, Hauschild A, Robert C et al. Improved survival with vemurafenib in melanoma with BRAF V600E mutation. N Engl J Med 2011; 364: 2507-16.
6. Flaherty KT, Infante JR, Daud A et al. Combined BRAF and MEK inhibition in melanoma with BRAF V600 mutations. N Engl J Med 2012; 367: 1694-703.
7. Lito P, Rosen N, Solit DB. Tumor adaptation and resistance to RAF inhibitors. Nat Med 2013; 19: 1401-9.
8. Van Allen EM, Wagle N, Sucker A et al. The genetic landscape of clinical resistance to RAF inhibition in metastatic melanoma. Cancer Discov 2014; 4: 94-109.
9. Holderfield M, Deuker MM, McCormick F, McMahon M. Targeting RAF kinases for cancer therapy: BRAF-mutated melanoma and beyond. Nat Rev Cancer 2014;
14: 455-67.
10. Long GV, Stroyakovskiy D, Gogas H et al. Combined BRAF and MEK inhibition versus BRAF inhibition alone in melanoma. N Engl J Med 2014; 371: 1877-88.
11. Hamid O, Robert C, Daud A et al. Safety and tumor responses with lambrolizumab (anti-PD-1) in melanoma. N Engl J Med 2013; 369: 134-44.
12. Robert C, Ribas A, Wolchok JD et al. Anti-programmed-death-receptor-1 treatment with pembrolizumab in ipilimumab-refractory advanced melanoma: a randomised dose-comparison cohort of a phase 1 trial. Lancet 2014; 384: 1109-17.
13. Ribas A, Hamid O, Daud A et al. Association of Pembrolizumab With Tumor
34 Response and Survival Among Patients With Advanced Melanoma. JAMA 2016;
315: 1600-9.
14. Zaretsky JM, Garcia-Diaz A, Shin DS et al. Mutations Associated with Acquired Resistance to PD-1 Blockade in Melanoma. N Engl J Med 2016; 375: 819-29.
15. Jazirehi AR, Lim A, Dinh T. PD-1 inhibition and treatment of advanced melanoma- role of pembrolizumab. Am J Cancer Res 2016; 6: 2117-2128.
16. Hoek KS, Eichhoff OM, Schlegel NC et al. In vivo switching of human melanoma cells between proliferative and invasive states. Cancer Res 2008; 68: 650-6.
17. Hoek KS, Goding CR. Cancer stem cells versus phenotype-switching in melanoma.
Pigment Cell Melanoma Res 2010; 23: 746-59.
18. Li FZ, Dhillon AS, Anderson RL, McArthur G, Ferrao PT. Phenotype switching in melanoma: implications for progression and therapy. Front Oncol 2015; 5: 31.
19. Goding CR. Commentary. A picture of Mitf in melanoma immortality. Oncogene 2011; 30: 2304-6.
20. Vandamme N, Berx G. Melanoma cells revive an embryonic transcriptional network to dictate phenotypic heterogeneity. Front Oncol 2014; 4: 352.
21. De Craene B, Berx G. Regulatory networks defining EMT during cancer initiation and progression. Nat Rev Cancer 2013; 13: 97-110.
22. Lamouille S, Xu J, Derynck R. Molecular mechanisms of epithelial-mesenchymal transition. Nat Rev Mol Cell Biol 2014; 15: 178-96.
23. Ye X, Weinberg RA. Epithelial-Mesenchymal Plasticity: A Central Regulator of Cancer Progression. Trends Cell Biol 2015; 25: 675-86.
24. Caramel J, Papadogeorgakis E, Hill L et al. A switch in the expression of embryonic EMT-inducers drives the development of malignant melanoma. Cancer Cell 2013;
24: 466-80.
25. Denecker G, Vandamme N, Akay O et al. Identification of a ZEB2-MITF-ZEB1 transcriptional network that controls melanogenesis and melanoma progression. Cell
35 Death Differ 2014; 21: 1250-61.
26. Stecca B, Mas C, Clement V et al. Melanomas require HEDGEHOG-GLI signaling regulated by interactions between GLI1 and the RAS-MEK/AKT pathways. Proc Natl Acad Sci USA 2007; 104: 5895-900.
27. Teglund S, Toftgård R. Hedgehog beyond medulloblastoma and basal cell carcinoma. Biochim Biophys Acta 2010; 1805: 181-208.
28. Briscoe J, Thérond PP. The mechanisms of Hedgehog signalling and its roles in development and disease. Nat Rev Mol Cell Biol 2013; 14: 416-29.
29. Pandolfi S, Stecca B. Cooperative integration between HEDGEHOG-GLI signalling and other oncogenic pathways: implications for cancer therapy. Expert Rev Mol Med 2015; 17: e5.
30. Dennler S, André J, Alexaki I et al. Induction of sonic hedgehog mediators by transforming growth factor-beta: Smad3-dependent activation of Gli2 and Gli1 expression in vitro and in vivo. Cancer Res 2007; 67: 6981-6.
31. Lei J, Fan L, Wei G et al. Gli-1 is crucial for hypoxia-induced epithelial- mesenchymal transition and invasion of breast cancer. Tumour Biol 2015; 36: 3119- 26.
32. Wang X, Zhao F, He X et al. Combining TGF-β1 knockdown and miR200c administration to optimize antitumor efficacy of B16F10/GPI-IL-21 vaccine.
Oncotarget 2015; 6: 12493-504.
33. Tuvshintugs B, Sato T, Enkhtuya R, Yamashita K, Yoshioka K. JSAP1 and JLP are required for ARF6 localization to the midbody in cytokinesis. Genes Cells 2014; 19:
692-703.
34. Sato T, Torashima T, Sugihara K, Hirai H, Asano M, Yoshioka K. The scaffold protein JSAP1 regulates proliferation and differentiation of cerebellar granule cell precursors by modulating JNK signaling. Mol Cell Neurosci 2008; 39: 569-78.
35. Sato T, Ishikawa M, Mochizuki M et al. JSAP1/JIP3 and JLP regulate kinesin-1-
36 dependent axonal transport to prevent neuronal degeneration. Cell Death Differ 2015; 22: 1260-74.
36. Sasaki H, Hui C, Nakafuku M, Kondoh H. A binding site for Gli proteins is essential for HNF-3beta floor plate enhancer activity in transgenics and can respond to Shh in vitro. Development 1997; 124: 1313-22.
37. Yoshida M, Ishimura A, Terashima M et al. PLU1 histone demethylase decreases the expression of KAT5 and enhances the invasive activity of the cells. Biochem J 2011; 437: 555-64.
38. Lee J, Platt KA, Censullo P, Ruiz i Altaba A. Gli1 is a target of Sonic hedgehog that induces ventral neural tube development. Development 1997; 124: 2537-52.
39. Hynes M, Stone DM, Dowd M et al. Control of cell pattern in the neural tube by the zinc finger transcription factor and oncogene Gli-1. Neuron 1997; 19: 15-26.
40. Cartharius K, Frech K, Grote K et al. MatInspector and beyond: promoter analysis based on transcription factor binding sites. Bioinformatics. 2005; 21: 2933-42.
41. Cerami E, Gao J, Dogrusoz U et al. The cBio cancer genomics portal: an open platform for exploring multidimensional cancer genomics data. Cancer Discov 2012; 2: 401-4.
42. Gao J, Aksoy BA, Dogrusoz U et al. Integrative analysis of complex cancer genomics and clinical profiles using the cBioPortal. Sci Signal 2013; 6: pl1.
43. Pierrat MJ, Marsaud V, Mauviel A, Javelaud D. Expression of microphthalmia- associated transcription factor (MITF), which is critical for melanoma progression, is inhibited by both transcription factor GLI2 and transforming growth factor-β. J Biol Chem 2012; 287: 17996-8004.
44. Cheli Y, Giuliano S, Fenouille N et al. Hypoxia and MITF control metastatic behaviour in mouse and human melanoma cells. Oncogene 2012; 31: 2461-70.
45. Laugier F, Delyon J, André J, Bensussan A, Dumaz N. Hypoxia and MITF regulate KIT oncogenic properties in melanocytes. Oncogene 2016; 35: 5070-7.
37 46. Faião-Flores F, Alves-Fernandes DK, Pennacchi PC et al. Targeting the hedgehog transcription factors GLI1 and GLI2 restores sensitivity to vemurafenib-resistant human melanoma cells. Oncogene 2017; 36: 1849-1861.
47. Regl G, Neill GW, Eichberger T et al. Human GLI2 and GLI1 are part of a positive feedback mechanism in Basal Cell Carcinoma. Oncogene 2002; 21: 5529-39.
48. Ikram MS, Neill GW, Regl G et al. GLI2 is expressed in normal human epidermis and BCC and induces GLI1 expression by binding to its promoter. J Invest Dermatol 2004; 122: 1503-9.
49. Lauth M, Bergström A, Shimokawa T, Toftgård R. Inhibition of GLI-mediated transcription and tumor cell growth by small-molecule antagonists. Proc Natl Acad Sci USA 2007; 104: 8455-60.
50. Agyeman A, Jha BK, Mazumdar T, Houghton JA. Mode and specificity of binding of the small molecule GANT61 to GLI determines inhibition of GLI-DNA binding.
Oncotarget 2014; 5: 4492–503.
51. Hallikas O, Palin K, Sinjushina N et al. Genome-wide prediction of mammalian enhancers based on analysis of transcription-factor binding affinity. Cell 2006; 124:
47-59.
52. Eichberger T, Kaser A, Pixner C et al. GLI2-specific transcriptional activation of the bone morphogenetic protein/activin antagonist follistatin in human epidermal cells. J Biol Chem 2008; 283: 12426-37.
53. Richard G, Dalle S, Monet MA et al. ZEB1-mediated melanoma cell plasticity enhances resistance to MAPK inhibitors. EMBO Mol Med 2016; 8: 1143-1161.
54. Dave N, Guaita-Esteruelas S, Gutarra S et al. Functional cooperation between Snail1 and twist in the regulation of ZEB1 expression during epithelial to mesenchymal transition. J Biol Chem 201; 286: 12024-32.
55. Li X, Deng W, Nail CD et al. Snail induction is an early response to Gli1 that determines the efficiency of epithelial transformation. Oncogene 2006; 25: 609-21.
38 56. Kong Y, Peng Y, Liu Y, Xin H, Zhan X, Tan W. Twist1 and Snail link Hedgehog signaling to tumor-initiating cell-like properties and acquired chemoresistance independently of ABC transporters. Stem Cells 2015; 33: 1063-74.
57. Das S, Harris LG, Metge BJ et al. The hedgehog pathway transcription factor GLI1 promotes malignant behavior of cancer cells by up-regulating osteopontin. J Biol Chem 2009; 284: 22888-97.
58. Gonnissen A, Isebaert S, Haustermans K. Targeting the Hedgehog signaling pathway in cancer: beyond Smoothened. Oncotarget 2015; 6: 13899-913.
59. Saez-Ayala M, Motenegro MF, Sanchez-del-Campo L et al. Directed phenotype switching as an effective antimelanoma strategy. Cancer Cell 2013; 24: 105-19.
60. Wellbrock C, Arozarena I. Microphtalmia-associated transcription factor in melanoma development and MAP-kinase pathway targeted therapy. Pigment Cell Melanoma Res. 2015; 28: 290-406.
61. Vila G, Papazoglou M, Stalla J et al. Sonic hedgehog regulates CRH signal transduction in the adult pituitary. FASEB J 2005; 19: 281-283.
62. Wu M, Ingram L, Tolosa EJ et al. Gli Transcription Factors Mediate the Oncogenic Transformation of Prostate Basal Cells Induced by a Kras-Androgen Receptor Axis.
J Biol Chem 2016; 291: 25749-25760.
63. Sanchez P, Hernández AM, Stecca B et al. Inhibition of prostate cancer proliferation by interference with SONIC HEDGEHOG-GLI1 signaling. Proc Natl Acad Sci USA 2004; 101: 12561-12566.
64. Ono R, Masuya M, Nakajima H et al. Plzf drives MLL-fusion-mediated leukemogenesis specifically in long-term hematopoietic stem cells. Blood 2013;
122: 1271-1283.
65. Suzuki A, Maeda T, Baba Y, Shimamura K, Kato Y. Acidic extracellular pH promotes epithelial mesenchymal transition in Lewis lung carcinoma model. Cancer Cell Int 2014; 14: 129.
39 66. Fu M, Vohra BP, Wind D, Heuckeroth RO. BMP signaling regulates murine enteric nervous system precursor migration, neurite fasciculation, and patterning via altered Ncam1 polysialic acid addition. Dev Biol 2006; 299: 137-150.
67. Wang X, Spandidos A, Wang H, Seed B. PrimerBank: a PCR primer database for quantitative gene expression analysis, 2012 update. Nucleic Acids Res 2012; 40:
D1144-1149.
68. Sato T, Ishikawa M, Mochizuki M et al. JSAP1/JIP3 and JLP regulate kinesin-1- dependent axonal transport to prevent neuronal degeneration. Cell Death Differ 2015; 22: 1260-1274.
69. Oboki K, Morii E, Kataoka TR, Jippo T, Kitamura Y. Isoforms of mi transcription factor preferentially expressed in cultured mast cells of mice. Biochem Biophys Res Commun 2002; 290: 1250-1254.
70. Zingg D, Debbache J, Schaefer SM et al. The epigenetic modifier EZH2 controls melanoma growth and metastasis through silencing of distinct tumour suppressors.
Nat Commun 2015; 6: 6051.
71. Li Y, Wang J, Asahina K. Mesothelial cells give rise to hepatic stellate cells and myofibroblasts via mesothelial-mesenchymal transition in liver injury. Proc Natl Acad Sci USA 2013; 110: 2324-2329.
72. Suzuki A, Maeda T, Baba Y, Shimamura K, Kato Y. Acidic extracellular pH promotes epithelial mesenchymal transition in Lewis lung carcinoma model. Cancer Cell Int 2014; 14: 129.
73. Renthal NE, Chen CC, Williams KC, Gerard RD, Prange-Kiel J, Mendelson CR.
miR-200 family and targets, ZEB1 and ZEB2, modulate uterine quiescence and contractility during pregnancy and labor. Proc Natl Acad Sci USA 2010; 107: 20828- 20833.
74. Smith MP, Brunton H, Rowling EJ et al. Inhibiting Drivers of Non-mutational Drug Tolerance Is a Salvage Strategy for Targeted Melanoma Therapy. Cancer Cell 2016;
40 29: 270-284.