Events
著者 フィンディア プシュピタサリ
著者別表示 Findya Puspitasari journal or
publication title
博士論文本文Full 学位授与番号 13301甲第4325号
学位名 博士(学術)
学位授与年月日 2015‑09‑28
URL http://hdl.handle.net/2297/43849
doi: 10.1007/s11869-015-0367-y
Creative Commons : 表示 ‑ 非営利 ‑ 改変禁止 http://creativecommons.org/licenses/by‑nc‑nd/3.0/deed.ja
黄砂によって風送される大気微生物群集の分子系統解析に関する研究
being a Thesis submitted for the Degree of Doctor of Philosophy
by:
Findya Puspitasari 1223132009
GRADUATE SCHOOL OF NATURAL SCIENCE & TECHNOLOGY KANAZAWA UNIVERSITY
2015
Phylogenetic Analysis of Atmospheric Microbial Communities Transported by
Asian Dust (Kosa) Events
Graduate School of
Natural Science & Technology Kanazawa University
Division of Material Sciences
Student ID No. 1223132009 Name : Findya Puspitasari
Chief advisor : Assoc. Prof. Maki Teruya July 2015
i
Airborne microorganisms (bioaerosol) from the Chinese desert region, which are released into the atmosphere, disperse by the Asian dust event and affect ecosystems, human life, atmospheric processes and ice-cloud formation in downwind areas. However, the dynamics of airborne bacterial abundance and compositions have rarely been investigated in Asian dust source region and downwind areas during dust events. In the first segment of the study, air samplings were sequentially performed in the Asian dust arrival area (Kanazawa city, Japan) during a dust event. The airborne bacterial communities in dusty atmosphere significantly differed from those in the non-dust period and dominated by terrestrial bacteria such as Bacillus species.
Next the bacterial communities in air samples and sand samples of the Asian dust source region (Taklamakan desert) were analyzed using a clone library technique. Air samples were mainly composed of the members of Firmicutes and Proteobacteria and the proportion of Proteobacteria sequences decreased during a dust event, whereas that of Firmicutes clones increased correspondingly. Bacillus species was predominant in both sand and air samples. These results suggested that the transports of bioaerosols from dune sand to atmosphere.
Finally, for more comprehensive understanding in vertical mixture of airborne microbial to high altitudes over Asian dust source, the air samples collected at altitudes of 800 m and 10 m over Taklamakan desert were analyzed using pyrosequencing targeting bacterial 16S rDNA and fungal Internal Transcribed Spacer (ITS) regions. High diverse of microorganisms were detected
ii
at the high altitude of 800 m. Dust events over Taklamakan desert are thought to carry fungal populations as well as bacterial populations. The dominated levels of fungal populations were higher than those of bacterial populations, suggesting that the most fungal cells would be hardly transported to higher altitudes.
The wind conditions over desert area would contribute to vertical mixture of some microbial populations from dune sand to atmosphere and the bacterial population that maintain their viabilities increased in atmosphere in downwind areas.
iii
Abstract ... i
Contents ... iii
List of Tables ... v
List of figures ... vi
CHAPTER 1: GENERAL INTRODUCTION ... 1
1.1 Background and research overview ... 1
CHAPTER 2: AIRBORNE BACTERIAL COMMUNITIES STRUCTURE VARIATION DURING ASIAN DUST (KOSA) EVENT IN A DOWNWIND AREA, KANAZAWA CITY JAPAN 2.1 Introduction ... 5
2.2 Materials and methods ... 6
2.2.1 Sampling ... 6
2.2.2 Characteristics and trajectories of air masses ... 7
2.2.3 Microscopic analysis of particles abundance ... 8
2.2.4 Cloning analysis targeting 16S rDNA sequences ... 9
2.2.5 Accession numbers ... 10
2.3 Result and discussion ... 12
2.3.1 Environmental conditions ... 12
2.3.2 Microscopic observation of aerosols ... 16
2.3.3 Dynamics of 16S rDNA clone libraries ... 18
2.3.4 Dominated bacterial species in the air sample ... 21
CHAPTER 3: COMPARATIVE ANALYSIS BETWEEN BACTERIAL POPULATION STRUCTURE OF SAND DUNES AND DUST AEROSOL IN A KOSA SOURCE AREA, THE TAKLAMAKAN DESERT 3.1 Introduction ... 35
3.2 Materials and methods ... 36
3.2.1 Sampling of air sample and sand particles ... 36
3.2.2 Characteristics and trajectory of air masses ... 38
3.2.3 Microscopic analysis of particles abundance ... 38
3.2.4 Clone libraries of bacterial 16S rDNA ... 38
3.2.5 Bacterial isolation from air and sand samples ... 40
3.2.6 Accession numbers ... 40
3.3 Result and discussion ... 42
3.3.1 Transport trajectories and environmental factors ... 42
3.3.2 Bacterial compositions in air samples ... 45
3.3.3 Bacterial compositions in sand samples ... 48
3.3.4 Dominant bacterial species in air sand and samples ... 51
CHAPTER 4: VERTICAL MIXTURE OF AIRBORNE MICROBIAL TO HIGH ALTITUDES OVER KOSA SOURCE AREA, DUNHUANG CITY CHINA 4.1 Introduction ... 54
4.2 Materials and methods ... 56
iv
4.2.4 Clone libraries of bacterial 16S rDNA and fungal 18S rDNA .... 58
4.2.5 Analysis of bacterial community structures using pyrosequencing analysis targeting 16S and 18S rDNA sequences ... 59
4.3 Result and discussion ... 60
4.3.1 Transport trajectory and environmental factors ... 60
4.3.2 Bacterial community structures in air sample among two altitudes... 62
4.3.2 Fungal community structures in air samples among two altitudes... 67
CHAPTER 5: CONCLUSION ... 73
REFERENCES ... 76
ACKNOWLEDGMENT ... 87
v
Table 2.1 Phylogenetic affiliation of 16S rDNA gene sequences obtained from clone libraries ... 11 Table 2.2 Meteological conditions from April 30 to May 7, 2011, in
Kanazawa city and Wajima city ... 28 Table 3.1 Phylogenetic affiliation of 16 rRNA gene sequences obtained
from clone libraries ... 50 Table 3.2 Phylogenetic affiliation of sequences of bacterial isolates
obtained from sand and air sample... 51
vi
Figure 2.1 Three-day backward trajectories of aerosols that arrived in Kanazawa city at altitudes of 10, 1,000, and 3,000 m from 5:00 JST to 18:00 JST on May 1, 2011(a), from 18:00 JST on May 1 to 24:00 JST on May 4 (b), from 24:00 JST of May 4 to 24:00 JST on May 5 (c) and from 0:00 JST to 24:00 JST on May 6 (d) ... 13 Figure 2.2 Temporal variations of concentrations of all bacterial particles
(open circles) (a), and white particles (closed circles) and yellow fluorescence particles (closed triangles) of 0.2-2.5 m (b), 2.5-5.0
m (c), and >5.0 m in diameter (d) in bioaerosol samples collected at 10 m altitude in Kanazawa city (1 – 7 May, 2011) ... 15 Figure 2.3 Lidar observation of attenuated backscatter coefficient
(532nm), depolarization ratio and attenuated backscatter coefficient (1064nm) in Toyama city from 0:00 in 29 Apr. 2011 to 0:00 in 4 May. 2011 (a) and from 0:00 in 29 Apr. 2011 to 0:00 in 9 May. 2011 (b) ... 16 Figure 2.4 Change in compositions of the partial sequences of 16S rDNA
clones (Ca. 400 bp) obtained from bioaerosol samples collected at 10 m altitude in Kanazawa city (1 – 7 May, 2011) ... 19 Figure 2.5 Phylogenetic tree including the partial sequences of 16S rDNA
amplicons obtained from the clone libraries (Kzp series) from the bioaerosol samples collected in Kanazawa city and the known members of Cyanobacteria. The phylogenetic tree was calculated from a dissimilarity matrix of an approximately 1400 bp alignments (E. coli numbering 92 to 1475) using a neighbor-joining algorithm.
The sample information and the accession number of each reference sequence are given in parentheses. Open circles at branch points indicate that bootstrap values obtained by neighbor-joining analysis exceeded 50% (after 1000 resampling) ... 25 Figure 2.6 Phylogenetic tree including the partial sequences of 16S rDNA
amplicons obtained from the clone libraries (Kzp series) from the bioaerosol samples collected in Kanazawa city and the known members of Firmicutes. The phylogenetic tree was calculated from a dissimilarity matrix of an approximately 1400 bp alignments (E.
coli numbering 71 to 1432) using a neighbor-joining algorithm. The sample information and the accession number of each reference sequence are given in parentheses. Open circles at branch points indicate that bootstrap values obtained by neighbor-joining analysis exceeded 50% (after 1000 resampling) ... 26 Figure 2.7 Phylogenetic tree including the partial sequences of 16S rDNA
amplicons obtained fromthe clone libraries (Kzp series) from the
vii
alignments (E. coli numbering 86 to 1437) using a neighbor-joining algorithm. The sample information and the accession number of each reference sequence are given in parentheses. Open circles at branch points indicate that bootstrap values obtained by neighbor- joining analysis exceeded 50% (after 1000 resampling) ... 27 Figure 3.1 Sampling site (Dunhuang city) and Asian dust (KOSA) source
region (Taklamakan Desert) ... 41 Figure 3.2 Temperature and relative humidity at Dunhuang city (10-12
September, 2012) ... 43 Figure 3.3 Backward trajectories of air masses containing aerosols at
Dunhuang city over three days (September 9-11, 2012) ... 44 Figure 3.4 Particle concentrations in the atmosphere 10 m above the
ground at Dunhuang city Meteorological Department campus (10- 12 September, 2012) ... 45 Figure 3.5 Composition of bacterial species in sand and air samples based
on clone libraries of bacterial 16S rDNA ... 49 Figure 3.6 Phylogenetic tree including the partial sequences of 16S rDNA
amplicons obtained from the isolate (sand; DhSi series, air; DhAi series), and the clone libraries from sand (DhS series) and air samples (DhA series) of the Firmicutes and Actinobacteria. The sample information and the accession number of each reference sequence are given in parentheses. Open circles at branch points show that the bootstrap values obtained by neighbor-joining analysis exceeded 50% (after 1000 resamplings) ... 52 Figure 3.7 Phylogenetic tree including the partial sequences of 16S rDNA
amplicons obtained from the clone libraries from sand (DhS series) and air samples (DhA series) representative of the Proteobacteria.
The sample information and the accession number of each reference sequence are given in parentheses. Open circles at branch points show that bootstrap values obtained by neighbor-joining analysis exceeded 50% (after 1000 resamplings) ... 53 Figure 4.1 Three days backward trajectories of air masses containing
aerosols at Dunhuang city September 10, 2013 ... 61 Figure 4.2 Particle concentrations in the atmosphere 10 m and 800 m
above the ground at Dunhuang city Meteorological Department Campus September 10, 2013 ... 63 Figure 4.3 Bacterial compositions at class level of the partial sequences in
pyrosequencing database (ca 400 bp) obtained from duplicated air sample (1, 2) collected at altitude of 10 m and 800 m over Dunhuang city on September 10, 2013 ... 65
viii
member of Firmicutes and Proteobacteria. The sample information and the accession number of each reference sequence are given in parentheses. Open circles at branch points show that bootstrap values obtained by neighbor-joining analysis exceeded 50% (after 1000 resamplings)... 66 Figure 4.5 Fungal compositions at species level of the partial sequences in
pyrosequencing database (ca 400 bp) obtained from duplicated air sample (1, 2) collected at altitude of 10 m and 800 m over Dunhuang city on September 10, 2013 ... 69 Figure 4.6 Phylogenetic tree including the partial sequences of 18S rDNA
amplicons obtained from the clone libraries (10 m; 13Dh10 and 800 m; 13Dh800). The sample information and the accession number of each reference sequence are given in parentheses. Open circles at branch points show that bootstrap values obtained by neighbor- joining analysis exceeded 50% (after 1000 resamplings) ... 70
Chapter 1:
GENERAL INTRODUCTION
1.1 BACKGROUND AND RESEARCH OVERVIEW
The soil particles, which are derived from the deserts of the Asian continent, are frequently transported over the Eastern China Sea or the Yellow Sea to Japan during the spring season (Iwasaka et al. 1983). These Asian dust events are common atmospheric phenomena in Japan, and are known as “Kosa” that literally means yellow sands in Japanese (Iwasaka et al. 1983). Desert winds aerosolize several billion tons of soil derived dust each year, including concentrated seasonal pulses from the Asian desert areas (Uematsu et al. 1983;
Duce et al. 1980), causing the damages of human health (Ichinose et al. 2005).
In addition, Kosa events are known to transport airborne microorganisms, thereby supporting the microbial immigration to downwind ecosystems (Maki et al. 2010; Iwasaka et al. 2009). The mineral-dust particles are associated with organic particles commonly called “bioaerosols,” which include viruses, bacteria,
fungi, and pollen as well as plant and animal debris (Jones and Harrison 2004;
Jaenicke 2005; Prospero et al. 2005). Possibly the transportation of bioaerosol by Kosa events have a role in transporting pathogens (Kellogg and Griffin 2006;
Iwasaka et al. 2009). The Airborne microorganisms carried by dust event contributing to the dispersion of diseases such as Kawasaki diseases in human (Rodo et al. 2011) rust diseases in plant (Brown and Hovmoller 2002), and increase the allergen burden causing an increase incidence in asthma (Ichinose et al. 2005). Mouse assay suggested that Kosa events could transport microbial matters and allergens with the potential to impact the health of downwind populations and ecosystems (Liu et al. 2014).
Some types of airborne microorganisms that can synthesize organic molecules such as mannitol, glucose, and fructose, impact the organic carbon content of cloud water and aerosols (Delort et al. 2010). Microorganisms in the atmosphere are also known to act as ice nuclei (Joly et al. 2013) and cloud condensation nuclei affecting ice-cloud processes (Möhler et al. 2007). Viable bacteria have been identified in super cooled cloud droplets, and their ability to metabolized organic matters in the environment has been confirmed (Sattler et al.
2001; Vaïtilingom et al. 2012). Bioaerosols are also thought to influence atmospheric processes by participating in atmospheric chemical reactions and formation of cloud-nucleating particles (Pratt et al. 2009).
Bacterial community structures in the atmosphere should be investigated for understanding the long-range transport processes of airborne bacteria and their influence on ecosystem dynamics, human health, and climate change in downwind areas. The researches targeting atmospheric bioaerosols has developed
very rapidly since the 21 century (Jones and Harrison 2004; Jaenicke 2005, Prospero et al. 2005; Iwasaka et al. 2009), but accumulated data of microbial communities in the atmosphere is limited to a few studies, which have focused on the microorganisms traveling with the African dusts (Kellogg and Griffin. 2006;
Kellogg et al. 2004) and Kosa (Wu et al. 2004; Yeo and Kim 2002). Then the microbial community structures of the atmospheric bioaerosols in the source and arrival areas of Kosa were not clarified.
The atmosphere is a heterogeneous environment; meteorological shifts and dust events considerably alter bacterial abundance and composition in the Asian atmosphere (Hara and Zhang, 2012; Maki et al. 2014). The airborne microorganisms at high altitudes (approximately 3,000 m above sea level) over dust arrival areas were found to change in response to Kosa events that included highly diverse bacterial species (Smith et al. 2012; Maki et al. 2013). The Kosa mineral particles are mainly originated from the Chinese desert areas such as Taklamakan desert, Loess Plateau, and Gobi deserts (Sun et al. 2001; Duce et al.
1980; Iwasaka et al. 1983). The sand dune (Hua et al. 2007; An et al. 2013) and atmosphere (Hua et al. 2007; Maki et al. 2008; Wang et al. 2010) in Chinese desert areas has been demonstrated to include high diverse of bacterial communities. However, the dynamics of airborne bacterial communities in Kosa source and arrival regions have not investigated in detail. The vertical mixture process of bioaerosols over Asian source region is unclear inhibiting the determination of long-range transported microorganisms.
In chapter 2, for elucidating the airborne bacterial dynamics in Kosa downwind area such as Japan, air samples were collected at the ground surface in
Kanazawa city during a long-term of Kosa event, and the changes in bacterial abundance and species compositions were determined using the combination of fluorescence microscopic observation and clone library analysis targeting 16S rRNA genes (16S rDNA). In chapter 3, dune sand samples and air samples of the Kosa source region (Dunhuang city in Taklamakan desert) were collected for analyzing the dynamics of airborne bacteria in Dunhuang city during a dust event and comparing between the bacterial communities of sands and atmosphere depending on clone library analysis. In chapter 4, air samplings using a balloon and a building were performed for collecting air samples at altitudes of 800 m and at 10 m for more comprehensive understanding of airborne microbial communities at high altitudes in Asian-dust source. Microbial community structures in the air samples were analyzed using the combination of pyrosequencing analysis and cloning library technique.
Chapter 2:
AIRBORNE BACTERIAL COMMUNITIES STRUCTURE VARIATION DURING ASIAN DUST (KOSA) EVENT IN A DOWNWIND AREA, KANAZAWA CITY JAPAN
2.1 INTRODUCTION
The dynamic of airborne bacteria in downwind areas during Kosa event need to be elucidated in order to understand the characteristics of bacterial communities that are transported long distances and influences downwind ecosystem and climates. The size and composition of airborne bacterial communities at high altitudes above Kosa dust deposition areas such as Beijing (Li et al. 2010), Osaka (Yamaguchi et al. 2012), Noto Peninsula (Maki et al.
2013), and the North American mountains (Smith et al. 2012) varied significantly depending on the Kosa event studied. Investigations of airborne microbial
dynamics at the ground level in China and Korea indicated that soma bacterial species from Firmicutes were predominant during Kosa events (Jeon et al. 2011).
However, there are a few reports investigating bacterial dynamics at the ground level in Japan when the dust particles that have passed through China and Korea have traversed the Sea of Japan. Dust particles reaching Japan are reported to change their chemical composition when passing over Chinese industrial area and the Sea of Japan. Thus, the chemical and biological characteristics of dust particles in Japan are expected to differ from the dust particles collected from Korea and China, and, in fact, it was reported that bacterial abundance and viabilities at the ground level in Japan dynamically changed during a Kosa events (Hara and Zhang 2012). However, the diversity and structure dynamics of airborne bacteria have yet to be investigated in a populated area in Japan during a Kosa event.
To investigate the population dynamics of airborne bacteria in Japan during a Kosa event, we collected air samples at the ground surface in Kanazawa city from May 1 to May 7, 2011, during a long-term of Kosa event. We determined the abundance of bioaerosol in the air samples by microscopic observation using a fluorescence staining technique. The composition of the bacterial species in the air samples was analyzed using clone-library analysis targeting bacterial 16S ribosomal RNA genes (16S rDNA).
2.2 MATERIALS AND METHODS
2.2.1 Sampling
Air sampling was performed in Kanazawa city (36.33ºN, 136.39ºE), a
coastal city located on the northern coast of the Hokuriku region on the south area of Japan Sea. In this city aerosol from the continental area arrived directly from the Sea of Japan and aerosol contamination from Japan can be eliminated.
Sampling was performed from 7:00 JST on May 1, 2011 to 8:00 JST on May 7, 2011, during dust event (1-4 May, 2011). The sampling system was placed on a 10-m high platform (located at Kanazawa University). Air samples (520 L) were collected using sterilized polycarbonate filters (0.22 µm pore size; Whatman, Tokyo, Japan) with a sterilized filter holder using an air pump. For each sample, two filters were used continuously for 12 h; the filters were changed every 12 h.
In total, four air samples were obtained during the sampling period from the morning of May 1 to the morning of May 7, which were labeled sample 1 to sample 12. Of the two filters used to collect each sample, one filter was used to determine the abundance of bioaerosol by microscopic observation, and the other one was stored at –80°C before the extraction of genomic DNA for the analysis of bacterial species composition.
2.2.2 Characteristics and trajectories of air masses
To track the transport pathways of air masses, 72-h backward trajectories were calculated using the National Oceanic and Atmospheric Administration (NOAA) Hybrid Single Particle Lagrangian Integrated Trajectory (HYSPLIT) model (http://www.arl.noaa.gov/HYSPLIT.php). The position of the backward trajectory start point was used as the air sampling area for this study (36.33ºN, 136.39ºE), from altitudes 10, 1000 and 3000 m above the ground level to estimate the accurate trajectories of air masses in the free troposphere. The depolarization
ratios of particle below 3000 m on May 1 and May 7, 2011 were measured using light detection and ranging (lidar) at Toyama city (http://www-lidar.nies.go.jp/).
Ground surfaces data for the atmospheric and air quality were obtained from the meteorological observatories of the Japan Meteorological Agency in Kanazawa city that located 10 km from sampling site and Wajima city that located 50 km from sampling site. For analyzing air-mass dynamics every one hour environmental data were collected such as precipitation, temperature, relative humidity, wind velocity, dew point temperature, and steam pressure (Table 2.2)
2.2.3. Microscopic analysis of particle abundance
To determine the particle abundance within 2 h of sampling 1 mL of sterilized water with paraformaldehyde at a final concentration of 1% was added to one of the filter folders to fix the aerosols (Maki et al. 2014). After a 1-h incubation period, the filter was stained with 4, 6-diamidino-2-phenylindole (DAPI) at a final concentration of 0.5 µg/mL for 15 min (Porter and Feig 1980).
Next, the filter was placed on a slide on a drop of low-fluorescence immersion oil.
A second drop of oil was added, and a coverslip was placed on top. The prepared slides were then observed using an epifluorescence microscope (Olympus, Tokyo, Japan) equipped with an ultraviolet excitation system. A filter transect was scanned, and the mineral particles (white particles), yellow particles and bacterial cells on the filter transect were counted. The detection limit of aerosols was below 5 × 10³ particles/m3 of air.
2.2.4 Cloning analysis targeting 16S rDNA sequences
After the sampling aerosol were washed off the filter by shaking with 5 mL of Tris-ethylenediaminetetraacetic acid buffer. After washing, the aerosol were collected by centrifugation at 20,000 ×g for 5 min. Genomic DNA (gDNA) was extracted from the bacterial cell using SDS, proteinase K, and lysozyme as described previously (Maki et al. 2008). The gDNA was purified by phenol–
chloroform extraction, chloroform extraction, and ethanol precipitation.
Fragments of 16S rDNA (1,450 bp) were amplified from the extracted gDNA by PCR using the following oligonucleotide primers: 27F, 5–AGA GTT TGA TCM TGG CTC AG–3′; and 1492R, 5′–GGY TAC CTT GTT ACG ACT T–3′ (Maidak et al. 1997). Thermal cycling was performed using a Program Temp Control System PC-700 under the following conditions: denaturation at 95 °C for 1 min, annealing at 55 °C for 2 min, and extension at 72 °C for 2 min, for a total of 30 cycles. The PCR amplicons were purified by phenol-chloroform extraction and chloroform extraction, followed by ethanol precipitation. The PCR amplicons of 16S rDNA fragments were cloned into Escherichia coli using a commercially prepared vector PCRII-TOPO with a TA Cloning Kit (Invitrogen, CA, USA) according to the manufacturer’s protocol. More than 50 clones were obtained from each sample. The nucleotide sequences were determined using a Dye DeoxyTM Terminator Cycle Sequencing Kit (ABI, CA, USA) and a DNA auto sequencing system (ABI, Model 373A) according to the manufacturer’s recommended protocol. The M13 reverse primers were used as the sequencing primer. The defined sequences were compared with DDBJ (DNA Data Bank of Japan) database using Basic Local Alignment (BLAST) to analyze bacterial
species compositions. All sequences without chimeras were assigned as operational taxonomic units (OTUs) based on bacterial species with more than 97% similarities. The coverage of the 16S rDNA library was calculated using the formula [1 – (n/N)], where n is the number of clones. The full sequences of the dominant clones were determined using the M13 reverse primer. The Phylogenetic tree was constructed according to the neighbor-joining algorithm using TreeViewPPC (Saitou and Nei 1987).
2.2.5 Accession numbers
DDBJ accession numbers for the 16S rDNA sequences determined in this study are from AB900929 to AB900963 (Table 2.1).
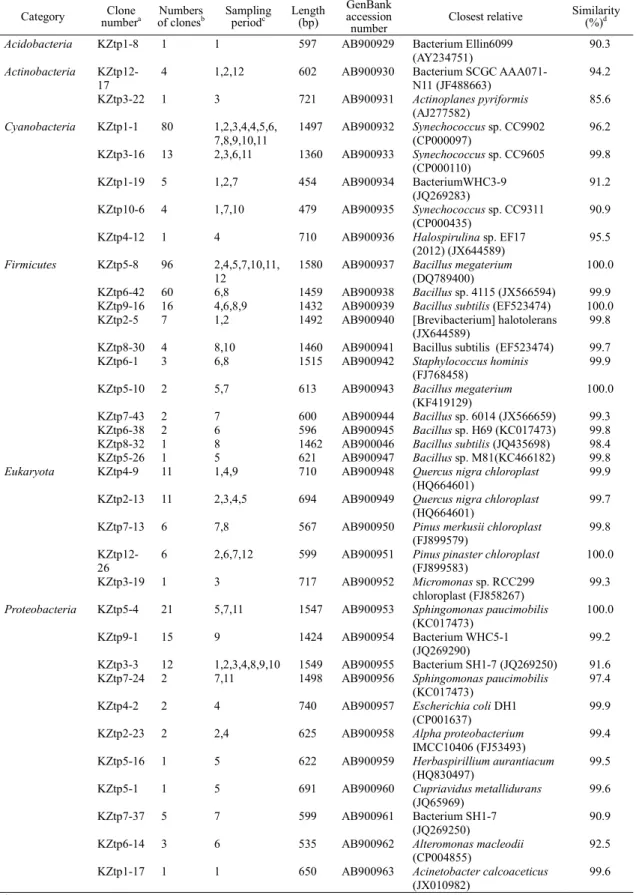
Table 2.1. Phylogenetic affiliation of 16S rDNA gene sequences obtained from clone libraries
Category Clone
numbera Numbers
of clonesb Sampling
periodc Length (bp)
GenBank accession
number Closest relative Similarity (%)d
Acidobacteria KZtp1-8 1 1 597 AB900929 Bacterium Ellin6099
(AY234751) 90.3
Actinobacteria KZtp12-
17 4 1,2,12 602 AB900930 Bacterium SCGC AAA071-
N11 (JF488663) 94.2
KZtp3-22 1 3 721 AB900931 Actinoplanes pyriformis
(AJ277582) 85.6
Cyanobacteria KZtp1-1 80 1,2,3,4,4,5,6,
7,8,9,10,11 1497 AB900932 Synechococcus sp. CC9902
(CP000097) 96.2
KZtp3-16 13 2,3,6,11 1360 AB900933 Synechococcus sp. CC9605
(CP000110) 99.8
KZtp1-19 5 1,2,7 454 AB900934 BacteriumWHC3-9
(JQ269283) 91.2
KZtp10-6 4 1,7,10 479 AB900935 Synechococcus sp. CC9311
(CP000435) 90.9
KZtp4-12 1 4 710 AB900936 Halospirulina sp. EF17
(2012) (JX644589) 95.5 Firmicutes KZtp5-8 96 2,4,5,7,10,11,
12 1580 AB900937 Bacillus megaterium
(DQ789400) 100.0
KZtp6-42 60 6,8 1459 AB900938 Bacillus sp. 4115 (JX566594) 99.9 KZtp9-16 16 4,6,8,9 1432 AB900939 Bacillus subtilis (EF523474) 100.0 KZtp2-5 7 1,2 1492 AB900940 [Brevibacterium] halotolerans
(JX644589) 99.8
KZtp8-30 4 8,10 1460 AB900941 Bacillus subtilis (EF523474) 99.7 KZtp6-1 3 6,8 1515 AB900942 Staphylococcus hominis
(FJ768458) 99.9
KZtp5-10 2 5,7 613 AB900943 Bacillus megaterium
(KF419129) 100.0
KZtp7-43 2 7 600 AB900944 Bacillus sp. 6014 (JX566659) 99.3 KZtp6-38 2 6 596 AB900945 Bacillus sp. H69 (KC017473) 99.8 KZtp8-32 1 8 1462 AB900046 Bacillus subtilis (JQ435698) 98.4 KZtp5-26 1 5 621 AB900947 Bacillus sp. M81(KC466182) 99.8 Eukaryota KZtp4-9 11 1,4,9 710 AB900948 Quercus nigra chloroplast
(HQ664601) 99.9
KZtp2-13 11 2,3,4,5 694 AB900949 Quercus nigra chloroplast
(HQ664601) 99.7
KZtp7-13 6 7,8 567 AB900950 Pinus merkusii chloroplast
(FJ899579) 99.8
KZtp12-
26 6 2,6,7,12 599 AB900951 Pinus pinaster chloroplast
(FJ899583) 100.0
KZtp3-19 1 3 717 AB900952 Micromonas sp. RCC299
chloroplast (FJ858267) 99.3 Proteobacteria KZtp5-4 21 5,7,11 1547 AB900953 Sphingomonas paucimobilis
(KC017473) 100.0
KZtp9-1 15 9 1424 AB900954 Bacterium WHC5-1
(JQ269290) 99.2
KZtp3-3 12 1,2,3,4,8,9,10 1549 AB900955 Bacterium SH1-7 (JQ269250) 91.6 KZtp7-24 2 7,11 1498 AB900956 Sphingomonas paucimobilis
(KC017473) 97.4
KZtp4-2 2 4 740 AB900957 Escherichia coli DH1
(CP001637) 99.9
KZtp2-23 2 2,4 625 AB900958 Alpha proteobacterium
IMCC10406 (FJ53493) 99.4 KZtp5-16 1 5 622 AB900959 Herbaspirillium aurantiacum
(HQ830497) 99.5
KZtp5-1 1 5 691 AB900960 Cupriavidus metallidurans
(JQ65969) 99.6
KZtp7-37 5 7 599 AB900961 Bacterium SH1-7
(JQ269250) 90.9
KZtp6-14 3 6 535 AB900962 Alteromonas macleodii
(CP004855) 92.5
KZtp1-17 1 1 650 AB900963 Acinetobacter calcoaceticus
(JX010982) 99.6
a Clones of 16S rDNA library were named as the KZtp series.
b The number of the clones in 16S rDNA clone libraries.
c Sampling period when the air sample was collected
d similarity value between each isolate and the closest relative in databases.
2.3 RESULT AND DISCUSSION
2.3.1 Environmental conditions
Relative humidity varied randomly around 40% during the sampling period, and the temperature from May 2 to May 5, 2011 fluctuated at lower values, below 20 ºC, than on May 1 and from May 6 to May 7 (Table 2.2). Some precipitation occurred on May 1, suggesting that a cyclonic flow originating from the western North Pacific or from the East China Sea contributed to rainfall in Kanazawa city on May 1. From the evening of May 1 to the morning on May 7, the days were sunny and calm.
Analyses of air-mass backward trajectories revealed four variations from May 1 to May 7, 2011 (Fig. 2.1). The air mass on May 1, 2011 originated from the North Pacific Ocean and passed the southern or western parts of Japan to Kanazawa city (Fig. 2.1a). In contrast, the air mass between May 2 and May 3 came from the desert area of the Asian continent and passed over the industrial area in China and across the Sea of Japan (Fig. 2.1b). From May 4 to May 5, the air mass was carried from the northern of the sea of Japan or Korea Peninsula to Kanazawa city for three days with low level transport over Korea and Japan (Fig.
2.1c). The air mass from May 6 to May 7 had a similar transport pattern to that of May 1 and came from the southern or western parts of Japan (Fig.2.1d). Changes in aerosol transportation are primarily controlled by the prevailing air flowing from China.
Fig. 2.1 Three-day backward trajectories of aerosols that arrived in Kanazawa city at altitudes of 10, 1,000, and 3,000 m from 5:00 JST to 18:00 JST on May 1, 2011(a), from 18:00 JST on May 1 to 24:00 JST on May 4 (b), from 24:00 JST of May 4 to 24:00 JST on May 5 (c) and from 0:00 JST to 24:00 JST on May 6 (d)
10m 1000m 3000m
(a)
(b)
(c)
(d)
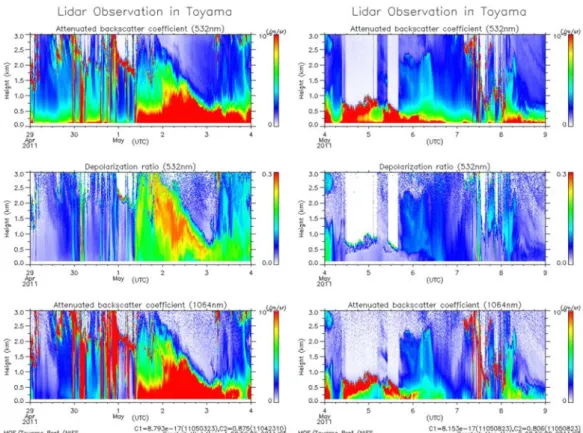
According to lidar measurement at Toyama city, Japan, the depolarization ratio at the ground surface was significantly increased from the evening of May 1 to the evening on May 4, in addition trajectory analysis indicated that the air mass during the period from May 1 to May 4 originated from west. This observation indicated that a long term Kosa event occurred during this time around the Hokuriku area (Fig. 2.3). The Kosa event period is occurred from the evening of May 1 to the evening on May 4.
Kosa carries such as bacteria, fungi, viruses, and mineral particles.
Bioaerosols play an important role in microbial dispersal and have a significant impact on ecosystems, human health, agricultural productivity and climate change in downwind areas (Jaenicke 2005; Brown and Hovmøller 2002). Outbreaks of Kosa over East Asian region are very frequent in the spring and last for a few days each time. In this study, the lidar measurements at Toyama city revealed that dust particles were transported to Hokuriku area (Kanazawa city) and that a Kosa event occurred between May 1 and May 4, 2011.
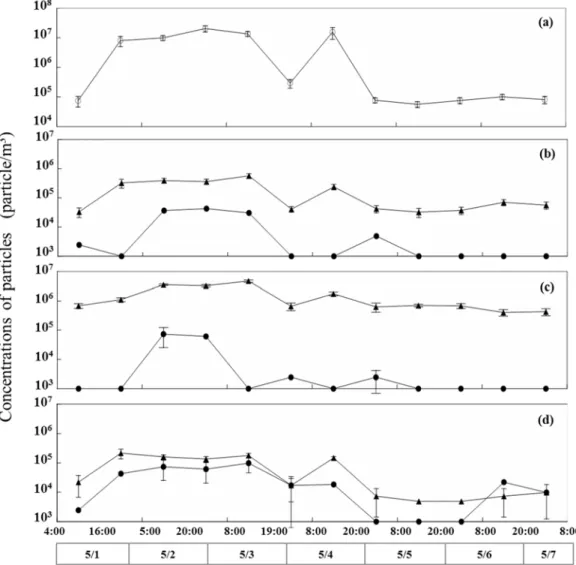
Fig. 2.2 Temporal variations of concentrations of all bacterial particles (open circles) (a), and white particles (closed circles) and yellow fluorescence particles (closed triangles) of 0.2-2.5 m (b), 2.5-5.0 m (c), and >5.0
m in diameter (d) in bioaerosol samples collected at 10 m altitude in Kanazawa city (1 – 7 May, 2011)
Fig. 2.3 Lidar observation of attenuated backscatter coefficient (532nm), depolarization ratio and attenuated backscatter coefficient (1064nm) in Toyama city from 0:00 in 29 Apr. 2011 to 0:00 in 4 May. 2011 (a) and from 0:00 in 29 Apr. 2011 to 0:00 in 9 May. 2011 (b)
2.3.2 Microscopic observation of aerosols
When DAPI staining of aerosol particles collected at 10 m in Kanazawa city was performed on the sampling filter, the aerosol comprised both separate and aggregated particle. White blue self-fluorescent particles, which were mineral particles, exhibited relatively large sizes, with diameters ranging from 0.2 µm to 100 µm. Yellow fluorescent particles, potentially organic matter, were observed to range from 0.2 µm to 10 µm in diameter. DAPI stained bacteria were observed as coccoid and bacilli like particle with a diameter of < 1.0 µm and bright blue fluorescence. These tree types of particles formed aggregated ranging from 2.0
µm to 100 µm in diameters. This indicated the bacterial particles attached to large particles were transported through the atmosphere.
The total density of bacterial cell in air samples increased from 7.5 × 10⁴ particles m-3 to 2.0 × 10⁷ particles m-3 during the Kosa event and decreased to 7.7
× 104 particles m-3 on non Kosa event day (Fig 2.2a). White blue fluorescent particles with diameters ranging from 0.2 µm to 5.0 µm significantly increased to 4.5 × 10⁶ particles m-3 during the Kosa event and decreased to 105 particles m-3 after the kosa event finished (Fig. 2.2b, c). White blue particles of > 5.0 µm diameters also increased to 7.4 × 10⁴ particles m-3 during the Kosa event but were less than 103 particles m-3 on non Kosa event day (Fig. 2.2d). Yellow fluorescent particles from 0.2 µm to 5.0 µm in diameter fluctuated from concentrations of more than 2.4 × 10⁵ particles m-3 to 104 particles m-3 during non Kosa event days (Fig 2.2b, c). Yellow fluorescent particles of >5.0 µm diameter peaked at approximately 4.3 × 10⁴ particles m-3 during the Kosa event and were undetectable on non Kosa event days (Fig 2.2d). The concentration of aggregated particles ranging from 0.2 µm to 5.0 µm in diameter increased to more than 1.4 × 10⁵ particles m3 during the Kosa event but maintained values in the order of 103 particles m-3 on non Kosa event days. Larger aggregated particles of >5.0 µm diameters significantly increased to 9.8 × 10⁴ particles m-3 during the Kosa event, decreasing to below limited detection on non Kosa event days and increasing to 2.2 × 10⁴ particles m-3 at the non Kosa event days May 6 and May 7.
Epifluorescence microscopy demonstrated that the several types of particles such as mineral particles (white particles), organic particles (yellow particles), and microbial particles were present in air samples collected at an
altitude of 10 m. DAPI stained particles with yellow fluorescence have been reported to resemble organic materials originating from proteins and others microbial cell components (Mostajir et al. 1995) and were observed to be present at the altitude of 3000 m over Suzu city Japan during a Kosa event (Maki et al.
2013).
The concentration of aerosol particles increased 10 to 100- fold during the dust event (Fig. 2.1). Kosa events have been reported to increase the biomass of airborne microorganisms in correspondence with the amount of mineral particle (Hara and Zhang 2012) and significantly change bacterial species structures in the free troposphere (Maki et al. 2013). The majority of phylotypes recovered from 12 samples belonged to the phyla Cyanobacteria, Alphaproteobacteria, and Firmicutes, and the bacterial compositions consisting of the members from the three phyla showed significant dynamics from the initiation of the Kosa to the days after the event had passed (Table 2.1, Fig. 2.4).
2.3.3 Dynamics of 16S rDNA clone libraries
The 16S rDNA fragment in the air samples were amplified by PCR using primers targeting eubacteria 16S rDNA. The PCR amplicons were cloned into E.
coli, and a total of 402 clones including eubacterial 16S rDNA fragment were obtained from the 12 samples. Sequences of the 16S rDNA clones indicated that the airborne bacterial populations were composed of several bacterial species (Table 2.1). Reasonable coverage ranging from 80% to 93% was obtained, indicating that the majority of the airborne bacterial were represented in the libraries. Most of the majority of phylotypes recovered from the air samples
belonged to the phyla Cyanobacteria, Proteobacteria, and Firmicutes, which are typically well represented in 16S rDNA clone libraries generated from terrestrial and marine environment. Only a few bacterial sequences were affiliated with Actinobacteria or Acidobacteria. The bacterial composition of the clone libraries showed significant dynamics during the sampling period (Fig. 2.4). Only 8 of the total 403 sequenced clones could not be affiliated with any known bacterial group.
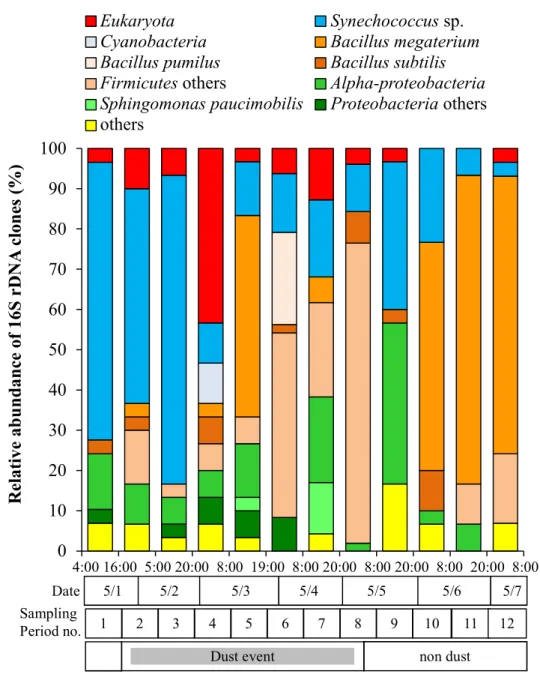
Fig. 2.4 Change in compositions of the partial sequences of 16S rDNA clones (Ca. 400 bp) obtained from air samples collected at 10 m altitude in Kanazawa city (1 – 7 May, 2011)
0 10 20 30 40 50 60 70 80 90 100
1 2 3 4 5 6 7 8 9 10 11 12
Relative abundance of 16S rDNA clones (%)
Eukaryota Synechococcus sp.
Cyanobacteria others Bacillus megaterium
Bacillus pumilus Bacillus subtilis
Firmicutes others Alpha-proteobacteria
Sphingomonas paucimobilis Proteobacteria others others
Eukaryota Cyanobacteria Bacillus pumilus Firmicutes others
Sphingomonas paucimobilis others
Synechococcus sp.
Bacillus megaterium Bacillus subtilis Alpha-proteobacteria Proteobacteria others
4:00 16:00 5:00 20:00 8:00 19:00 8:00 20:00 8:00 20:00 8:00 20:00 8:00 5/1 5/2 5/3 5/4 5/5 5/6 5/7 Date
1 2 3 4 5 6 7 8 9 10 11 12
Dust event non dust
Sampling Period no.
Of the sequences clones derived from all 12 samples, 27% were from Cyanobacteria (Table 2.1) and formed two distinct groups in the marine type cluster of the genus Synechococcus in the phylogenetic tree (Fig. 2.5). One group was composed of clones detected from Kosa event samples (Samples 3 and 5; Fig.
2.4). Sequences from this group clustered with the coastal and ocean Synechococcus spp. found in warm areas and were closely related to strains previously isolated from the Sea of Japan. In contrast, the sequences of the others group were detected in every sample and were mainly related to a coastal Synechococcus species found in cold environments.
More than 46.5% of the clones were from Firmicutes (Fig. 2.4), almost all of which were related to members from the genera Bacillus and Staphylococcus (>99.7% similarity). The complete 16S rDNA sequences of the Bacillus species has high similarities (>99.7%) with Bacillus subtilis, Bacillus pumilus and Bacillus megaterium (Fig. 2.6). Some of the B. subtilis and B. pumilus clones appeared specifically at night during the Kosa event (Samples 4 and 6) and were closely related with isolates detected at high altitudes above Suzu city during a Kosa event (Maki et al. 2008). Other clones belonging to the genus Bacillus were closely related to B. megaterium and were predominant in Samples 10, 11, and 12, which were obtained after the Kosa event has finished. Several minor clones were related to Staphylococcus hominis and increased in Sample 6, which was obtained during Kosa event.
Clones from Proteobacteria comprised 13.3% or the total clones (Table 2.1) and were mainly clustered in the genus Sphingomonas and the alphaproteobacteria SAR clade (Fig. 2.7). The clones affiliated with
Sphingomonas spp. were detected in almost all samples, and their numbers significantly increased at the end phase of Kosa event (Sample 9; Fig. 2.4). Some clones showed 99.8% similarity with some species of Sphingomonas found in the northern sea, whereas others clones were closely related to Sphingomonas paucimobilis. Clones from the Alphaproteobacteria SAR clade, which contains species unique to ocean environment at the Sea of Japan and Pacific Ocean had low similarities (<97.1%) with other members of the SAR clade, suggesting that these clones represent novel bacterial species in the SAR clade. These sequences appeared randomly throughout the Kosa event as <10%of the total clones in each sample (Samples 5 and 6) and significantly increased to 50% of the total after the Kosa event finished (Sample 8).
2.3.4 Dominated bacterial species in the air sample Cyanobacteria
Phylogenetic analysis showed that all the clones from Cyanobacteria formed two clusters in the marine genus Synechococcus spp. found in the Sea of Japan and East China Sea (Choi and Noh 2009) and coastal areas (Fuller et al.
2003; Fig 2.5). Kosa particles reaching Japan are mixed with seawater compounds when passing over the Sea of Japan (Zhang et al. 2006). Cyanobacteria including Synechococcus spp., are known to resistant to UV irradiation and oxygen stress because they have to eliminated excess peroxide generated from photosynthesis (Latifi et al. 2009; Perelman et al. 2003). In a previous study, marine microorganisms such as Cyanobacteria were shown to be transported by a Kosa event and comprised 20% of the clones libraries obtained from air samples
collected from Europe regions (Polymenakou et al. 2008). Clones affiliated with Synechococcus spp. dominated Sample 1 and 2, which had been collected during the first phase of Kosa event, and then decreased to no less than 30% during the sampling periods (Fig 2.4). It is likely that the front air mass of the Kosa event coming from the continental area would have blown the cells of marine Synechococcus spp., as well as sea water, up into the air; the cells and the seawater would subsequently have fallen down upon the downwind area.
Firmicutes
Sequences related to the Firmicutes members B. subtilis and B. pumilus comprised most of the 16S rDNA clones libraries from samples 6 and 8 (Fig 2.4 and 2.6), which had been taken at night during the Kosa event. This sample contained higher concentrations of aerosol particles than the others samples, in accordance with the occurrence of a Kosa event (Fig. 2.2). Some clones showed more than 99.7% similarity with B. subtilis and B. pumilus, which were predominant among aerosol collected at high altitudes above the Taklamakan desert (Maki et al. 2008), from an downwind area of Kosa even (Suzu city; Maki et al. 2010), and from the mineral particles collected from snow fall at Mountain Tateyama (Maki et al. 2011). Species related to B. subtilis were isolated from sand from Gobi desert (Hua et al 2007) and are reported to dominated in the surface air of Soul city during Kosa event (Jeon et al. 2011). It has been shown that Bacillus spp. carried by Kosa event were predominant in air sample taken during a free- tropospheric sampling carried out on a North America mountain (Smith et al.
2012). It has been shown that Bacillus spp. form resistant endospores to enhance
their survival in the atmospheres (Nicholson et al. 2000). Presumably, at night during the Kosa events, microbial particles such as B. subtilis and B. pumilus fell from the free troposphere to near ground surfaces levels in Kanazawa city.
Unlike to B. subtilis and B. pumilus, the Firmicutes species B. megaterium was found in the daytime during the Kosa event and dominated after the Kosa event finished. B. megaterium has rarely been detected at high altitudes above the Taklmakana Desert and Kosa arrival areas (Suzu city and Mt. Tateyama; Hua at al. 2007; Kakikawa et al 2009). Possibly, in the daytime, the upward flow of air caused by sunlight may contaminate the surface atmosphere with the local bacteria population from ground surfaces. The trajectories indicated that after the Kosa event finished, the air mass mainly remained around Japan for a few days.
Thus, it is possible that the B. megaterium detected in the sample originated from the local ground surface and was transported to the airborne bacterial communities by upper flow.
Alphaproteobacteria
The proportion of the clone libraries representing the Alphaproteobacteria members of the SAR clade and the genus Sphingomonas fluctuated from 135 to 25% and increased at the end phase of Kosa event and after the Kosa event finished (Samples 5, 6, and 9; Fig. 2.4 and 2.7). Members of SAR clade (Giovannoni and Stingl, 2005) and Sphingomos spp. (Eguchi et al. 1996) are known to be ubiquitous marine oligotrophic ultra microbacteria, which are thought to demonstrate improved survival at low substrate concentration. The SAR clade is composed of ubiquitous and unculturable marine bacteria detected in
the Sea of Japan (Song et al. 2009) and in ocean area such as the Pacific Ocean (Giovannoni and Stingl 2005). Member of Pelagibacter, including the SAR clade, occupy approximately 25-50% of marine bacteria in ocean areas, indicating their ability to survive in extreme environment (Morris et al. 2002). Sphingomonas spp. have also been identified as being an important part of marine bacterial plankton and are often found in marine bacterial communities from North Asian areas (Dieser et al. 2010) and the polar regions (Gloeckner et al. 2000).
Sphingomonas spp. are often found to comprise the dominant bacterial population in the free troposphere over Noto peninsula, Japan (Maki et al. 2013) and in cloud water (Amato et al. 2007). Sphingomonas spp. have been reported to be particularly resistant to elevated concentrations of oxidants such as hydrogen peroxide, one of the major sources of free radicals in cloud water, and to have the capacity to rapidly adapt to changing nutritive conditions (Eguchi et al 1996;
Ostrowski et al. 2001). Furthermore, some strains of Sphingomonas spp.. Have been repeatedly isolated from extreme and cold environments such as Arctic and Antarctic soils (Baraniecki et al. 2002) and Greenland ice core (Miteva et al.
2004). Bacterial populations that are resistant to various environment stressors in extreme environments, such as oceans or cold regions, would be able to extent their habitats efficiently via atmospheric transport.
Fig. 2.5 Phylogenetic tree including the partial sequences of 16S rDNA amplicons obtained from the clone libraries (Kzp series) from the bioaerosol samples collected in Kanazawa city and the known members of Cyanobacteria. The phylogenetic tree was calculated from a dissimilarity matrix of an approximately 1400 bp alignments (E. coli numbering 92 to 1475) using a neighbor-joining algorithm. The sample information and the accession number of each reference sequence are given in parentheses. Open circles at branch points indicate that bootstrap values obtained by neighbor-joining analysis exceeded 50%
(after 1000 resampling)
Synechococcus sp. KORDI 36 (FJ497746) Synechococcus sp. WH8012 (JQ421027) Synechococcus sp. UW122 (JQ421035) Synechococcus sp. KORDI 20 (FJ497717) Synechococcus sp. WH8002 (AY172833) Synechococcus sp. CC9605 (AY172802) Synechococcus sp. WH8109 (AY172836)
Synechococcus sp. MI0507A (FJ763782) Synechococcus sp. MW73D5 (AY151241) Synechococcus sp. MW74D3 (AY224200) Synechococcus PCC6307 (AF001477)
Cyanobacteria
Acidobacterium capsulatum (AB561885) Synechococcus sp. PS721 (AF216954)
Synechococcus sp. UW105 (JQ421034) Synechococcus sp. WH8016 (AY172834)
Synechococcus sp. UW179 (JQ421033) Synechococcus sp. RS9920 (AY172830) Synechococcus sp. RS9920 (AY172830) Synechococcus sp. UW180 (JQ421032)
Kzp3-6, 16
Synechococcus sp.
CC9311 (CP000435) Synechococcus sp.
CC9902 (CP000097) Synechococcus sp.
RS9915 (AY172825) Kzp6-29
Kzp8-24 Synechococcus KORDI 52 (FJ497721)
Kzp1-1 Kzp2-11 Kzp3-1 Kzp3-20 Kzp4-25 Kzp5-27 Kzp6-20 Kzp7-5 Kzp8-15 Kzp9-24 Kzp10-30 Kzp11-1 Kzp12-9 0.01
Fresh waterMarine
Fig. 2.6 Phylogenetic tree including the partial sequences of 16S rDNA amplicons obtained from the clone libraries (Kzp series) from the air samples collected in Kanazawa city and the known members of Firmicutes. The phylogenetic tree was calculated from a dissimilarity matrix of an approximately 1400 bp alignments (E. coli numbering 71 to 1432) using a neighbor-joining algorithm. The sample information and the accession number of each reference sequence are given in parentheses. Open circles at branch points indicate that bootstrap values obtained by neighbor-joining analysis exceeded 50% (after 1000 resampling)
0.01
Acidobacterium capsulatum
(AB561885) Staphylococcus sp. SRC DSF7 (GU797289) S. hominis GPL6 (FJ768458)
S. hominis (AJ717375) Kzp6-1, 11
Bacillus megaterium HNL16 (EU373355) B. megaterium S9
Bacillus sp. 4072 (JX566605) Kzp-7-43
Kzp-11-27 Kzp-11-9, 19
B. megaterium PRE9 (EU880506) Kzp-2-9
Kzp-5-19 Kzp-5-5
B. megaterium (DQ789400) B. megaterium BG-B62 B. megaterium GMX5 Kzp5-8, 20
Kzp12-10, 18, 28
B. stratosphericus CCM21B (FN433017) B. pumilus PRE14 (EU880532)
Kzp6-32, 42 Kzp8-33
B. aerophilus 20E (KC329821) B. pumilus (KC771046) Bacillus sp. 4115 (JX566594)
Bacillus sp. 4115 (JX566594)
B. licheniformis strain XJSL4-2 (GQ903411) B. subtilis strain N5 (DQ452510)
B. subtilis (FJ947049)
B. subtilis isolate IL4 (DQ989210) B. mojavensis (AM948970) B. subtilis CYBS-18 (JQ361067) Kzp2-5
Kzp4-6 Kzp5-26 Kzp6-15
Bacillus sp. ET (JQ513865) B. subtilis FS05 (JQ403532)
B. subtilis CU12 (JX489167) B. subtilis 10Szi-4 (AB740156 Kzp8-30, 32
B. subtilis (EF523474) B. subtilis (EU670049) B. subtilis (JF412545) B. subtilis (KC542358)
Kzp9-16
B. licheniformis strain H3 (FJ713021) B. subtilis (GU826163)
B. subtilis 10Szi-4
Staphylococcus B. megateriumB. pumilusB. subtilis Firmicutes