1
International review for spatial planning and sustainable development, Vol.1 No.4 (2013), 1-12 ISSN: 2187-3666 (online)
DOI: http://dx.doi.org/10.14246/irspsd.1.4_1
Copyright@SPSD Press from 2010, SPSD Press, Kanazawa
The Influence of Evapotranspiration by Urban Greenery on Thermal Environment in Urban Microclimate
Chih-Hong Huang1* and Pin-Yi Lin1
1Gradeate Institute of Architecture and Urban Design, National Taipei University of Technology
*Corresponding Author, Email: [email protected] Received 1 Feberuary 2013; Accepted 19 July 2013
Key words: Urban heat Island, Evapotranspiration Effect, Green Planting, Computational Fluid Dynamics, Urban Microclimate, Urban Thermal Environment.
Abstract: The purpose of this research is to discuss the phenomena and temperature induced by the evapotranspiration from urban street greenery and pavement construction. We expect to achieve a good ventilation and temperature reduction with the improvement of planting and the pavement material. This research utilized Penman-Monteith equation to calculate the calorie needed for the evaporation of plant and realized the temperature reduction effectiveness by the evapotranspiration in the high temperature urban area via Computational Fluid Dynamics simulation. The results show that the planting has significant influence on the urban temperature reduction and the evapotranspiration of plant can ease off the urban high temperature situation.
While under a windless condition, in compare with a windy environment which has better temperature reduction effect, the heat is difficult to dissipate due to the static status of the wind field. With regards to buildings, heat tends to accumulate at the windward and lee side of the building by eddy effect. For the future urban design code, the wind directing by plant and the ventilation of pedestrian wind field shall both being considered to alleviate the high temperature situation.
1. INTRODUCTION
With the process of urbanization, the tall dwelling buildings, business buildings and artificial pavement have gradually substitute the nature greenery and water area. Moreover, the air pollution caused by automobiles has made the heat coming from the solar radiation and artificial hear sources even more difficult to dissipate in the urban climate and worsens the urban thermal environment and reduces the human comfort feeling toward the environment.
In order to alleviate the urban thermal condition, scholars from many countries utilize the weather data, remote images, model simulation and site observation to probe into the research of heat island effect. Planting has been considered one of the most effective methods to improve the outdoor climate.
There are abundant studies of urban microclimate indicate that the raise in
“green coverage Ratio” could improve the urban temperature environment (Arnfield, 2003).
Previous Studies suggested that different planting models can reduce the urban temperature in a urban wind field and its arrangement, location,
evapotranspiration amount, solar radiation and the albedo of the surrounding pavement influence the temperature variation (Gromke et al., 2007; Lin et al., 2008; Fahmy et al., 2010).
The urban greening could efficiently reduce the load to the environment as well as having the function to modulate the urban microclimate, regulate the water and purify the air. Plants can absorb and reflect solar radiation to reduce the long wave radiation heat, and the shades generated by plants can block the direct sunlight to reduce the water dissipation from the air. The thermal environment becomes an important issue in urban design (Giridharana et al., 2007; Golany et al., 1996).
The urban microclimate effects seasonal outdoor thermal comfort a lot (Lin et al., 2011). It can lead to a rapid increase of energy consumption.
Lin et al. (2008) simulated and compared the urban temperature reduction effectiveness between bush, arbor and grass under the same surface area. By comparing grass with bush, the result showed an inapparent result in the improvement of human body thermal comfort by planting bushes around the buildings, which is due to the wind field speed reduction by the bushes and the sun position variation; while the grass has larger contact area which helps to remove the heat from the sun and improve the surrounding temperature.
However, as to the average temperature, growing arbor has significant efficiency in improving the temperature of pedestrian wind field. Comparing with bush, arbor has shade effect due to its height which can generate a low temperature condition in the shadow area by blocking the direct sun light. Moreover, different vegetation patterns, arrangement and orientation around the building could result in different effect on human body thermal comfort.
This research utilized the CFD technique and explored the influence of temperature reduction variation by urban pavement and vegetation and its arrangement on urban wind field and temperature field. At last we proposed a few suggestions on the application of vegetation regarding the control of urban microclimate wind field in order to meet the urban eco-construction principle.
2. METHODOLOGY
This research had precisely simulated every kinds of eddy current in the street through the CFD environmental interference model and realized how each environmental factor affects on current change, temperature reduction and energy dissipation via different parameter settings.
2.1 Wind Field Theory
In order to simplify the complex mixed flow field theoretical model, this research assumed a steady, three-dimensional and uncompressible turbulence model for numerical simulation in the analysis process.
Since the space is under the same atmosphere condition, we can treat it as an isothermal condition and calculate the flow field velocity and pressure with the continuous equation and momentum equation. For the turbulence simulation, we introduced k-ε turbulence model to analyse the wind field status.
The standard k-ε model is established on the turbulent kinetic energy k equation basis with the introduction of a turbulent dissipation rate ε equation. The k-ε model was firstly proposed by Launder and Spalding in 1972 and soon became a primary tool for engineering flow field calculation. The equations mentioned above are shown below.
Continuous Equation:
.
0
i i
x u
(1) Momentum Equation:
. )
) ( ) (
(
i j j i eff j i i j
j i
i x
u x u x
x g p x
u u u
t
(2) k-ε turbulence dual equation:
x . k σ μ μ ρε x
x P k u t
k
i k t i
i
i
(3)
x . ε σε
μt x μ
k ρε2 Cε2 k P Cε1 x u
t i i i
i
(4) In the above equations, ui denotes the velocity vector at j direction, while p, ρ, μeff, m and gi represent pressure, density, effective viscosity coefficient (incl.
both flow viscosity coefficient and turbulence viscosity coefficient, eff =
t
l
), material concentration mass fraction and gravity individually. In addition, μt= Cμ ρk2/ε, where k and ε denote the turbulence kinetic energy dissipation rate and turbulence kinetic energy generation rate individually. And the constants are set as Cμ=0.09, Cε1=1.44, Cε2=1.92, σk=1.0, σε=1.3, σl=1.0 and σt=1.0. The turbulence kinetic energy generation rate is represented by the following equation:
x . k u x
u x
u x
u x P u
m m i
j ij m m j
i i t j
3 2 3
2
(5) The numerical method introduced in this research is SIMPLEC algorithm, which was used to derive the govern equation to further calculated the wind field distribution in the simulation space. The procedure is to integrate the original equation with the transient term discretized by one order Backward Difference and the convection term by First-Order Upwind Scheme to meet the steady numerical calculation demand. After the completion of finite volume difference equation, the pressure value was revised using SIMPLEC algorithm to derive the velocity field.
2.2 Thermal Conduction Theory
The thermal conduction does not rely on medium movement, but is a kinetic energy transmission mechanism through the rapid oscillation and collision of the molecule of high temperature (or high kinetic energy) zone to that of the low temperature zone. Such conductive heat transmission principle is called Fourier law. The thermal energy transmitted by temperature gradient is called the sensible heat. The sensible heat flux of a unit area is shown as,
(6)
In the above equation, H denotes the sensible heat flux of the area (W m-2), CT denotes the thermal conductivity (Wm-1K-1) and T denotes the temperature (°K). In the model, we defined the vegetation volume as polypore material and the heat flux as a constant and set the parameters on the volume boundary. For such convectional heat flux setting, we calculated the convection of the external
environment, which is the computational mesh system outside the area, but not only calculate the surface thermal energy. The equation for calculating the conductive wall is,
(7) Where hc is the external conductivity and Text is the external temperature.
In this research, we considered the pavement of different material and excluded the influence of other factors and set the surface condition as isothermal, i.e. a constant value. The equation is shown as,
(8)
Where K denotes the conductivity of the fluid or the solid, Tc denotes the centre temperature and dx is the distance to the wall.
2.3 The calculation of vegetation evapotranspiration
The evapotranspiration is not only in relation to weather conditions, but also the water content in the soil, ground vegetation and the types or growing characteristics of vegetation. It is not always in proportion to the soil evapotranspiration. The water content of unit leaf area of the plant within a certain time is called the transpiration rate, and g/cm2/h is the unit often used.
The energy balance method is often used in many researches for computing the evapotranspiration of ground. We used the revised version of Penman equation - Penman-Monteith equation, to calculate the vegetation evapotranspiration, which uses the relations between aerodynamic resistance and the crop canopy resistance to substitute for the original wind speed function.
The Penman-Monteith Method was published by the International Committee of Irrigation and Drainage (ICID) in 1994, which was experimented the evapotranspiration on Lucerne and grass. The equation is as below (Allen et al., 1998).
(9)
Where EA is the evapotranspiration (mm/day); is the slope of vapor pressure curve (kpa/°C)’ r is the psychrometric constant (kpa/°C); u2 is the measured wind speed (m/sec) at 2 meter height; es-ea is the saturation vapor pressure and the actual vapor pressure (kpa).
For the field application, the equation (9) requires the daily, weekly, every ten days or monthly data of air, temperature, psychroradiation and wind speed (Allen et al, 1998).
3. THE SETTING OF SIMULATION PARAMETERS 3.1 The setting of space parameters
This research focused on the discussion of urban external flow field. In addition to the discussion goal setting, we need to establish a simulated air field. Hence, the boundary conditions for the external space establishment of the global simulation are defined as 1) the area of 996m×1449m×200m; 2) the total mesh count is 794.025 and 3) the minimum mesh distance is 0.15m on the no-slip condition, in order to obtain a more precise computation. Regarding the wind direction in the inlet, we focused on the U direction which is perpendicular to
the X axis which is parallel to the building group. The inlet wind speed is set to the average wind speed of 1m/s and 5m/s referring to the ground friction (Table 1.), where the 1m/s is a hypothetically defined minimum speed for the minimum wind in the urban wind field in order to derive a steady state solution, which was treated as the contrast group of the heat convection and conduction in the urban wind field under the windless state.
Table 1. The reference table of the wind speed of different heights under an average wind speed of 1m/s and 5m/s
Height 0 1.5 3 5 10 15 25 50 70 100
T1 0 0.39 0.46 0.52 0.62 0.69 0.78 0.93 1.01 1.11
T5 0 1.94 2.30 2.62 3.11 3.44 3.91 4.65 5.06 5.53
Unit: Height (m); Wind speed (m/s)
3.2 The setting of ground parameters
3.2.1 The setting of building surface parameters
The area of the simulated construction base in this research is 36m×39m, which was divided into six zones of the same size with each zone an identical building of 10m×10m×20m volume on top of it. There is a backyard in each zone and to the east of the base are a 3m wide sidewalk and a 30m wide road, which has 10m wide greenery along the both sides. The surface material of the building is defined as reinforced concrete with the wall thickness of 0.155m and the heat conductivity of 3.78 W/m2K. And the heat flux of the reinforced concrete wall is set to 0.61 W/m2K, which was referred to the thermal comfort data of the building surroundings simulated by Jiang He and Akira Hoyano. Therefore, these data was arranged as the reference data and entered to CFD simulation software in this research. (Hang et al., 2010)
3.2.2 The setting of pavement related parameters
In the urban environment, the wind filed generates different friction force over different pavement materials and the heat absorption and release vary in different ground materials due to different levels of water content. We adopted the heat flux of different pavement measured by Hueimin Huang as the reference for this research and considered the heat flux of asphalt and grass pavement as the reference data for the simulation. The grass evapotranspiration was set to 6.35(mm/day) referring to the evapotranspiration of Saint Augustine Grass deduced by C. Tang, et al. in 2005 using Penman- Monteith method and calculated the required energy for the evapotranspiration as the input data for the simulation software.
3.2.3 The setting of vegetation and evapotranspiration
The setting of vegetation covers many complex factors. Therefore, we chose the common sidewalk tree in Taipei - Alstonia scholaris, as the simulation basis and set the height of 10m with branches of 3m, the pore size of 0.6 and the permeability of 0.00009 to calculate the evapotranspiration of the simulated greenery surface area deduced from the data measured by Wang et al. (2005).
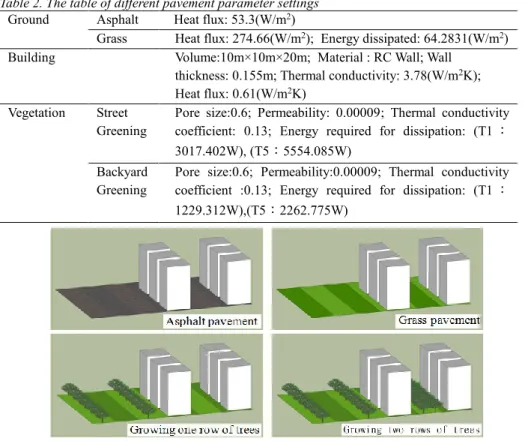
Since the evapotranspiration of vegetation is impacted by the factors such as sunlight and shading, we assumed noon time in this research to exclude the vegetation shading and sunlight issues (Bittelli et al., 2008). The relative parameters for the research model are arranged as Table 2.
3.3 The configuration of the simulation model
This research explored the change of wind field and temperature field by different pavement under a windless and windy condition in the urban environment (Baskaran et al., 1996). Hence, we defined the asphalt pavement as the basic condition and explored the scenarios as follows: grass pavement only, grass pavement with street greening (abbreviated as growing one row of trees), grass pavement, street greening and building backyard greening (abbreviated as growing two rows of tree). We calculated the temperature difference and the energy dissipation under various conditions and discussed the occurrence of evapotranspiration. There are 14 models and the simulation illustration of different pavements is shown in Fig. 1.
Table 2. The table of different pavement parameter settings Ground Asphalt Heat flux: 53.3(W/m2)
Grass Heat flux: 274.66(W/m2); Energy dissipated: 64.2831(W/m2) Building Volume:10m×10m×20m; Material : RC Wall; Wall
thickness: 0.155m; Thermal conductivity: 3.78(W/m2K);
Heat flux: 0.61(W/m2K) Vegetation Street
Greening
Pore size:0.6; Permeability: 0.00009; Thermal conductivity coefficient: 0.13; Energy required for dissipation: (T1: 3017.402W), (T5:5554.085W)
Backyard Greening
Pore size:0.6; Permeability:0.00009; Thermal conductivity coefficient :0.13; Energy required for dissipation: (T1: 1229.312W),(T5:2262.775W)
Figure 1. The simulation illustration of different pavement types
4. RESULTS AND DISCUSSIONS
This research simulated and analyzed how the temperature is influenced by vegetation dissipation, different wind speed and wind permeability. The results of each scenario are shown in the temperature line chart to compare the temperature influence by each factor.
Table 3. The table of the evapotranspiration of each pavement under different wind speed Windless
State
Asphalt (ori. state) Windy
State
Asphalt (ori. state) Asphalt (windy) Grass With (w/o)
evapotranspiration
Grass With (w/o) evapotranspiration One row
of trees
With (w/o) evapotranspiration
One row of trees
With (w/o) evapotranspiration
Two rows With (w/o) Two With (w/o)
of trees evapotranspiration rows of trees
evapotranspiration
4.1 The influence of evapotranspiration on thermal environment temperature reduction
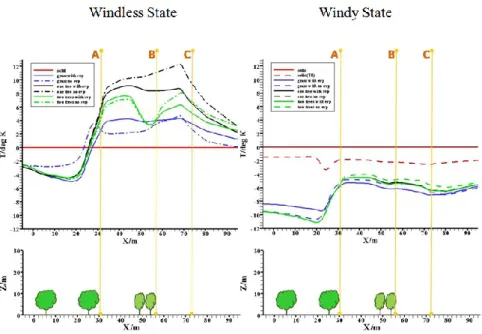
Generally speaking, the wider the vegetation area is, the larger the evapotranspiration becomes, which generate more cold air sources to reduce the temperature of the surroundings (Flor et al., 2004). In the research we compared the temperature reduction effectiveness by evapotranspiration in each wind field under the original state of windless and asphalt pavement condition and the temperature line chart for each state and the original state was plotted in a point- to-point way regarding the simulation of pedestrian wind field under two scenarios: 1.) the wind field penetrates the buildings (Fig. 2) and 2.) the wind field penetrates the streets (Fig. 3). The analysis result is as follows:
In Fig. 2 and Fig. 3, the observation point A is located on the sidewalk 1.5m ahead of the building group (X=31.5m), point B is located in the backyard of the building 1.5m ahead of the second row of building (X=57.5m) and point C is located 3m behind the building group (X=72m). In the comparison we found that there is a significant high temperature phenomenon behind the first row of building (point B) with vegetation pavement under a windless condition, where the highest temperature was observed in the condition of planting a row of trees (+8.37°C), while the grass pavement condition was inapparent in the temperature rising. In a windy environment, the average temperatures were all lower than the original state, where the lowest temperature zone was observed in front of the building group (X=20m) under the condition of planting two rows of trees, while the lowest temperature (-7°C ) was found in the grass pavement condition behind the building group (X=72m).
Figure 2. The comparison chart of the temperature difference for each pavement and the original state (asphalt) when the wind field penetrates the streets (y=16.5m)
Regarding the vegetation evapotranspiration (Picot et al., 2004), the temperature rising is more apparent without evapotranspiration in contrast to with evapotranspiration in each kind of pavement under a windless condition, where the temperature difference due to evapotranspiration in the condition of planting a row of trees reached 2.86°C (point B) and there is also a difference of
3.02°C behind the building group (point C). In a windy state the wind field helps reduce the temperature of the asphalt pavement and the situation is more apparent with evapotranspiration in contrast to a windless and non- evapotranspiration condition regarding the grass and vegetation pavement (Robitu et al., 2006). Thus, the evapotranspiration of vegetation pavement could bring the water into the flow field to reduce the surrounding temperature.
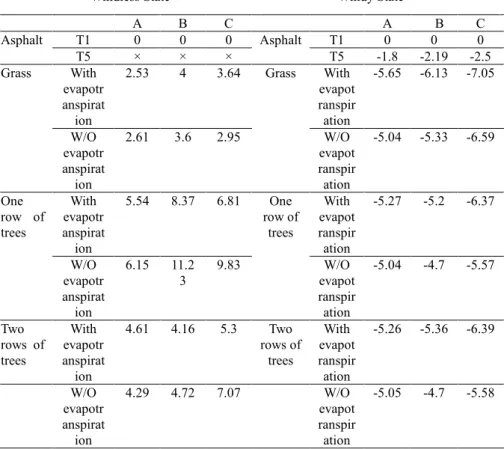
Table 4. The comparison table of the temperature difference for each pavement and the original state (asphalt) when the wind field penetrates the streets (y=16.5m)
Windless State Windy State
A B C A B C
Asphalt T1 0 0 0 Asphalt T1 0 0 0
T5 × × × T5 -1.8 -2.19 -2.5
Grass With evapotr anspirat ion
2.53 4 3.64 Grass With
evapot ranspir ation
-5.65 -6.13 -7.05
W/O evapotr anspirat ion
2.61 3.6 2.95 W/O
evapot ranspir ation
-5.04 -5.33 -6.59
One row of trees
With evapotr anspirat ion
5.54 8.37 6.81 One row of
trees
With evapot ranspir ation
-5.27 -5.2 -6.37
W/O evapotr anspirat ion
6.15 11.2 3
9.83 W/O
evapot ranspir ation
-5.04 -4.7 -5.57
Two rows of trees
With evapotr anspirat ion
4.61 4.16 5.3 Two rows of
trees
With evapot ranspir ation
-5.26 -5.36 -6.39
W/O evapotr anspirat ion
4.29 4.72 7.07 W/O
evapot ranspir ation
-5.05 -4.7 -5.58
Unit: (°C)
Figure 3. The comparison chart of the temperature difference for each pavement and the
original state (asphalt) when the wind field penetrates the buildings (y=23m)
Table 5. The comparison table of the temperature difference for each pavement and the original state (asphalt) when the wind field penetrates the buildings (y=23m)
Windless State Windy State
A B C A B C
Asphalt T1 0 0 0 Asphalt T1 0 0 0
T5 × × × T5 -1.8 -2.19 -2.5
Grass With
evapotranspiration
4.82 0.73 0.81 Grass With
evapotranspiration
5.64 -6.12 -7.05 W/O
evapotranspiration
1.21 2.37 -0.22 W/O
evapotranspiration -5.04 -5.33 -6.58 One row
of trees With
evapotranspiration
9 3.28 1.76 One row of trees
With
evapotranspiration
-5.26 -5.23 -6.36 W/O
evapotranspiration
9.85 6.23 2.63 W/O
evapotranspiration -5.04 -4.7 -5.59 Two
rows of trees
With
evapotranspiration
7.72 12.48 1.75 Two rows of trees
With
evapotranspiration
-5.26 -5.36 -6.39 W/O
evapotranspiration
7.24 23.57 2.32 W/O
evapotranspiration -5.05 -4.7 -5.58 Unit: °C
4.2 The influence of wind speed on each kind of pavement
According to the simulation data, the wind field makes the air flow better in the urban environment and results in a larger temperature reduction. From Fig. 4 we see an apparent temperature reduction effect n the windy state in each kind of pavement, among which the planting two rows of trees has 7.04°C drop, followed by the planting one row of trees with 7.01°C drop. Thus it can be seen that the wind field blowing could bring a good and apparent temperature reduction effect for the urban environment.
Figure 4. The comparison chart of the temperature difference between each pavement and the original state (asphalt) in the pedestrian wind field
4.3 The influence of urban environment permeability on the temperature field
From Table 4 and 5 we can see that the flow stream distribution of the wind field and the temperature change are interfered by the buildings. In the more penetrable streets, despite the wind field is affected by the surrounding buildings,
the high temperature situation is less severe with its penetrability. Table 6 is the comparison table shows the generated highest temperature of each pavement under the condition of being blocked by the buildings and in the street wind field. The result indicates that the highest temperature in the street is lower than that of being blocked by the buildings, which suggests that a well-ventilated environment facilitates the temperature reduction effect (Huang et al., 2005);
also we found that planting two rows of trees appears the best temperature reduction effect, which implies that the vegetation arrangement shall be accompanied with a well-ventilated environment to soothe the urban high temperature phenomenon with wind field blowing.
Table 6. The comparison table of the generated highest temperature of each pavement in the buildings and streets
Pavement type
Asphalt Grass One row of
trees
Two rows of trees Windless
State
y=23 40.58 41.96 47.07 51.41
y=16.5 39.15 42.83 47.09 44.79
Temp. Diff. -1.43 0.87 0.02 -6.62
Windy State y=23 37.7 33.58 32.57 33.4
y=16.5 36.89 33.56 32.73 32.7
Temp. Diff. -0.41 -0.02 0.16 -0.7
Unit:(°C)
5. CONCLUSION
This research explored the temperature reduction effect generated by the evapotranspiration of pavement and vegetation arrangement under different wind state and introduced CFD numerical simulation method to analyze the influence of different wind field (windless and windy), pavement arrangement (asphalt, grass, street greening, street greening and backyard greening behind building) and evapotranspiration (with or w/o) etc. on wind speed, temperature and heat energy. The result is concluded as the following items.
The water generated by the vegetation evapotranspiration in the urban environment could decrease the temperature of the surroundings and soothe the high temperature phenomenon, while the temperature reduction is in apparent without evapotranspiration.
With the blowing of wind field, the cold air is formed by the evapotranspiration of each pavement and influences the surrounding high temperature area to improve the environmental thermal comfort by reducing 4°C-6°C in average under a windy condition.
Comparing the temperature reduction effect with the original state, the grass and vegetation pavement could facilitate the temperature reduction effect. And since the grass pavement has better wind field penetration than the vegetation pavement which blocks the wind field flowing, there is a significant temperature reduction effect between the buildings.
The vegetation evapotranspiration provides water content to the environment to reduce the surrounding temperature and the effect would become more apparent if it is accompanied with smooth wind field. Therefore, the vegetation arrangement shall be considered together with well-ventilated environment in order to soothe the urban high temperature phenomenon with the wind field blowing.
In the urban environment, the heat tends to accumulate on the lee side of the building due to slow wind speed. The flow field is nearly static in the windless state, which makes it difficult for heat dissipation and results in high temperature
and poor temperature reduction effect.
In the urban design, the vegetation arrangement shall not only considers the visual beautification of the landscape, but also the functions of wind flow and temperature reduction to improve the environmental comfort in a nature way.
Regarding the urban design code for vegetation and pavement arrangement, this research refer to the temperature reduction effect on hot environment induced by the evapotranspiration of vegetation and pavement in the urban area and propose the following suggestions:
The evapotranspiration of vegetation has temperature reduction effect on urban hot environment and the effect could become more apparent with the blowing of the wind field. Hence, for the future vegetation design we shall consider the building arrangement and the different wind direction to create a good wind blowing effect in the urban space and achieve the purpose of reducing the surrounding high temperature.
Since the grass pavement has higher penetrability and less interference to the smooth blowing of the wind field, a good temperature reduction effect could be obtained. We suggest introducing more nature pavement materials in future urban design to increase the water content of the ground, which could provide cold air sources for the urban high temperature environment and improve the environmental thermal comfort.
Since the windward and lee side of the building and the pedestrian wind filed are all observed the significant heat accumulation condition, we suggest to consider the ventilation effect in the building’s arcade design to remove the accumulated heat on the building surface as well as the pedestrian wind field via the wind field.
AKNOWEGMENT
This study was funded by the National Science Council (NSC 101-2627-E-027- 002-MY3). We are deeply grateful for the support provided.
REFERENCES
Allen, R.G., Pereira, L.S., Raes, D., Smith, M. (1998). “Crop evapotranspiration, guidelines for computing crop water requirements”, FAO Irrig. and Drain. Paper 56, 300, Food and Agric. Orgn. of the United Nations, Rome, Italy.
Arnfield, J. (2003). “Review two decades of urban climate research: A review of turbulence, exchanges of energy and water, and the urban heat island”, Int. J. Climatol., 23, 1-26.
Baskaran, A. and Kashef, A. (1996). “Investigation of air flow around buildings using computational fluid dynamics techniques”, Engineering Structures, 18(11), 861-875.
Bittelli, M., Ventura, F., et al. (2008). “Coupling of heat, water vapor, and liquid water fluxes to compute evapotranspiration in bare soils”, Journal of Hydrology, 191-205.
Fahmy, M., Sharples, S., et al. (2010). “LAI based trees selection for mid latitude urban development: A microclimatic study in Cairo, Egypt”, Building and Environment, 45(2), 345-357.
Flor, F.S. de la and Dom´ınguez, S.A. (2004). “Modelling microclimate in urban environments and assessing its influence on the performance of surrounding buildings”, Energy and Buildings, 36(5), 403-413.
Giridharana, R., Laua S.S.Y., et al. (2007). “Urban design factors influencing heat island intensity in high-rise high-density environments of Hong Kong”, Building and Environment, 42(10), 3669-3684.
Golany, G.S. (1996). “Urban design morphology and thermal performance”, Atmospheric Environment, 30(3), 45-65.
Gromke, C. and Ruck, B. (2007). “Influence of trees on the dispersion of pollutants in an urban street canyon—Experimental investigation of the flow and concentration field”, Atmospheric Environment, 41, 3287-3302.
Hang, J., Li, Y., et al. (2010). “Wind conditions and ventilation in high-rise long street models”, Building and Environment, 45, 1353-1365.
Huang, H., Ooka, R., et al. (2005). “Urban thermal environment measurements and numerical simulation for an actual complex--urban area covering a large district heating and cooling system in summer”, Atmospheric Environment, 39, 6362-6375.
Lin, B., Li X.F., et al. (2008). “Numerical simulation studies of the different vegetationpatterns' effects on outdoor pedestrian thermal comfort”, Journal of Wind Engineering and Industrial Aerodynamics, 96(10-11), 1707–1718.
Lin, T.P., Dear, R. de, et al. (2011). “Effect of thermal adaptation on seasonal outdoor thermal comfort”, Int. J. Climatol., 31, 302–312.
Picot, X. (2004). “Thermal comfort in urban spaces: impact of vegetation growth Case study:
Piazza della Scienza, Milan, Italy”, Energy and Buildings, 36(4), 329-334.
Robitu, M., Musy, M., et al. (2006). “Modeling the influence of vegetation and water pond on urban microclimate”, Solar Energy, 80(4), 435-447.
Tang, C., Hsu, S.H., et al. (2007). “Comparison of Different Methods in Evapotranspiration Estimation from St. Augustine Pasture”, Crop, Environment & Bioinformatics, 4, 151-160.
Wang, Y., Liu, H., et al. (2005). “Study on Carbon Dioxide Fixation Efficiency of sidewalk trees Alstonia scholaris”, Quarterly Journal of Chinese Forestry, 38(3), 279-290.