Introduction
The purpose of the EAP program of Akita University is to help students to acquire academic skills as well as English skills that they need to function in various courses of the university in the subsequent years. The present paper reports on part of the evaluation study of the program by referring to the scores of the tests that were carried out at the beginning and the end of the 2005 academic year. Besides the evaluation of the initial year of the program, the results of the placement test of the second year that started in the April of 2006 are also reported.
The EAP Program of Akita University
The EAP (English for Academic Purposes) Program of Akita University was implemented in 2006, as a result of long-term informal and formal
observations and experiences of the teaching staff, who had been involved in the English teaching program for a number of years. A brief description of the rationale for the curricular innovation is in order below.
In 1997 major curricular changes were made involving all the three departments of the university.
The English program was also innovated in various ways. The most important changes were as follows: 1) a common textbook should be used by all teachers, 2) the same test should be administered to all the twenty- one classes, each of which was taught by different teachers, 3) a common set of criteria should be used when giving a final grade, and 4) a listening course be offered during the first term, and a writing course be offered during the second term, on the assumption that the input practice would lead up to a production practice.
The effectiveness of the program was observed particularly in the following areas.
秋 田 大 学 教養基礎教育研究年報 61 − 67 (2007)
Evaluating the EAP Program of Akita University–the Second Round Study
教養基礎科目『大学英語Ⅰ』の効果検証
渡部 良典
Yoshinori WATANABE
抄 録
教養基礎科目『大学英語I』および『大学英語2』の効果検証結果の一部を報告する。当科目は2004年
度まで行われていた『英語リスニング』、 『英語ライティング』を改変させ、2005年度から実施された全
学部1年生必修の科目である。2005年4月学年当初に行ったクラス編成テスト、および2006年2月学年
末に行った学年末テストの結果をもとに初年度の効果を検証した。その結果読解能力、聴解能力には有
意に向上したが、語彙・文法に関しては変化が見られなかった。さらに2006年度のテスト結果について
は次年度からの結果を比較検証するための基礎データとして使用されるよう、基本統計を報告した。効
果をさらにきめ細かく検証するために授業観察、面接調査などを行うことが望まれる。
1 ) Cooperation among the staff was promoted during the process of selecting a common textbook.
2 ) Cooperation among the staff was enhanced also during the process of constructing a common course-wide test by a group of a committee, which subsequently is going through an inspection among the whole staff.
3 ) By employing a common textbook, better communication was achieved among the staff.
Each individual teacher had a chance to talk to an other staff member whenever he or she had a problem in his or her teaching, when he or she had identified problems with the textbook.
4 ) The students improvement in English ability was measured by a common sent of standars, so it become possible to assess the effectiveness of the program (see Watanabe, 2004).
5 ) The final course grade was assigned on the basis of a common set of criteria, so a sense of unfairness had greatly been decreased among the students.
Despite the effectiveness of the program, however, it gradually became apparent that the program was not working as it had been expected to be in various aspects. First, it was noticed that for the students to transfer the knowledge and skills that they should have acquired in the first term to those which they would acquire in the second term, the topic and skills need to be connected in some way or other between the two terms. In the absence of such a connection between the two sets, two courses were taught as if they were independent courses, contrary to the original intention. The second major reason for the dissatisfaction of the course is that students were remarkably different in the levels of English proficiency. A number of students are highly proficient in English, whereas other students are very low, so teachers would often complain that many students, particularly good students, suffer. And yet, even low students have to take the course, so the course should be so constructed that it may be rewarding to them in a way in which it helps them to be prepared to accomplish major courses that they will take during the subsequent years at university. Thirdly, the greatest
emphasis of the curriculum was placed on the acquisition of language skills. However, recent research indicates that language learning is enhanced when it is learned with some specific contents. This also appeals to our common sense that we can best learn a language to use it for some purposes.
To improve the 1997 program, a new curriculum was proposed in 2004 and implemented in the 2005 academic year. The course is based on the following principles. First, the materials should be the oncs which will help students acquire knowledge of specific academic topics in English. Second, English should be taught in combination with some academic skills such as note-taking, critical thinking, data gathering, synthesizing data, interviewing, presentation, writing a short report, and so forth. Third, all the four skills (i.e., reading, listening, writing, and speaking) should be taught simultaneously. Fourth, each student should be placed in a course where he or she may receive the most appropriate instruction that suits his or her level of English proficiency.
Results of Round 1 Evaluation Study
In this section, the effectiveness of the program is reported of the academic year 2005 based on the results of the pre- and post-course tests. The placement tests used were the A.C.E. test, a proficiency test developed by an NPO association called ELPA (English language Proficiency Assessment). Three different versions of the test were administered, but the degree of difficulties had been equated by the latent trait measurement or the Item Response Theory (e.g., Henning, 1987).
Notice that all the three tests were of the same
type, but scoring procedures were different for the
2005 tests and the 2006 test for various practical
reasons. Thus, it is not possible to compare the changes
in test scores over the two years, although it is hoped
that as the test will be administered in the future, the
present data will serve as a baseline data against which
the future test scores will be plotted. For the sake of
clarity, the results will be presented and discussed
separately for the 2005 and 2006 tests. Meanwhile, the
2005 data will be used to evaluate the effectiveness of the course by comparing the two sets of scores that were obtained at the beqqininq of the caurse in April 2005 and at the ehd of the course in February 2006.
Basic statistics of the 2005-2006 first year students
The 2005-2006 test results are presented and discussed in comparative forms. Table 1 shows that mean scores significantly increased in the total, in
Listening, and in Reading. The results indicate that the program was effective in helping students improve in these areas. However, the scores of the Vocabulary and Grammar component slightly decreased, although difference was not statistically significant. This means that the program did not sncceed in helping students to improve in vocabulary and grammar. In order to examine the result in somewhat greater detail, it may be useful to break down the scores by departments. The results are provided in Table 2.
The scores were significantly different between three departments (Table 2), the scores of School of Medicine being on the top, and the Faculty of
Education & Human Studies and the Faculty of Engineering and Natural Resources followed in this order.
Table 1 : Basic Statistics for the 2005−2006 EAP Course Evaluation
Mean SD Min Max Gain t df
Listening 1 9.63 2.22 0 14
Listening 2 10.17 2.55 0 14 0.54 5.30 *** 763
Vocabulary & Grammar 1 19.12 4.72 1 30
Vocabulary & Grammar 2 19.09 4.85 0 30 0.03 0.40 763
Reading 1 11.65 2.81 0 16
Reading 2 12.42 2.97 0 16 0.77 7.33*** 763
Total 1 40.40 8.03 10 59
Total 2 41.68 8.51 3 60 1.28 5.19*** 772
Notes. n = 757. Max = Maximum score. Min = Minimum score. 1 = The first round test that was administered on the first day of the course in April, 2005. 2 = The second round test that was carried out on the last day of the course in February, 2006. *** = p < .001 (two-tailed).
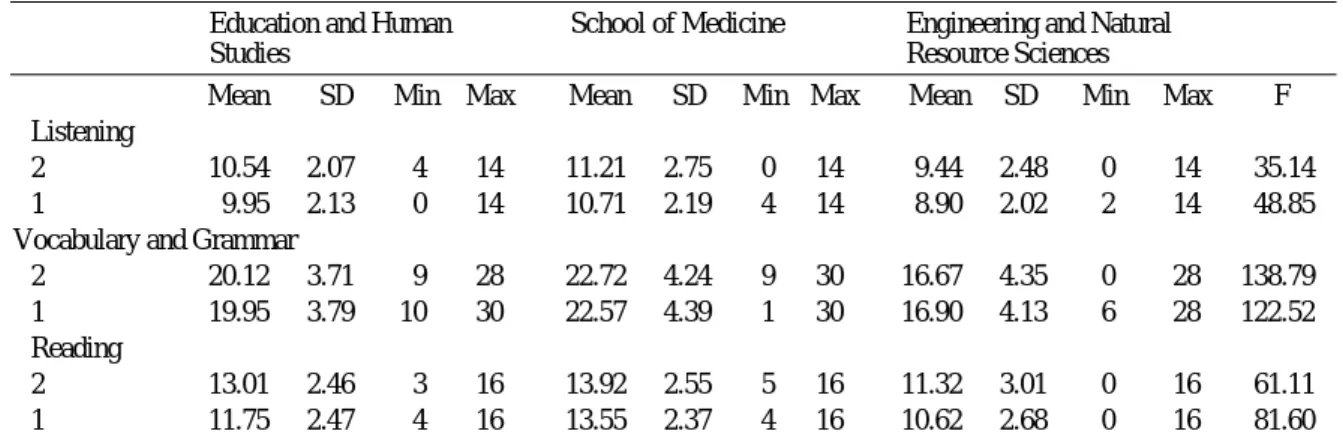
Table 2 : Breakdown of Descriptive Statistics of the 2005−2006 EAP course by Departments
Education and Human School of Medicine Engineering and Natural
Studies Resource Sciences
Mean SD Min Max Mean SD Min Max Mean SD Min Max F Listening
2 10.54 2.07 4 14 11.21 2.75 0 14 9.44 2.48 0 14 35.14
1 9.95 2.13 0 14 10.71 2.19 4 14 8.90 2.02 2 14 48.85
Vocabulary and Grammar
2 20.12 3.71 9 28 22.72 4.24 9 30 16.67 4.35 0 28 138.79 1 19.95 3.79 10 30 22.57 4.39 1 30 16.90 4.13 6 28 122.52 Reading
2 13.01 2.46 3 16 13.92 2.55 5 16 11.32 3.01 0 16 61.11 1 11.75 2.47 4 16 13.55 2.37 4 16 10.62 2.68 0 16 81.60 Notes. 1. = The score of the test that was administered in April 2005. 2 = The score of the test that was administered in February 2006. Max = Maximum score. Min = Minimum score. n of Education and Human Studies = 207. n of School of Medicine = 185. n of Engineering and Natural Resource Sciences = 365. df = 756. p < .001.
It may be worth examining if the score increases were significant in each division. Because similar tendencies were observed in all the three departments,
it could be concluded that the program was not
successful in the area of vocabulary and grammar.
Table 3: Paired Samples Statistics
Gain SD t df
Education and Human Studies
Listening 0.59 2.28 3.72*** 206
Vocabulary and grammar 0.16 3.28 0.72 206
Reading 1.26 2.39 7.56*** 206
Total 2.01 4.98 5.80*** 206
Engineering and Natural Resources
Listening 0.50 3.00 2.28** 184
Vocabulary and grammar 0.15 3.59 0.57 184
Reading 0.37 2.33 2.18** 184
Total 1.03 6.15 2.27** 184
School of Medicine
Listening 0.50 3.00 0.94 2.28
Vocabulary and grammar 0.15 3.59 0.67 0.57
Reading 0.37 2.33 0.71 2.18
Total 1.03 6.15 1.92 2.27
Note. * = p < .05. ** = p < .01. *** = p < .001. (two-tailed).
Table 4 : Descriptive Statistics for the 2006−2007 EAP Course Evaluation
Minimum Maximum Mean SD Reliability (α)
Listening 22 100 60.16 14.17 0.557
Vocabulary 10 50 33.39 8.04 0.609
Grammar 5 50 29.48 8.06 0.753
Reading 10 100 55.09 15.80 0.704
Total 93 300 178.13 38.00 0.876
Note. n = 897.
Table 5 : Basic statistics of the 2006 Placement Test with ANOVA results
Education and Human School of Medicine Engineering and Natural
Studies Resource Sciences
Mean SD Min Max Mean SD Min Max Mean SD Min Max F Listening 62.33 14.13 29 100 69.61 14.71 40 100 55.12 11.40 22 100 93.07 Vocabulary 34.02 6.98 21 50 41.54 6.52 26 50 29.63 6.26 10 50 237.62 Grammar 30.00 6.40 15 50 37.88 7.98 5 50 25.66 5.68 11 45 255.19 Reading 57.24 12.56 21 100 70.73 16.32 34 100 47.42 11.01 10 79 239.45 Total 183.58 29.64 120 274 219.76 35.56 146 300 157.82 25.03 93 239 330.32 Notes. n of total = 897. n of Education and Human Studies = 224. n of School of Medicine = 201. n of Engineering and Natural Resource Sciences = 472. p < .001.
The Analysis of the 2006 April Test Scores
Because the data of the 2006 test were limited to the one that was gained from its first administration in the April of 2006, the presentation of the data is inevitably
descriptive. Note that as stated at the beginning of this paper, the scores were marked by the computer, and thus this time it was possible obtain reliability as well as other basic statistics (Table 4).
Basic statistics are provided by breaking down them by departments in Table 5, so the test scores of the future students may be compared with the present data. Incidentally, the test scores again indicate that the proficiency levels were significantly different betweer
three departrnents. Post Hoc test (the Schefee test)
further indicates that the scores were higher in School
of Medicine, Faculty of Education and Human Studies,
and Faculty of Engineering and Natural Resource
Sciences in this order.
It may be also worth noting here that in 2006 one advanced course was prepared for the groups of students from Faculty of Education and Human Studies and from School of Medicine (Nursing), and two advanced courses were prepared for the students of Faculty of Engineering and Natural Resource Sciences.
The basic statistics are presented in Tables 6, 7, and8,
so it may show how the scores of the advanced groups of students were different from those of regular classes.
Note that a total of twenty-one classes are taught by different teachers, though there were cases where one teacher was teaching two classes.
The scores of the advanced groups of students were obviously higher than those of the other groups of
Table 6 : Basic Statistics for All Classes (Total)
Total (n = 897) Listening Vocabulary Grammar Reading Total
Mean 60.16 33.39 29.48 55.09 178.13
SD 14.17 8.04 8.06 15.80 38.00
Median 59.00 34.00 29.00 53.00 172.00
Grouped Median 58.45 32.70 28.42 52.85 172.26
Minimum 22.00 10.00 5.00 10.00 93.00
Maximum 100.00 50.00 50.00 100.00 300.00
Range 78.00 40.00 45.00 90.00 207.00
Kurtosis 0.46 -0.41 0.22 0.69 0.33
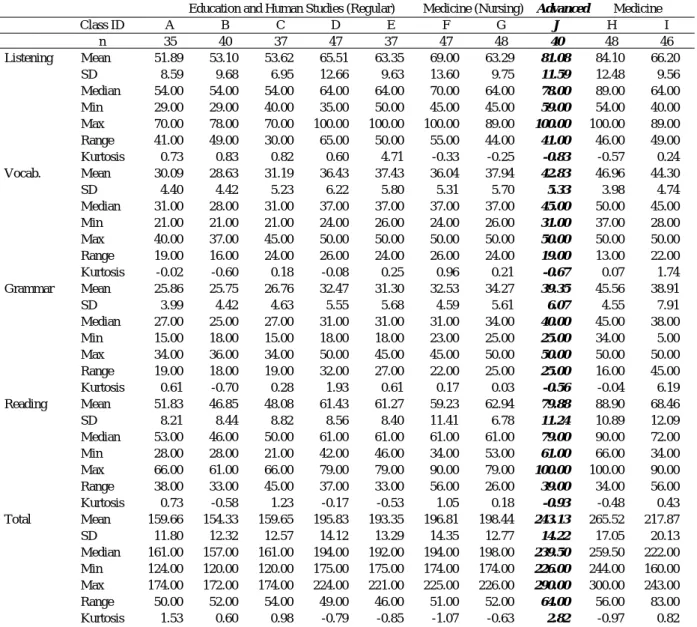
Table 7 : Basic Statistics for All EAP Classes (Faculty of Education and Human Studies and School of Medicine)
Education and Human Studies (Regular) Medicine (Nursing) Advanced Medicine
Class ID A B C D E F G J H I
n 35 40 37 47 37 47 48 40 48 46
Listening Mean 51.89 53.10 53.62 65.51 63.35 69.00 63.29 81.08 84.10 66.20 SD 8.59 9.68 6.95 12.66 9.63 13.60 9.75 11.59 12.48 9.56 Median 54.00 54.00 54.00 64.00 64.00 70.00 64.00 78.00 89.00 64.00 Min 29.00 29.00 40.00 35.00 50.00 45.00 45.00 59.00 54.00 40.00 Max 70.00 78.00 70.00 100.00 100.00 100.00 89.00 100.00 100.00 89.00 Range 41.00 49.00 30.00 65.00 50.00 55.00 44.00 41.00 46.00 49.00 Kurtosis 0.73 0.83 0.82 0.60 4.71 -0.33 -0.25 -0.83 -0.57 0.24 Vocab. Mean 30.09 28.63 31.19 36.43 37.43 36.04 37.94 42.83 46.96 44.30
SD 4.40 4.42 5.23 6.22 5.80 5.31 5.70 5.33 3.98 4.74 Median 31.00 28.00 31.00 37.00 37.00 37.00 37.00 45.00 50.00 45.00 Min 21.00 21.00 21.00 24.00 26.00 24.00 26.00 31.00 37.00 28.00 Max 40.00 37.00 45.00 50.00 50.00 50.00 50.00 50.00 50.00 50.00 Range 19.00 16.00 24.00 26.00 24.00 26.00 24.00 19.00 13.00 22.00 Kurtosis -0.02 -0.60 0.18 -0.08 0.25 0.96 0.21 -0.67 0.07 1.74 Grammar Mean 25.86 25.75 26.76 32.47 31.30 32.53 34.27 39.35 45.56 38.91
SD 3.99 4.42 4.63 5.55 5.68 4.59 5.61 6.07 4.55 7.91 Median 27.00 25.00 27.00 31.00 31.00 31.00 34.00 40.00 45.00 38.00 Min 15.00 18.00 15.00 18.00 18.00 23.00 25.00 25.00 34.00 5.00 Max 34.00 36.00 34.00 50.00 45.00 45.00 50.00 50.00 50.00 50.00 Range 19.00 18.00 19.00 32.00 27.00 22.00 25.00 25.00 16.00 45.00 Kurtosis 0.61 -0.70 0.28 1.93 0.61 0.17 0.03 -0.56 -0.04 6.19 Reading Mean 51.83 46.85 48.08 61.43 61.27 59.23 62.94 79.88 88.90 68.46
SD 8.21 8.44 8.82 8.56 8.40 11.41 6.78 11.24 10.89 12.09 Median 53.00 46.00 50.00 61.00 61.00 61.00 61.00 79.00 90.00 72.00 Min 28.00 28.00 21.00 42.00 46.00 34.00 53.00 61.00 66.00 34.00 Max 66.00 61.00 66.00 79.00 79.00 90.00 79.00 100.00 100.00 90.00 Range 38.00 33.00 45.00 37.00 33.00 56.00 26.00 39.00 34.00 56.00 Kurtosis 0.73 -0.58 1.23 -0.17 -0.53 1.05 0.18 -0.93 -0.48 0.43 Total Mean 159.66 154.33 159.65 195.83 193.35 196.81 198.44 243.13 265.52 217.87
SD 11.80 12.32 12.57 14.12 13.29 14.35 12.77 14.22 17.05 20.13 Median 161.00 157.00 161.00 194.00 192.00 194.00 198.00 239.50 259.50 222.00 Min 124.00 120.00 120.00 175.00 175.00 174.00 174.00 226.00 244.00 160.00 Max 174.00 172.00 174.00 224.00 221.00 225.00 226.00 290.00 300.00 243.00 Range 50.00 52.00 54.00 49.00 46.00 51.00 52.00 64.00 56.00 83.00 Kurtosis 1.53 0.60 0.98 -0.79 -0.85 -1.07 -0.63 2.82 -0.97 0.82
students. Incidentally, the scores of H and I Classes (School of Medicine) were even higher. The data confirmed the widespread perception shared by the non-English teaching staff on campus that the students of School of Medicine are relatively proficient in English.
One other thing that should be noticed is that the range or the degree of difference between the maximum and the minimum scores tended to be higher in the advanced classes. This means that there was a large difference between the students of the lowest scores and those with the highest scores in the class, although standard deviations, another indicator of dispersion, did not so greatly differ. This indicates in turn that the teachers of the advanced groups need to take account of individual differences of the students to
an even greater extent in advanced classes than in regular classes.
However, this result is somewhat ironical, because the advanced classes were prepared so they might help students who are proficient in English improve their English ability even more by creating a relatively homogeneous group of students. However, this turned out to be too idealistic a goal to achieve. There is not any quick solution to this problem, but it is ore thing that the teaching staff needs to keep in mind when dividing students into classes of different proficiency levels. In an attempt to place students into appropriate classes, it is important to take into account other factors than test scores, such as overseas experiences, results of entrance ex aminations, and so forth, with the
Table 8 : Basic Statistics for All EAP Classes−continued (Faculty of Engineering and Natural Resource Sciences)Faculty of Engineering and Natural Resource Sciences Advanced
Class ID K L M N O P Q R S T U
n 38 40 40 41 45 48 47 47 45 38 43
Listening Mean 46.42 45.65 46.13 45.49 55.93 57.83 57.79 56.74 55.47 67.03 69.67 SD 9.43 7.92 8.59 8.23 7.04 7.48 9.65 7.60 5.52 10.22 9.83 Median 45.00 45.00 50.00 45.00 54.00 59.00 59.00 59.00 54.00 67.00 70.00 Min 29.00 29.00 22.00 29.00 40.00 40.00 40.00 40.00 40.00 40.00 50.00 Max 70.00 64.00 64.00 64.00 70.00 78.00 78.00 78.00 64.00 89.00 100.00 Range 41.00 35.00 42.00 35.00 30.00 38.00 38.00 38.00 24.00 49.00 50.00 Kurtosis 0.09 0.04 0.69 -0.22 0.21 0.30 -0.59 0.25 0.23 0.99 1.45 Vocab. Mean 25.95 26.30 25.20 25.00 31.20 30.38 29.06 29.47 30.53 36.71 35.60 SD 4.72 4.43 4.97 5.34 5.93 5.99 5.05 4.73 4.34 5.42 5.28 Median 26.00 26.00 26.00 26.00 31.00 29.50 28.00 28.00 31.00 37.00 37.00 Min 16.00 19.00 10.00 13.00 19.00 19.00 16.00 19.00 19.00 26.00 21.00 Max 34.00 34.00 37.00 34.00 45.00 45.00 37.00 40.00 40.00 50.00 50.00 Range 18.00 15.00 27.00 21.00 26.00 26.00 21.00 21.00 21.00 24.00 29.00 Kurtosis -0.42 -1.02 1.91 -0.67 -0.37 0.52 0.48 -0.01 1.12 0.16 1.45 Grammar Mean 21.37 20.95 21.88 22.05 26.44 27.46 25.91 25.68 26.91 32.84 29.98
SD 5.18 4.14 3.99 4.32 4.37 4.51 4.42 3.96 4.75 5.77 4.34 Median 23.00 21.50 20.00 23.00 27.00 27.00 27.00 25.00 27.00 32.50 29.00 Min 11.00 11.00 15.00 11.00 18.00 18.00 18.00 18.00 18.00 23.00 23.00 Max 34.00 27.00 31.00 29.00 34.00 40.00 36.00 34.00 36.00 45.00 40.00 Range 23.00 16.00 16.00 18.00 16.00 22.00 18.00 16.00 18.00 22.00 17.00 Kurtosis 0.00 -0.14 0.04 -0.25 -0.86 1.44 -0.44 -0.40 -0.54 -0.23 -0.33 Reading Mean 38.18 36.88 38.05 39.80 50.40 47.92 48.19 49.47 50.31 61.63 58.98 SD 7.69 9.59 8.00 9.58 6.32 7.65 7.38 6.87 7.08 9.22 7.91 Median 38.00 38.00 38.00 42.00 50.00 50.00 50.00 50.00 50.00 61.00 57.00 Min 21.00 10.00 10.00 10.00 34.00 34.00 28.00 34.00 38.00 46.00 46.00 Max 50.00 53.00 53.00 53.00 66.00 66.00 61.00 61.00 66.00 79.00 79.00 Range 29.00 43.00 43.00 43.00 32.00 32.00 33.00 27.00 28.00 33.00 33.00 Kurtosis 0.15 1.60 2.99 0.88 0.75 -0.30 0.19 -0.37 -0.33 -0.70 0.30 Total Mean 131.92 129.78 131.25 132.34 163.98 163.58 160.96 161.36 163.22 198.21 194.23
SD 12.54 14.49 11.84 13.36 7.99 9.27 8.83 8.89 9.02 14.78 12.22 Median 135.50 133.00 135.00 137.00 163.00 164.00 158.00 162.00 162.00 195.50 191.00 Min 93.00 96.00 101.00 98.00 149.00 148.00 148.00 148.00 148.00 180.00 180.00 Max 147.00 147.00 145.00 146.00 178.00 179.00 178.00 179.00 178.00 239.00 229.00 Range 54.00 51.00 44.00 48.00 29.00 31.00 30.00 31.00 30.00 59.00 49.00 Kurtosis 2.32 -0.48 0.04 0.07 -0.87 -1.16 -1.14 -1.26 -1.19 1.85 0.56
understanding that the scores of one-shot examination are not sufficient to place students into appropriate levels. It is also advisable that students be given a chance to move to a more appropriate class once it is found that they have been placed in an inappropriate class.
Conclusion
This paper presented and discussed the results of analyzing the scores of the three tests that were administered during the period of 2005 and 2006 academic years. The major purpose of the tests was to obtain the information, on the basis of which to place students into appropriate levels of classes for the English for Academic Purposes Program at Akita University. However, the data were also used to evaluate the effectiveness of the program.
To gain more useful results, it may be necessary to do the following in the future more fruitful research.
First, it is important to gather data at the beginning and of the end of the course by using equivalent tests.
Unless it is possible to do so, or in addition to this, it is desirable to continue to gather data by administering equivalent tests over the years. By so doing, it becomes possible to plot changes in the structure and content of the English ability of the students who enter Akita University each year. Third, the purpose of the EAP program involves improving not only English skills per se, but also general academic skills, such as presentation, note-taking, critical reading, and so forth.
These skills could not be tested, so some sort of measurement device needs to be developed which provides information that will be useful for assessing these skills.
Despite several limitations, however, the present study made several important findings. Amongst a variety of those, the most important is that the program seems to have been successful in helping students improve English ability especially in listening and reading. However, it should also be noted that the carriculum seems to have been not as successful as it might have been expected in the area of vocabulary and grammar. This may be because that the program does not involve independent components that are aimed at these skills. It may be necessary then to teach vocabulary and grammar explicitly as separate activities in the classroom.
Finally, it should be noticed that test scores reveal only a limited aspect of the effectiveness of the program. In order to examine all the details of the influence of the program on the students, it is advisable to incorporate observations, interviews, and other qualitative and or ethnographic approaches.
References