Involvement of Adrenomedullin Expression in Tumor Cells and Stroma in the Development of Diabetes in Pancreatic Cancer Patients
Hideyuki I
MAI*1,2,3), Nobuyuki O
HIKE2), Tomoko N
OROSE2), Tomohide I
SOBE2), Koichiro F
UJIMASA1,2), Masatsugu N
AGAHAMA4), Jun-ichi T
ANAKA5), Shoichiro N
AGASAKA3)and Masafumi T
AKIMOTO1)Abstract : Some studies have reported that adrenomedullin (AM) is involved in diabetes mellitus (DM) associated with pancreatic cancer. Therefore, in this study we investigated the relationship between diabetes and AM expression in patients with pancreatic cancer. We examined 48 biopsies and 26 surgical resections from 74 patients with histologically diagnosed pancreatic cancer. Patients were classified into either DM or non-DM groups. The immunohistochemical expression of AM and various clinicopathological factors were compared between the two groups.
Among the biopsy cases, 21 were classified as DM and 27 as non-DM. AM expression in pancreatic cancer cells was significantly lower in the DM group
(p =0.03) . No significant differences were noted in age, body mass index, tumor diameter or location, serum CA19-9, amylase, or C-reactive protein levels, pancreatic ductal dilatation, portal vein invasion, clinical stage, or histological differentiation between the DM and non-DM groups. The proportion of men was significantly lower in the DM group (p =0.04) , as was the frequency of liver metastasis at diagnosis (p= 0.03) . Among the resection cases, 13 were classified as DM and 13 as non-DM. There were no significant differences in AM expression in pancreatic cancer cells between the two groups. However, marked AM expression was observed in the inflammatory cells and fibroblasts of the tumor stroma in all cases.
In addition, the inflammatory response in the tumor stroma tended to be stronger in the DM group. Although the present study failed to find a positive correlation between diabetes and AM expression in pancreatic cancer cells, the results indicate that AM expression in stromal cells may be more closely related to the development of DM in pancreatic cancer patients.
Key words : diabetes mellitus, pancreatic cancer, adrenomedullin, inflammation, immunohistochemical study
Original
1)
Department of Pathology and Laboratory Medicine, Showa University School of Medicine, 1-5-8 Hatanodai, Shinagawa-ku, Tokyo 142-8555, Japan.
2)
Department of Pathology and Laboratory Medicine, Showa University Fujigaoka Hospital.
3)
Department of Medicine, Division of Diabetes, Metabolism and Endocrinology, Showa University Fujigaoka Hospital.
4)
Department of Medicine, Division of Gastroenterology, Showa University Fujigaoka Hospital.
5)
Department of Surgery, Division of General and Gastroenterological Surgery, Showa University Fujigaoka Hospital.
*
To whom corresponding should be addressed.
Introduction
The relationship between diabetes mellitus (DM) and pancreatic cancer (PC) has long been considered. The prevalence of diabetes in PC patients is high, ranging from approximately 40%
to 55%
1-3). Long-standing diabetes is regarded as a risk factor for PC, whereas PC is thought to cause diabetes and glucose tolerance. Diabetes frequently improves after surgical resection of PC
2,4), and Pannala et al reported that diabetes improved after pancreatectomy in 57% of PC patients with new-onset diabetes
2). These facts suggest that PC itself may cause diabetes, but the underlying mechanism remains unclear.
One possible mechanism is thought to be the secretion, by tumors, of diabetogenic products that cause diabetes
5), including adrenomedullin (AM) , islet amyloid polypeptide, and S-100A8 N-terminal peptide
6,7). AM, a 52-amino acid multifunctional hormone, was originally identified as a hypotensive peptide isolated from pheochromocytoma and subsequently shown to exert proliferative and proangiogenic effects
8). AM inhibits insulin secretion from pancreatic islets and causes glucose tolerance in vivo and in vitro
9). Recent studies have reported that AM expression in PC cells is a likely candidate for the induction of diabetes in patients with PC
5,7,10). The main purpose of the present study was to investigate the relationship between the presence or absence of diabetes and the expression of AM in PC cells.
Materials and methods
The study was performed on 48 patients who had undergone a pancreatic biopsy by endoscopic ultrasound-guided fine needle aspiration and 26 who had undergone pancreatic surgical resection between 2014 and 2017 at the Showa University Fujigaoka Hospital. All patients had been histopathologically diagnosed with typical pancreatic cancer (tubular adenocarcinoma) . Patients were divided into two groups based on serum HbA1c levels at the time of diagnosis and their history of diabetes : (i) a DM group, with HbA1c ≥ 6.5% and no history of diabetes or HbA1c ≥ 8.0% and a history of diabetes ; and (ii) a non-DM group without these abnormalities. Among the biopsied cases, 21 were classified as DM and 27 as non-DM ; among the resected cases, 13 were classified as DM and 13 as non-DM.
Clinicopathological features (i.e. patient age, gender, body mass index [BMI] , tumor size, loca- tion, serum concentrations of carbohydrate antigen 19-9 [CA19-9] , amylase, and C-reactive pro- tein [CRP] , dilatation of the pancreatic duct, invasion to the portal vein, liver metastasis, clinical stage, and histological differentiation) were investigated in the patients who underwent pancreatic biopsy and were compared between the DM and non-DM groups. Tumor size, location, dilata- tion of the pancreatic duct, invasion to the portal vein, and liver metastasis were evaluated by computed tomography (CT) or magnetic resonance imaging (MRI) . Clinical stage was classified according to the criteria issued by the Japan Pancreas Society
11).
For the immunohistological investigation of AM expression, 3-µm sections were obtained from
each formalin-fixed, paraffin-embedded block. Immunohistochemical staining was performed using
the avidin–biotin complex detection system with a BEKCHMARK automated immunostaining
device (Ventana Medical Systems, Tucson, AZ, USA) . A rabbit anti-human AM polyclonal antibody (200-fold dilution ; abcam, Cambridge, UK) was used. The staining intensity of AM expression in tumor cells was classified as mild (0) , moderate (1+) , or severe (2+) , as shown in Fig. 1, and was compared between the DM and non-DM groups for both biopsied and resected cases.
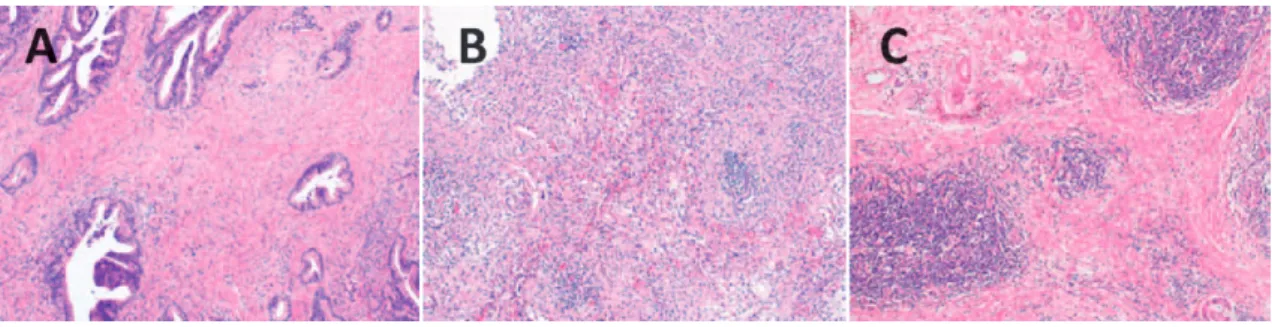
Fig. 1. Immunohistological expression of adrenomedullin in pancreatic cancer cells was categorized into three grades based on staining intensity : (A) mild (0) , (B) moderate (1+) , and severe (2+) . Representative images of each grade are shown (original magnification 400) .
Fig. 2. Immunohistological expression of adrenomedullin (AM) in (A) inflammatory cells and (B) fibroblasts in the tumor stroma (original magnification 400) . Marked AM expression was seen in both inflammatory cells (A) and fibroblasts (B) , and it was particularly prominent in lymph follicles.
Fig. 3. The degree of inflammation of the tumor stroma was categorized into three grades : (A) mild (0) ,
(B) moderate (1+) , and severe (2+) . Representative images of each grade are shown (original
magnification 100 ; hematoxylin and eosin staining) . There was scant inflammatory cell infiltration
in the mild group (A) , whereas prominent infiltration forming many lymph follicles was seen in
the severe group (C) . Intermediate infiltration was seen in the moderate group (B) .
In surgical specimens, AM expression was observed in the tumor stroma (Fig. 2) and the degree of inflammation was investigated and classified as follows : mild (0) , scant infiltration of inflammatory cells ; moderate (1+) , intermediate infiltration ; and severe (2+) , prominent infil- tration of inflammatory cells containing many lymph follicles (Fig. 3) . The degree of inflamma- tion was compared between the DM and non-DM groups. In addition, we investigated whether there were significant relationships between serum HbA1c, diabetic status (i.e. DM or non-DM group) , the degree of AM expression in tumor cells, and the degree of inflammation. Pathologi- cal scoring was performed by two pathologists (H.I. and N.O.) in a blinded manner. Statistical analyses were performed using the χ
2test, Fisherʼs exact test, or Wilcoxonʼs rank sum test.
Two-tailed p < 0.05 was considered significant.
The present study was a retrospective study, and consent was obtained by opt-out. Informa- tion regarding the study was posted on the Showa University Fujigaoka Hospital homepage.
Subjects were guaranteed the opportunity to opt-out of the study. Approval for this study was obtained from the Ethics Committee at Showa University Fujigaoka Hospital (Permission no.
F2017C62) . Results
Clinicopathological comparisons between the DM and non-DM groups (pancreatic biopsies)
Clinicopathological factors in the DM (n= 21) and non-DM (n =27) groups were compared for biopsy cases (Table 1) . The non-DM group included three patients who had a history of diabetes but did not meet the criteria of the DM group. In the DM and non-DM groups,
Table 1. Clinicopathological characteristics of the diabetes mellitus (DM) and non-DM groups of patients who underwent pancreatic biopsy by endoscopic ultrasound-guided fine needle aspiration
DM group (n=21) Non-DM group (n=27) p-value Age (years) 71 [65.5-75] 72 [68-79] 0.3
Male 7 (33) 17 (63) 0.04
BMI (kg/m
2) 21.2 [18.6-21.9] 20.6 [17.4-22.1] 0.63
Tumor size (mm) 33 [20-40] 34 [29-47] 0.65
Location pancreatic head 12 (57) 10 (37) 0.17
CA19-9 (U/ml) 724 [107-2,840] 1,144 [292-9,640] 0.29
Amylase (IU/l) 58 [45.5-107] 72 [50-118] 0.48
CRP (mg/dl) 0.14 [0.04-0.50] 0.12 [0.05-0.77] 0.61
Dilatation of pancreatic duct ≥ 5 mm 11 (52) 9 (33) 0.18
Invasion to portal vein 4 (19) 9 (33) 0.27
Liver metastasis 5 (24) 15 (56) 0.03
Clinical Stage Ⅳ 14 (67) 21 (78) 0.39
Poorly differentiated histologically 3 (14) 2 (7) 0.64
Data are expressed as the median [25th-75th percentile] or as the number of patients (%) .
BMI, body mass index ; CA19-9, carbohydrate antigen 19-9 ; CRP, C-reactive protein.
respectively, the median age was 71 and 72 years, 33% and 63% of patients were male, median BMI was 21.2 and 20.6 kg/m
2, and median tumor diameter was 33 and 34 mm. When the tumor location was classified into pancreatic head versus body and tail, 57% and 37% of tumors were located in the head in the DM and non-DM groups, respectively. In the DM and non-DM groups, respectively, median serum CA19-9 was 724 and 1,144 U/ml, median amylase was 58 and 72 IU/l, and median CRP levels were 0.14 and 0.12 mg/dl. The number of significant dilatations
(≥ 5 mm in diameter) of the main pancreatic duct was 11 (52%) and 9 (33%) in the DM and non-DM groups, respectively, whereas the number of patients in the DM and non-DM groups with invasion to the portal vein was 4 (19%) and 9 (33%) , respectively, and 5 (24%) and 15
(56%) patients, respectively, had liver metastases. The number of clinical Stage Ⅳ cases in the DM and non-DM groups was 14 (67%) and 21 (78%) , respectively, and there were 3 (14%)
and 2 (7%) cases with poorly differentiated adenocarcinoma in these two groups, respectively.
Significant differences were found with regard to gender (p =0.04) and liver metastasis (p=0.03) . The DM group tended to be more frequently diagnosed with PC due to new-onset diabetes or elevated blood glucose before developing liver metastasis.
AM expression in tumor cells from pancreatic biopsy or surgically resected specimens
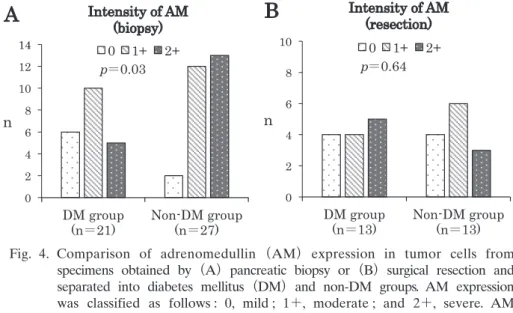
Immunohistochemical analysis revealed uniform AM staining throughout the lesions in all cases, but of varying degree. In biopsy cases, mild (0) , moderate ( 1+) , and severe (2+) AM expression was found in tumor cells in 6 ( 28%) , 10 (48%) , and 5 (24%) cases in the DM group, respectively, compared with 2 (7%) , 12 (45 %) , and 13 (48 %) cases in the non-DM group ( Fig. 4A) . AM expression was significantly lower in the DM than in the non-DM group (p=0.03) . In surgically
0 2 4 6 8 10 12 14
DM group
(n 21) Non-DM group (n 27) n
Intensity of AM (biopsy) 0 1+ 2+
p 0.03
A
0 2 4 6 8 10
DM group
(n 13) Non-DM group (n 13) n
Intensity of AM (resection)
0 1+ 2+
p 0.64
B
Fig. 4. Comparison of adrenomedullin (AM) expression in tumor cells from
specimens obtained by (A) pancreatic biopsy or (B) surgical resection and
separated into diabetes mellitus (DM) and non-DM groups. AM expression
was classified as follows : 0, mild ; 1+, moderate ; and 2+, severe. AM
expression in tumor cells of specimens obtained by pancreatic biopsy was
significantly lower in the DM than in the non-DM group (p=0.03) , but
there was no significant difference between these two groups for samples
obtained by surgical resection.
resected specimens, there were 4 (31 %) , 4 (31 %) , and 5 (38 %) cases of mild (0) , moderate ( 1+) , and severe (2+) AM expression in tumor cells, respectively, in the DM group, compared with 4 (31%) , 6 (46%) , and 3 (23%) cases in the non-DM group (Fig. 4B) . There were no signifi- cant differences in AM staining intensity between the two groups (p= 0.64) .
Inflammation of the tumor stroma in surgically resected specimens
Significant AM expression was observed in inflammatory cells and fibroblasts in the tumor stroma. In particular, AM expression was prominent in lymph follicles. There were 2 (15%) , 3
(23%) , and 8 (62%) cases of mild (0) , moderate (1+) , and severe (2+) inflammation of the tumor stroma, respectively, in the DM group, compared with 3 (23%) , 6 (46%) , and 4 (31%)
in the non-DM group (Fig. 5) . These observations suggest that the inflammatory response of the tumor stroma tended to be stronger in the DM than in the non-DM group, although the difference was not statistically significant (p =0.18) .
Relationships between serum HbA1c, group, the degree of AM expression in tumor cells, and the degree of inflammation in surgically resected specimens
As indicated in Table 2, there were no significant differences in serum HbA1c, DM group, and inflammation of the tumor stroma between different grades of AM expression in tumor cells. In addition, there were no significant differences in serum HbA1c, DM group, and AM expression in tumor cells between different grades of inflammation of the tumor stroma (Table 3) . How- ever, there was a tendency for a greater number of cases in the DM group to exhibit stronger inflammation of the tumor stroma (p =0.12) .
0 2 4 6 8 10
DM group
(n 13) Non-DM group (n 13) n
Inflammation 0 1+ 2+
p 0.18
Fig. 5. Comparison of inflammation of the tumor stroma in specimens obtained by surgical resection between the diabetes mellitus (DM) and non-DM groups.
Inflammation of the tumor stroma was categorized as follows : 0, mild ; 1+, moderate ; and 2+, severe.
Although there was no significant difference between
the two groups, the degree of inflammation tended to
be greater in the DM than in the non-DM group.
Discussion
The underlying mechanism and pathogenesis of PC-induced diabetes remain unclear. Previous reports have suggested direct destruction of islet cells or a decrease in the number of islet cells as a result of PC invasion and/or PC-associated obstructive pancreatitis and fibrosis
12,13). How- ever, diabetes frequently improves after surgical resection of PC, and even small tumors cause glucose tolerance ; therefore, it seems difficult to attribute the pathogenesis of DM only to the destruction of or a decrease in the number of islet cells
2,7). The biopsy case study reported herein also showed no significant differences in factors related to tumor development, such as tumor size and dilatation of the pancreatic duct, between the DM and non-DM groups.
Table 2. Relationship between adrenomedullin expression in tumor cells and HbA1c, diabetes status, and stromal inflammation in surgically resected cases
AM expression in tumor cells
p-value
A0 (n=8) 1+ (n=10) 2+ (n=8)
HbA1c (%) 6.4 [6.0-9.8] 6.9 [5.8-11.8] 7.4 [6.2-9.3] 0.66
DM group 4 (50) 4 (40) 5 (63) 1.00
Inflammation of tumor stroma 0.53
0 2 (25) 1 (10) 2 (25)
1+ 1 (12.5) 6 (60) 2 (25)
2+ 5 (62.5) 3 (30) 4 (50)
Data are expressed as the median [25th-75th percentile] or as the number of patients (%) . Adrenomedullin (AM) expression and inflammation of the tumor stroma were categorized as follows : 0, mild ; 1+, moderate ; and 2+, severe.
A
P-values are for comparisons of Grade 0 expression vs Grades 1+ and 2+.
DM, diabetes mellitus.
Table 3. Relationship between stromal inflammation and HbA1c, diabetes status, and adrenomedullin expression in tumor cells in surgically resected cases
Inflammation of tumor stroma
p-value
A0 (n=5) 1+ (n=9) 2+ (n=12)
HbA1c (%) 6.2 [5.8-6.6] 7.0 [6.2-7.7] 9.1 [6.0-11.0] 0.18
DM group 2 (40) 3 (33) 8 (67) 0.12
AM expression in tumor cells 0.64
0 2 (40) 1 (11) 5 (42)
1+ 1 (20) 6 (67) 3 (25)
2+ 2 (40) 2 (22) 4 (33)
Data are expressed as the median [25th-75th percentile] or as the number of patients (%) . Adrenomedullin (AM) expression and inflammation of the tumor stroma were categorized as follows : 0, mild ; 1+, moderate ; and 2+, severe.
A