and Changing Directions of Trade in East Asian
Electronics Industry(Part 2)
著者
太田 辰幸
雑誌名
経営論集
号
62
ページ
15-27
発行年
2004-02
URL
http://id.nii.ac.jp/1060/00004902/
Creative Commons : 表示 - 非営利 - 改変禁止 http://creativecommons.org/licenses/by-nc-nd/3.0/deed.jaDevelopment of International Direct Investment and Changing
Directions of Trade in East Asian Electronics Industry (Part II)
Tatsuyuki Ota
III. Development of the International Division of Labor in the Electronics Industry
1. Expansion of Regional Production and Increase in Trade DependenceInternational division of labor within E. Asia has undergone considerable transformation since the early 1980s due largely to phenomenal growth of electronics production in the region.
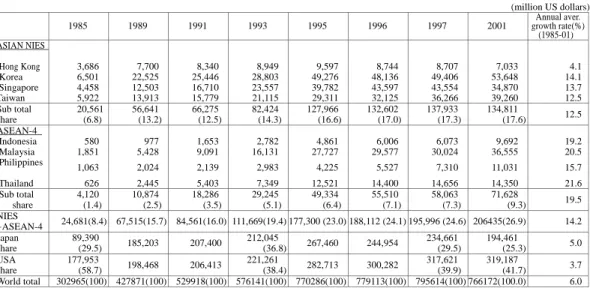
Electronics production of the Asian NIES and ASEAN 4 increased at the annual average rate of 14.2% (NIES: 12.5%, ASEAN: 19.5%) between 1985 and 2001, bringing about a share expansion of NIES and ASEAN-4 from a nominal 8.4% (US$24.7 billion) in 1985 to one-fourth of world electronics production in 2001 (Table-9). A fast expansion of electronics production in E. Asia took place especially in Korea, Singapore, Thailand, Malaysia and Indonesia. By contrast, the United States and Japan, two largest producers in the world electronics industry, gradually reduced the production share from 90% (US: 59%, Japan: 29.5%) in 1985 to 67% (US: 42%, Japan: 25.3%) in 2001. Though the annual rate of production increase in US (3.7%) or Japan (5.0%) were less than half of that in the NIES and ASEAN-4, the United States and Japan still accounted for the largest share (67%) of world electronics production in 2001.
Table - 9 Electronics Production in East Asia :1985 - 2001
(million US dollars) 1985 1989 1991 1993 1995 1996 1997 2001 growth rate(%)Annual aver.
(1985-01) ASIAN NIES Hong Kong 3,686 7,700 8,340 8,949 9,597 8,744 8,707 7,033 4.1 Korea 6,501 22,525 25,446 28,803 49,276 48,136 49,406 53,648 14.1 Singapore 4,458 12,503 16,710 23,557 39,782 43,597 43,554 34,870 13.7 Taiwan 5,922 13,913 15,779 21,115 29,311 32,125 36,266 39,260 12.5 Sub total share 20,561 (6.8) 56,641 (13.2) 66,275 (12.5) 82,424 (14.3) 127,966 (16.6) 132,602 (17.0) 137,933 (17.3) 134,811 (17.6) 12.5 ASEAN-4 Indonesia 580 977 1,653 2,782 4,861 6,006 6,073 9,692 19.2 Malaysia 1,851 5,428 9,091 16,131 27,727 29,577 30,024 36,555 20.5 Philippines 1,063 2,024 2,139 2,983 4,225 5,527 7,310 11,031 15.7 Thailand 626 2,445 5,403 7,349 12,521 14,400 14,656 14,350 21.6 Sub total share 4,120 (1.4) 10,874 (2.5) 18,286 (3.5) 29,245 (5.1) 49,334 (6.4) 55,510 (7.1) 58,063 (7.3) 71,628 (9.3) 19.5 NIES +ASEAN-4 24,681(8.4) 67,515(15.7) 84,561(16.0) 111,669(19.4) 177,300 (23.0) 188,112 (24.1) 195,996 (24.6) 206435(26.9) 14.2 Japan share 89,390 (29.5) 185,203 207,400 212,045 (36.8) 267,460 244,954 234,661 (29.5) 194,461 (25.3) 5.0 USA share 177,953 (58.7) 198,468 206,413 221,261 (38.4) 282,713 300,282 317,621 (39.9) 319,187 (41.7) 3.7 World total 302965(100) 427871(100) 529918(100) 576141(100) 770286(100) 779113(100) 795614(100) 766172(100.0) 6.0
Note : Figures in the parenthesis indicate the share of electronics production in the world. Source : Elsevier Advanced Technology. Yearbook of World Electronics. Various issues.
Export propensities (i.e, export ratios = export/production) of the manufacturing subsidiaries operating in E. Asia tended to vary ranging from 14% in Korea to 57% in Malaysia and Thailand as early as in 1995 depending on the development of integrated international production systems established by MNCs (WIR 1998). In China foreign subsidiaries accounted for about 60% of her manufacturing exports in 2002 (7). However in electronics and electrical machinery industries export propensities of foreign affiliates were generally much higher (8). Due mainly to the widespread production networks constructed by MNCs predominantly from US and Japan, export propensity and import propensity (or import ratios =import / total production) of electronics production in E. Asian host countries were much higher compared with those of home countries (Table-10).
Higher export dependence rates (or export ratio) of electronics production especially of Hong Kong and Singapore were essentially brought about by a large volume of re-export trade of Hong Kong with China, and of Singapore with Malaysia as well as by increased imports of parts and components to be assembled into finished products for export. Malaysia, long noted as 'Silicon Peninsula' and the Philippines which had long been the host to FDI undertaken by MNCs since the early 1970s gradually increased export ratios until they exceeded one, which means that they exported more than they produced domestically. Apparently they were heavily dependent on imported parts and components. Taiwan's export ratio was, in fact, more than one since the mid 1990 (Table-10). Korea and Taiwan are two NIES countries with disproportionately lower import ratios compared with their relatively higher export ratios. However, import dependence rates of Taiwan and Korea, two major producers of electronics goods in Asian developing world, were lower than those of the E. Asian average rate. This is largely attributable to the fact that electronics industries in these two countries were at a more advanced stage than those of the rest of Asian developing countries and were less dependent on foreign sources for the supply of electronics goods. The export and import ratios of Indonesia, one of most technologically backward countries in the region, were at the lowest since the mid 1990s.
Table-10 Export- and Import-Production Ratios in E. Asia Electronics Industry
(%)
1985 1991 1995 1997
Export Import Export Import Export Import Export Import ASIAN NIES Hong Kong 1.57 1.21 2.44 2.16 5.05 4.87 6.12 6.17 Korea 0.61 0.29 0.68 0.30 0.71 0.31 0.71 0.33 Singapore 1.07 0.81 1.34 0.86 1.57 1.03 1.56 1.03 Taiwan 0.77 0.30 0.86 0.42 1.10 0.65 1.08 0.59 ASEAN-4 Indonesia 0.19 0.67 0.18 0.77 0.49 0.41 0.52 0.40 Malaysia 1.14 0.77 1.16 0.69 1.19 0.64 1.22 0.65 Philippines 0.78 0.10 0.79 0.30 0.83 0.50 1.09 0.70 Thailand 0.60 0.67 0.91 0.59 0.98 0.73 0.99 0.59 Japan 0.47 0.06 0.40 0.08 0.45 0.17 0.46 0.21 USA 0.16 0.24 0.29 0.37 0.35 0.51 0.35 0.51
Note: (1) Figures indicate the export and import ratios of electronics goods in total
electronics production of an individual country. (2) China is excluded here due to unavailability of data in the quoted source.
Source: Figures derived from data in Elsevier Advanced Technology. Yearbook of World
Prevalently high export and import dependence in Asian NIES and the ASEAN-4 countries since the mid 1980s was a clear indication of deepening international division of labor in the E. Asian electronics industry. The increasing import ratios of the US and Japan suggest that the electronics imports of two countries have been expanding from E. Asian countries. The United States (35% of the world market share accounted for in 1997) and Japan (21% of the world market share), two of the world largest producers in the electronics industry, accounting for the largest shares of world electronics market were increasingly dependent on imported consumer electronics (9).
The higher import ratios of the US than its export ratios since the mid 1980s seem to indicate the increasing importance of the US market in the electronics industry. The US actually has provided the biggest export market for E. Asian electronics, with its import ratio (=import/total production) rising from 24% (1985) to over 50% (1997). In fact, the US has long been a major export market for Japan's electronics industry. Japan, long reputed to be a leading exporter of electronics products, has continued to increase import ratios in the electronics industry as the electronics production expanded in the E. Asia, though export ratios remained between 40 and 47% since the "triangle trade" was formed. The "triangle trade" is meant by trade relationship among the US, Japan and E. Asia, that is, E. Asian electronics industry imported capital and intermediate goods from Japan to be assembled into their product for export to the United States, a major supplier of capital and technology to local indigenous firms as well as subsidiaries in E. Asia.
2. Intra-Industry Trade in the E. Asian Electronics Industry (1) Two types of intra-industry trade
The electronics industry is known for its varied types of products and components produced by three major sectors of the industry, namely consumer electronics, industrial machinery and electronics components ranging from unskilled labor-intensive to technology- and capital-intensive goods. Encompassing a variety of related industries, the electronics industry has become more complex, more interdependent and more international as the industry has grown. Indeed the electronics industry is the most globalized of all industries, and trade in electronics products is underpinned by an increasing dispersion of MNC-driven production networks. Of all the manufacturing industries, the electronics industry was the one with the most far reaching implications for the economy and impacts on all branches of the industry. As a result, production networks, sourcing linkages and outlet channels were gradually formed, enabling firms within the region to become mutually interdependent, thus deepening and expanding international horizontal division of labor among countries even beyond the region.
MNCs operating in Southeast Asia had exported a larger share of their product than their local counterparts within the same industry (10). In fact, about one-third of world trade consisted of intra-firm trade (11). Subsidiary firms often find it profitable to specialize in the differentiated electronics products traded internationally in E. Asia. This is especially true in the case of technology-intensive products where integrated production network of parts and components are intertwined within the region. Thus international intra-regional trade linkages were naturally formed for the efficient operation of MNCs.
Basically there are two types of intra-industry trade. The first type is found among producers of different product cycles when the home country has more advanced technology at the initial stage of product cycle. But it is those MNCs that had established subsidiaries in host countries at the later and more mature stage of product cycle. This type of trade were largely undertaken by Japanese MNCs in Asia during the early period, as postulated by Kojima hypothesis (Kojima.1971 & 1989). Japanese FDI outflows into Asia during the early period were predominantly of this type.
The second type is the intra-industry trade of parts and components between the MNC subsidiary and its parent firm or between the MNCs. This type of intra-industry trade had been increasing as the production networks constructed by MNCs expanded world-widely. This is clearly shown by a growing share of finished goods in Japan's import structure, which rose twofold in fifteen years from 30% (1985) to 62% (1999)(12). Intra-regional trade within the NIES had increased considerably in the 1980s. For example, exports from Korea and Taiwan to Hong Kong had expanded remarkably as Hong Kong's role of entrepot trade of China with Korea or with Taiwan became important.
Intra-industry trade especially in the electronics industry has reached a high level as Japanese subsidiaries in E. Asia had increased production of finished goods for export within as well as outside the region. Because of increased FDI flows to Asia both from Japan and other countries, the second type of intra-industry trade has become dominant instead of the first type.
(2) Expansion of Intra- Industry Trade in Parts for Electronics Industry
World Investment Report 2002 has made it clear that trade in parts and components has assumed importance (UNCTAD, 2002). Since the electronics and electrical industry comprises so many dynamic products for which a variety of parts and components are installed, intra-industry trade in parts has increased at an accelerated pace in E. Asia since 1980 (13).
Fig.- 4 and Table-11 provide changing patterns of intra- and inter-regional trade in parts for electronics and electrical industry. During the 1990-1998 period, the NIES’ exports of these parts to the world tripled,
increasing their exports to the ASEAN - 4 five times during the period. Thus the NIES have developed to become a major supplier of components to ASEAN - 4 and China. As a result, the NIES have become the largest sourcing region for the ASEAN - 4. Notwithstanding the NIES still depended on Japan as a most important supply source of the above parts in E. Asia region. The NIES and ASEAN-4 were more interdependent for sourcing parts in 1998 than before. Intra - regional trade between the NIES and China, and trade between the ASEAN - 4 and China still remained at low level even though the trade had expanded.
Fig. - 4 Intra - Regional Trade in Parts for Electrical Machinery : E. Asia
(100 million US dollars) 4 - (1) China 27 NIES 232 (43) ASEAN-4 87 (3) Japan 308 2 5 20 14 104 0.1 1 11 29 26 1990 29 32
4 - (2)
Note: Figures below the country name in the circle indicate the country’s total trade to the world. Figures in the
parentheses in NIES and ASEAN indicate the trade data within the NIES and ASEAN - 4 respectively.
Source: Min. of Economy, Trade and Industry. Tsusho Hakusho 2001 (White Paper on International Trade 2001) (in
Japanese).
The following table is indicative of development of intra-industry trade in components for computer and office machines between 1980 and 1998 (Table-11). Intra - regional trade has rapidly expanded since 1980 especially between the NIES and the ASEAN - 4. The NIES’ imports of the above mentioned components from the ASEAN - 4 had rapidly increased its share from 0.1% (1980) to 3.9% in 1998, thus the ASEAN - 4 became the largest sourcing country of parts for computers and business machines for the NIES in the mid 90s. At the same time the NIES were the largest export market for the above parts for the ASEAN - 4. Although the NIES’ exports of the above parts to the ASEAN - 4 increased considerably since 1980 (the share rose from 0.1% (1980) to 2.0% (1998)), the NIES exports to the US and the EU - 8 outweighed those to the ASEAN - 4. China's role as a trading partner for the NIES and ASEAN - 4 still remained relatively minor as far as computer parts are concerned though its share seemed to be increasing since the mid 1980s.
China 105 NIES 726 (179) ASEAN-4 418 (29) Japan 586 21 35 44 29 193 54 4 6 46 98 134 160 1998
Table - 11 BILATERAL TRADE IN PARTS OF COMPUTERS AND OFFICE MACHINES: 1980-1998
(%)
1980 1985 1990 1995 1998
1) NIES Exports to:
ASEAN-4 0.1 0.4 1.4 2.1 2.0
China 0.1 0.6 0.3 0.6 0.8
Japan 0.4 0.5 0.6 1.3 1.3
EU-8 0.4 1.0 2.6 3.8 4.5
United States 4.2 4.2 4.8 7.7 5.6
1) NIES Imports from:
ASEAN-4 0.0 0.1 2.0 3.2 3.9
China 0.0 0.0 0.2 0.9 1.2
Japan 0.8 1.0 1.7 2.9 2.0
EU-8 0.4 0.3 0.4 0.5 0.5
United States 3.4 3.8 2.2 2.1 1.8
2) ASEAN 4 Exports to:
China 0.0 0.0 0.0 0.0 0.6
Japan 0.0 0.0 0.3 0.8 1.2
EU-8 0.0 0.0 0.3 1.0 2.1
United States 0.0 0.2 0.9 2.1 3.4
2) ASEAN4 Imports from:
China 0.0 0.0 0.0 0.0 0.2
Japan 0.1 0.1 0.5 0.8 1.2
EU-8 0.1 0.1 0.1 1.0 0.1
United States 0.1 0.3 0.3 0.7 0.6
3) China Exports to:
Japan 0.0 0.0 0.0 0.2 0.4
EU-8 0.0 0.0 0.0 0.3 0.4
United States 0.0 0.0 0.0 0.4 0.7
3) China Imports from:
Japan 0.0 0.1 0.0 0.6 0.6
EU-8 0.1 0.0 0.0 0.0 0.0
United States 0.1 0.2 0.0 0.1 0.3
4) EU-8 Exports to:
Japan 0.7 0.2 0.3 0.6 0.2
Eastern Europe 0.5 0.1 0.2 0.5 1.0
EU-8 25.7 22.9 20.5 11.7 10.0
4) EU-8 Imports from:
Japan 1.5 2.4 4.8 4.5 3.2
5) United States Exports to:
Japan 2.9 3.0 3.0 1.9 1.6
5) United States Imports from:
Japan 2.5 5.5 9.8 8.0 5.4
Note: Figures indicate percentage shares in total world Export. Source: UNCTAD Trade and Development Report 2002.
(3) The Role of Foreign Affiliates in the Electronics Trade
A growing demand for imported components has thus increased their dependence on foreign sources even further. Roughly speaking about 20 -30% of the total value of exports in Singapore, Indonesia, Malaysia and Thailand are accounted for by the value of imported equipments already in the mid 1990s. These parts and components were supplied not only from within the region but from outside. However major sourcing countries were the US and Japan, though E. Asian dependence on two major sources was on the gradual decline. For example, Japanese total export of electronics components for E. Asia amounting to US$13 billion in 1993 accounted for nearly half (45%) of total exports of electronics industry to E. Asia. Likewise, the US export of electronics components (US$10 billion, 1993) accounted for 55% of total electronics exports to E. Asia. Advanced and hi-tech types of components such as semiconductors were major items of import for E. Asia (14).
Table-12 Export Propensity of MNC Subsidiaries in ASEAN Electronics & Electrical Industry: the US versus Japanese subsidiaries: 1995
Japanese subsidiary (%) US subsidiary (%) ASEAN 4 Indonesia Malaysia Philippines Thailand 70.7 46.0 51.0 82.0 69.0
Note: (1) The figures of Japanese subsidiaries in ASEAN - 4 are the average of Indonesia, Malaysia, Philippines and
Thailand.
(2) Export propensity, i. e., export ratio = export / production.
Source: UNCTAD (1998). P.18
Then prevailing high rate of dependence on foreign components in E. Asian countries largely reflected their weak linkages between local economy and MNC subsidiaries. Electronics production in E. Asia were in fact fundamentally undertaken by MNCs for export purpose. Thus shares of foreign affiliates in the export of E. Asian host economies are generally quite high. Already in 1995, about 70% of electric and electronics production in the ASEAN4, and 46% in Indonesia by Japanese subsidiaries were exported, while 82% of production in the Philippines and 69% of production in Thailand by the US subsidiaries were for export (Table-12).
Following examples suggest the extent of contributions made by foreign affiliates to host economy in E. Asia. The export of a single Japanese firm, Matsushita Electric Co. operating in Malaysia, accounted for 4 % of GDP of its host country in 2002 (15). Foreign subsidiaries in China are said to have exported about 60% of her total manufacturing exports in 2002 (16).
Conclusion
An international division of labor in East Asia has undergone a significant change during the last two decades due largely to a surge of FDI inflows. Absorbing a substantial volume of FDI from predominantly from the US and Japan in the early period, the NIES gradually emerged as important investors to the E. Asian region especially to China, which had rapidly attracted an increasingly larger volume of FDI from both within and outside the region since the mid 1980s. The ASEAN-4 seem to be following suit at a slower rate as hypothesized by Geese-flying pattern of development. Continued increase in intra-regional FDI flows have thus subsequently transformed trade structure and direction of trade while creating trade at the same time in the region, which resulted in expansion of intra - regional trade within E. Asia since the mid 1980s.
Agreater volume of inward FDI in East Asia undertaken by MNCs has flowed into, above all, the electronics industry, bringing about the biggest share expansion of electronics production and trade in the host countries.
The generated impacts of FDI on trade were found to be considerable in the electronics industry. The export share of low value-added and labor-intensive manufactured goods had gradually declined as the export share of high value-added, high-tech products began to increase in the 1980s, thus intra-regional trade in IT-related products rapidly expanded.
The electronics industry may have the advantage of setting up the production networks in various countries at different stage of development, enabling each country in the region to exploit its local comparative advantage to produce a variety of electronics goods ranging from less skilled, labor- intensive to capital- and technology-intensive components and products manufactured by the firms of different nationalities that are interdependent within E. Asia. In other words, intra-industry, or intra-firm international division of labor in the production of finished items and intermediate goods within the region could be easily built up in the electronics industry. International production networks in the electronics industry have thus been established by MNCs originated from within and outside the region operating in East Asia.
FDI inflows into East Asia have not only created demand for export/ import of parts and products from host countries but also sourcing linkages and inter-firm division of labor between local and foreign firms, contributing to expansion of international transaction and to strengthening the linkages.
Increased trade tended to induce inward FDI which often generated and/or diverted trade. This expansionary cycle relationship between trade and FDI seems to have been deepened in recent years.
Trade interdependence within the East Asian region has substantially increased since the mid 1980s spurred by the development of FDI in East Asia. Today many of goods manufactured in the region are the
products of combined parts and components outsourced from different countries, often making it difficult to identify the origin of nationality.
This process of increasing interdependence and deepening international division of labor in East Asia is most clearly observed in the electronics industry which might be coined as the most globalized of all industries.
Acknowledgement:
This paper is a revised version of the paper presented at the 19th Conference of L'Association Tiers-Monde (French Third World Economic Association) at Paris, France on June 4, 2003.
Notes
(1) According to Dunning's estimate, MNCs accounted for over 50% of total international production in 1970. Dunning (1973). P.293.
(2) The stock of FDI in developing Asia has more than doubled since 1988 and annual inflows of FDI have increased from about $30 billion in 1992 to $100 billion in 1995 (OECD, 1997)
(3) UNCTAD (1998).
(4) The Share of the Regional Trade in the World Trade is shown below.
The Share of the Regional Trade in the World Trade
(%) Export Import 1985 -87 1995 -98 1985 -87 1995 -98 United States 11 13 18 15 EU 33 29 32 28 Japan 10 9 6 6 East Asia 10 17 10 18 NIES 5 6 4 7 ASEAN4 2 4 2 4
China +Hong Kong 3 6 4 6
Latin America 5 5 4 6
World Total 100 100 100 100
Note: Here Hong Kong is excluded from NIES. Source: IMF. Direction of Trade Statistics.
(5) Tyson(1992). P.23 (6) World Bank(1998). P.22
Keizai Shimbun, Oct.14, 2003.
(8) For example, the export propensities of American affiliates in 1995 were 69% in Thailand and 82% in the Philippines (WIR 1998. p.215).
(9) Elesevier Advanced Technology (2000).
(10) Dobson (1993).p.30. Citing the Chee's study(1992) and Julius' research output (1990), Dobson found out that MNCs of foreign nationality were engaged in international trade more vigorously than local firms in E. Asia.
(11) UNCTAD(2002). p.153 . The share of intra-firm exports by parent firms in the total exports of their home countries rose from 27% in 1990 to 31% in 1998 in the case of US TNCs, while it remained stable at 38% in the case of Japanese TNCs.
(12) Economic Planning Agency (Keizai Kikakucho), Japan(1996). Nihon Keizai Shimbun. Feb.4, 2000.
(13) Twelve electronics items (mostly parts and components) accounted for 13% of world exports in 2000 and annual growth rates of these items exceeded 10%. UNCTAD (2002). P.147.
(14) Ernst (1997).
(15) Nihon Keizai Shimbun of Oct.31, 2003. (16) Nihon Keizai Shimbun of Oct.14, 2003.
Reference
Akamatsu, Atsushi(1998). Taiwan Outward FDI: Investigation into the Economic Factors of Expanding FDI since the mid 1980s .(Taiwan no Taigai Toushi Doukou: 80nen Dai Kouhan Ikouni okeru Toushi Kakudai no Haikei Youin Bunseki (In Japanese). Mitsubishi Sougo Kenkyusho Shohou (Mitsubishi Research Institute Review) No.33. (Mitsubishi Research Institute: Tokyo).
Isogai, Takashi & Shunichi Shibanuma (2000). Data Analysis of Economic Linkages in E. Asia. (Higashi Ajia no Ikinai Keizai tono Musubitsuki ni Kansuru Deta Bunseki (In Japanese). Bank of Japan Monthly Report (Nihon Ginko Chosa Geppo). July. (Bank of Japan: Tokyo).
Asian Development Bank Institute (1998). Asia: Responding to Crisis. (ADB Institute : Manila).
Asian Development Bank (ADB) (1999). Key Indicators of Developing Asian and Pacific Countries. (ADB: Manila). Chee, P.L., "Asia-Pacific Economic Development and Transnational Corporations". Paper presented at the Kyushu
University International Symposium, Sept.17, 1992.
Chia Siow Yue (1999). Singapore : Advanced Production Base and Smart Hub of the Electronics Industry. in Dobson,Wendy & Chia Siow Yue (ed.) (1999).Multinationals and East Asian Integration. (International Development Research Centre and Institute of Southeaset Asian Studies: Singapore).
---, & Wendy Dobson (1999). Harnessing Diversity, in Dobson,Wendy & Chia Siow Yue (ed.) (1999). Multinationals and East Asian Integration. (International Development Research Centre and Institute of Southeast Asian Studies: Singapore).
Dobson, Wendy (1993). Japan in East Asia --- Trading and Investment Strategies ---. (Institute of Southeast Asian Studies (ISEAS):Singapore).
Dobson,Wendy & Chia Siow Yue (ed.) (1997). Multinationals and East Asian Integration. (International Development Research Centre, and Institute of Southeast Asian Studies: Singapore).
--- & Chia Siow Yue (ed.) (1999). Multinationals and East Asian Integration.(International Development Research Centre and Institute of Southeast Asian Studies: Singapore).
Dunning, John H. (1973). "The Determinants of International Production". Oxford Economic Papers. Vol.25, no.3, Mar., pp. 289~336.
Economic Planning Agency (EPA) (Keizai Kikakucho)(1996). Nihon Keizai no Genkyo (Current Situation of Japanese Economy) (original in Japanese). (EPA : Tokyo).
Elsevier Advanced Technology (Reed Electronics Research). Yearbook of World Electronics Data, Vol.2--- America, Japan & Asia Pacific. Various issues.
Ermisch, J.F. & W.G.Huff (1999). Hypergrowth in an East Asian NIC : Public Policy and Capital Accumulation in Singapore. World Development, Vol.27, No.1, pp.21-38.
Ernst, Dieter(1997). Partners for the China Circle ? The Asian Production Networks of Japanese Electronics Firms. In Naughton, Barry (ed.). The China Circle. (The Brookings Institution: Washington, D.C.).
--- & Paolo Guerrieri (1998)."International Production Networks and Changing Trade Patterns in East Asia: The Case of the Electronics Industry". Oxford Development Studies, vol.26, no.2
Gourevitch, Peter, Roger Bohn & David Mckendrick (2000). Globalization of Production : Insights from the Hard Disk Drive Industry. World Development, Vol.28, No.2, pp.310-317.
Guerrieri, Paolo (2000).International Competitiveness, Regional Integration, and Corporate Strategies in the East Asian Electronics Industry, in Borrus, Michael, Dieter Ernst & Stephan Haggard (eds.). International Production Networks in Asia --- Rivalry or Riches ? (Routledge: London).
IMF. Direction of Trade Statistics Yearbook. various issues.
Jetro. Toushi Hakusho (White Paper on Japan's Foreign Direct Investment) (in Japanese). various issues. (Jetro: Tokyu) ---, (2002). Jetro Boueki Toushi Hakusho 2002 (Jetro Trade and FDI White Paper) (in Japanese).
Julius, DeAnne(1990). Global Companies and Public Policy. (Royal Institute of International Affairs; London).
Kojima, Kiyoshi(1971). Theory of Foreign Direct Investment - Comparative analysis between Japanese FDI and US FDI. (Kaigai Chokusetsu Toshi no Riron; Nihon to Amerika gata) (in Japanese). Hitotsubashi Journal of Economics, June.
--- (1989). Macroeconomic Analysis of Foreign Direct Investment (Kaigai Chokusetu Toushi no Makuro Bunseki) (In Japanese). (Bunshindo Pub.Ltd.: Tokyo).
Liemt, Gijsbert Van (1988). Bridging the Gap : Industrializing Countries and the Changing International Division of Labor. (ILO; Geneva).
Ministry of Economy,Trade and Industry, Japan (METI). White Paper on Trade (Tsusho Hakusho) (In Japanese). Various issues. (METI: Tokyo).
Ministry of Finance, Japan (1990). International Finance Yearbook. (kokusai kinyu Nenpo) (In Japanese). (Zaimusho) (Ministry of Finance: Tokyo).
OECD Centre for Cooperation with Non-Members (CCNM) (1999). Foreign Direct Investment and Recovery in Southeast Asia ; OECD Proceedings. (OECD :Paris).
Oman, Charles P., Douglas H.Brooks & Colm Foy (eds.) (1997). Investing in Asia. : Development Centre Seminars. OECD Development Centre. (OECD: Paris).
Pangestu, Mari (1999). Indonesia : Trade and Foreign Investment Linkages. in Dobson, Wendy & Chia Siow Yue (ed.). Multinationals and East Asian Integration. (International Development Research Centre, and Institute of Southeast Asian Studies: Singapore).
Petri, P. (1992). Platforms in the Pacific: The Trade Effects of Direct Investment in Thailand. Journal of Asian Economics, Vol.3 No.2, 173-96.
Sieh Lee Mei Ling & Yew Siew Yong (1997).Malaysia: Electronics, Automobiles, and the Trade-Investment Nexus. in Dobson, Wendy & Chia Siow Yue (ed.). Multinationals and East Asian Integration. (International Development Research Centre and Institute of Southeast Asian Studies :Singapore).
Tu Jenn-hwa (1999). Taiwan: A Solid Manufacturing Base and Emerging Regional Source of Investment. in Dobson, Wendy & Chia Siow Yue (ed.). Multinationals and East Asian Integration. (International Development Research Centre, and Institute of Southeast Asian Studies: Singapore).
Tyson, Laura D'Andrea (1992).Who's Bashing whom ? Trade Conflict High Technology Industries. (Institute of International Economics : Washington, D.C.).
UNCTAD (1993). World Investment Report (WIR) 1993: Transnational Corporations and Integrated International Production (UN: New York).
---, (1998)(a). World Investment Report 1998: Trends and Determinants.(UN, New York).
---, (1998)(b). Financial Crisis in Asia and Foreign Direct Investment : An Assessment. (UN: Geneva).
---,(2002) World Investment Report 2002: Transnational Corporations and Export Competitiveness. (UN: New York).
---, (2002). Trade and Development Report. (UN: New York & Geneva).
US Dept. of Commerce (1988). International Direct Investment-Global Trends and the US Role. (US Dept. of Commerce: Washington D.C.).
World Bank (1997). Global Development Finance 1997. vol.1, (The World Bank: Washington D.C.). ---, (1998). East Asia: The Road to Recovery. (The World Bank : Washington D.C.).
Zhang, Kevin H. (1999). Foreign Direct Investment and Economic Growth: Evidence from Ten East Asian Economies. Economia Internazionale, Vol.LII, No.4, November.