Tonan Ajia Kenkyu (The Southeast Asian Studies) Vol. 9, No.2 September, 1971
Grain Loss during Hand Harvesting in the Rice
Cultivation in Kedah, West Malaysia
by
Takatsugu
HORIUCHI, * S.]. SAMY, **C. C.
PHANG***It appears to be still worthwhile to study whether or not the grain loss during harvesting is a serious problem in the rice cultivation in Southeast Asia, where Indica type varieties are widely planted. Most of Indica type varieties are well known to be more easily shattered than Japonica type varieties. Watabe1) pointed out the significance
of the grain loss of this kind and suggested the possibility of increasing yield by minimizing the grain loss during harvesting. Few studies, however, have been done on the extent of the loss. There is a general belief among the farmers in Kedah, West Malaysia, that the percentage of grain loss during harvesting processes amounts to some 6 to 10% of the total grain yield. The loss was about 5
%
in Sato's2) study (1961).Actually numerous ripened grains are lost during harvesting processes, such as cutting, gathe~ing and threshing. In addition to this, some grains remain attaching to the threshed stalks. Abortive grains and imperfect grains which scatter on the fields are not included in grain loss in this report. Timely harvesting is essential not only to attain higher recovery of filled grain, but also to get grains of better quality. The fol-lowing two studies were conducted to determine the most suitable harvesting time for Padi Bahagia**** with a special consideration of minimizing the grain loss during harvesting.
Study I: Field Experiments on Grain Loss in 1969/70 Materials and Method
The study was carried out III the main season, 1969/70 at Padi Experimental Station, Telok Chengai, Kedah. The trial was designed to do the harvesting operations on 27 days, 34 days and 41 days after heading. A randomized block design was used with four replications. The size of each plot was 7m x 15m. From each plot, three samples of 1m x 1m were taken for each time. Hence a total of 12 samples were taken for each harvesting date. The agronomic data were as follows;
*
$P'J%=iX, Post-graduate student, Faculty of Agriculture, Kyoto University** Agronomist of Kedah, Telok Chengai Station, Malaysia *** Agricultural Assistant officer, Telok Chengai Station, Malaysia
**** Padi Bahagia is the recommended variety for both the main and off season cropping in the Kedah state.
T. Horiuchi, et ai. : Grain Loss during Hand Harvesting in the Rice Cultivation in Kedah 27D) 34D) 41D) abbreviation abbreviation abbreviation heading, heading, heading, Variety: Padi Bahagia (not easily shattering) Sowing: August 23, 1969
Transplanting: September 20, 1969
Harvesting: January 4, 1970 (27 days after 11, 1970 (34 days after
18, 1970 (41days after Amount of fertilizer applied;
47.0 kg/ha of N (as Urea) for basal dressing
58.9kg/ha of PZ05 (as Chrismas Island Rock Phosphate) for basal dressing 32.5 kg/ha of K20 (as Muriate of Potash) for basal dressing
23.5 kg/ha of N (as Urea) for the first top dressing at young ear formation stage 23.5 kg/ha of N (as Urea) for the second top dressing at heading stage
The percentage of lodged plants at harvesting were as follows; 0% at 27D (no lodging)
50
%
at 34D (half of total plants were lodged)100
%
at 41D (all plants were lodged)Harvesting was done by hand in accordance with the traditional way in Kedah. The main operations were cutting of the plants at about 30cm above the ground, gathering of the cut stalks and threshing them in a threshing tub. A sickle was used for cutting and the fallen grains were collected in a large tin tray (81 cm x 51 cm x 5.5 cm). The plants were bent slightly over the tray which was held to catch the fallen grains. Three men were needed for this operation. The grains collected in the tray were regarded as the grain loss during the cutting process. Then the cut stalks were put on the stubbles, which were transferred from the field and placed in a special set-up as shown in Fig. 1.
The grain loss during the gathering process is mainly due to the scrapping between stubbles and ears, which occures at two times when the cut stalks are put on the stubbles and when they are lifted up for threshing. The amount of grain loss during the gathering process was determined by collecting the fallen grains on a polyethylene sheet which covered the large tray as shown in Fig. 1.
(I,
Photo. Grain loss after harvesting
Stubble Tray (76x65x7.5cm)
(about 30cm he ight )
Threshing was carried out by hitting the stalks with ears against a bamboo rack in a threshing tub. The grain loss during this process was determined by collecting the grains which did not fall in the tub and scattered on a big threshing mat spread around the tub.
In this study, the filled grains which remained attached to the threshed stalks were included in the grain loss.
The filled grams were separated from the unfilled grams with salt-solution (sp. gravity 1.06).
Results
(1) Analysis of grain loss
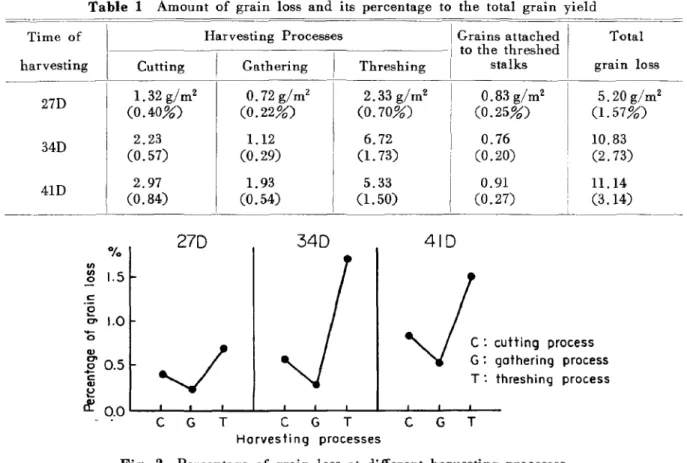
The data on grain loss are summarized in Table 1.* The grain loss is the highest during the threshing process, followed by the cutting and the gathering processes in the order (Table 1 and Fig. 2). Harvesting at 41D gave the highest percentage of grain loss at the cutting and the gathering processes. The harvesting time to minimize the total grain loss was 27D (Table 1 and Fig. 3). The maximum amount of grain loss occurred at 41D. This is probably due to the over-ripening and excessive-drying of the grains. Harvesting
Table 1 Amount of grain loss and its percentage to the total grain yield
e of Harvesting Processes IGrains attached I Total
I
Ii to the threshed I
esting Cutting Gathering Threshing I stalks grain loss
I 7D 1.32 g/m 2 0.72 g/m2 2.33 g/m2 I 0.83 g/m2 5.20 g/m2 (0.40%) (0.22%) (0.70%) i (0.25%) (1.57%) 4D 2.23 1.12 6.72 0.76 10.83 (0.57) (0.29) I (1.73) , (0.20) (2.73) i 2.97 1. 93 I 5.33
I
0.91 11.14 ID I (0.84) (0.54) I (1.50) (0.27) (3.14) - ~ Tim 4 3 2 harv 0/0270
340
410
III III 1.5 0 c: E 1.0 co '0 C : cutting process Ql~
co G: gathering process .E 0.5 c: T: threshing process Ql ~ ~ 0.0 C G T C G T C G T Harvesting processesFig. 2 Percentage of grain loss at different harvesting processes
*
Fallen ears during harvesting should also be included in grain loss, but, for Padi Bahagia, this form of grain loss was almost neglisible.T. Horiuchi, et al. : Grain Loss during Hand Harvesting in the Rice Cultivation in Kedah
the amount of unfilled grains attached
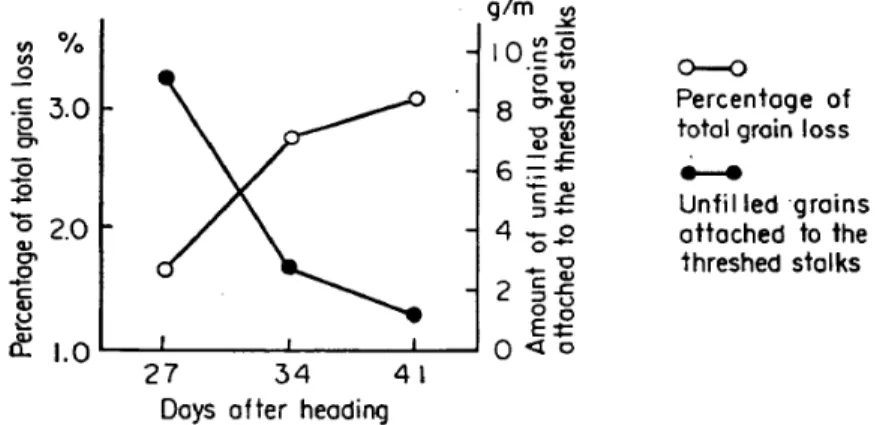
Fig. 3 en % en .2 c 3.0
o§
0'~
'0 2.0 Q) 0' J2 c Q) ~ ~ I.0L----'--_ _---'--_ _---'---" 27 34 41Days after heading
Percentage of total grain loss and to the threshed stalks
g/m en .:JI: 10~]._ en ~'O 8 O'~ "O~Q)~ -.r;. 6 :=--C.r;.Q) ::::J-4_0 0 -_ ' 0 2 §~ 0 ° E~ 0<10 0--0 Percentage of total groin loss
---Unfilled grains attached to the threshed stalks
at 27D, on the contrary, was characterized by the highest amount of unfilled grains remaining attached to the threshed stalks, as shown in Fig. 3.
(2) Filled grain recovery
The prime objective of this analysis is to determine the suitable harvesting time to get the highest net yield with a special consideration of minimizing the grain loss. The amounts of filled grain recovery at 27D, 34D and 4ID are summarized in Table 2.
Table 2 Filled grain recovery at different harvesting times
Amount of grains
Filled grain recovered Amount of grain loss Total filled grain yield
27D 325.9g/m2 5.2 331.1 Time of harvesting 34D 377.6g/m2 10.8 388.4 41D 343.4g/m2 11.1 354.5
A statistical analysis (t-test) on filled grain recovery indicates a difference significant at I
%
level between 27D and 34D. A significant difference at 5%
level was also detected between 27D and 41D. The result shows that the harvesting at 27D gives the lowest amount of filled grains recovered. The highest grain recovery was recorded at 34D.(3) Yield components
In addition to the study of grain loss, an analysis of the yield components was carried out in the same experimental field. The number of ears per hill was determined preliminarily on 120 hills selected at random and as a result, the plants with 14 ears were considered to be most suitable as the standard samples for yield components study. The ears of each sample plant were covered with a cotton bag in order to secure the grain recovery without any loss during harvesting.
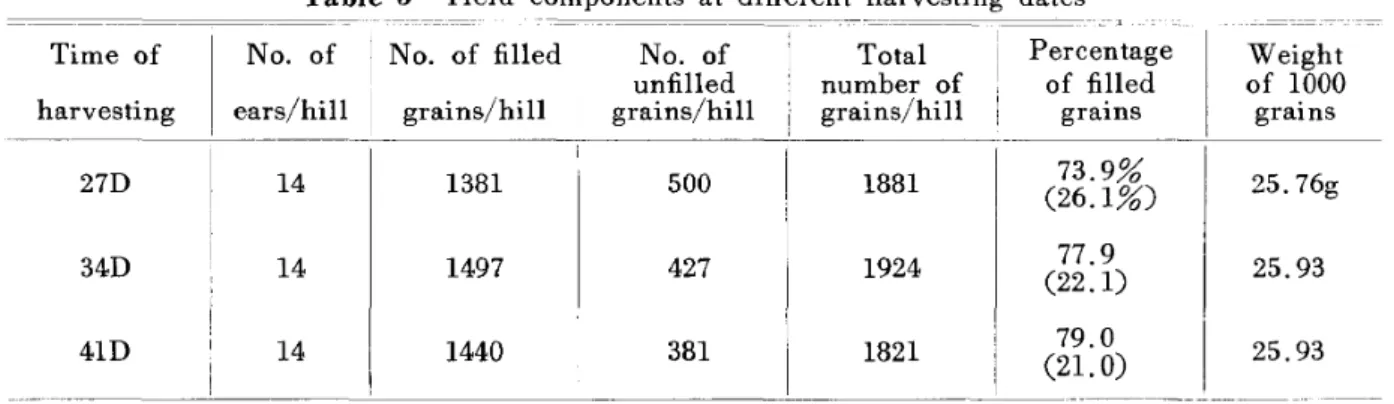
As shown in Table 3, there is no difference between 34D and 4ID in the IOOO-grains weight, but 27D shows a slightly lower weight. The percentage of unfilled grains was the highest at 27D and the lowest at 41D. This means that it is too early to harvest at
27D from the VIew point of the grain maturity. The number of filled grams per hill and the percentage of filled grains are the lowest at 27D. Total number -of grains per hill is higher at 34D than at 41D, though the difference is not significant at 5% level. This is considered to be due to the grain loss resulted from lodging at the late harvesting date of 41D. Actually some fallen grains were found in the cracks (about 3 em wide, and 20 cm deep) of the surface soil in the field.
Table 3 Yield components at different harvesting dates =========~=
Time of harvesting
'
-No. of I No. of filled
ears/hill I grains/hill i ' -No. of unfilled grains/hill Total number of grains/hill Percentage of filled grains Weight of 1000 grains 25.93 25.76g 1924 1881 427 500 1497 1381 14 14 34D 27D 73.9% (26.1%) 77.9 (22.1) i 41D i 14 1440 381 1821 79.0 25.93
____--'-1
---'-
---'
-'--
---'--_(_2__1_.0_) _The values in the parentheses show the percentage of unfilled grains.
Study II: Field Surveys on Grain Loss in 1970/71
Two fields were selected for this study. One was a farmer's field at Batu 4)1
J
alan Putra (Site 1) and the other an experimental field at Telok Chengai Station (Site 2).The variety of rice, Padi Bahagia, was grown at both the sites, too. The harvesting (cutting, gathering and threshing) was done by hand without any special device as used in Study 1. After harvest, the grains scattered on the field were collected as follows.
A wooden frame of one meter square was placed on the ground at three spots along the diagonal line of each plot and the grains within the frame were picked up one by one carefully. A very small unmber of grains fallen in the cracks, which developed in the ground especially at Site 2, might have been missed, but it would not affect the result seriously. The filled grains in the collected samples were separated with a salt-solution (sp. gravity 1.06), dried and weighed. This amount was considered to be the grain loss in the routine practice in a field (see Table 4).
Some data on cultivation at the two sites were:
Number of plots Size of each plot Planting space
Rate of fertilizer application N
P
20
SK20
Harvesting date, after heading
(Site 1) 3 12m x 12m 30cmx 30cm 101 kg/ha 67 67 30th (Site 2) 5 6mx 6m 30cmx 30cm 67kg/ha 34
22
55thT. Horiuchi, et al. : Grain Loss during Hand Harvesting in the Rice Cultivation in Kedah
Both the amount of grains and their percentage of total yield fall within the range obtained in Study I. The grain loss is higher at Site 2 than at Site 1. The harvesting date at Site 2 would have been too late in reference to the optimum time as stated in Study I. The lower yield at Site 2 might be ascribed to the seedling age (40 days old), lodging and bird damage.
Table 4 Grain loss survey at two sites in Kedah, main season 1970/71
Plot number Clean grain Grain loss Percentage
Location (No. of
harvesting samples) yield in g/m2 in ghn2 of grain loss
--_..- - -
---1 (3) 380.4 7.7 1.98
Batu 47f 30days after
2 (3) 369.5 7.1 1.87
Jalan Putra heading 3 (3) 377.3 4.5 1.17
average 375.8 6.4 1.68
- - - - . _ "
-1 (5) 150.1 4.8 3.08
Telok Chengai 55days after
2 (5) 149.2 5.6 3.61
Station heading 3 (5) 186.7 4.8 2.53
average 162.1 5.1 3.03
III Discussion
The study on the grain loss during hand harvesting indicates that the loss is the highest at the threshing process, followed by the cutting and the gathering processes. This order is consistent for three different harvesting dates. The percentage of grain loss has a close relation to the harvesting time. In Study I, the percentages were 1..57, 2.79· and 3.14 for the harvesting at 27D, 34D and 41D, respectively. The highest percentage at 41D might be caused by over-ripening and excessive-drying of the grains at this later date. The filled grain recover y is the highest at 34D follow'ed by 41D and 27D. The lower yield at 27D is due to the high percentage of unfilled grains at this early har-vesting date. The yield components analysis indicates that the filled grain weight per hill is the lowest and the percentage of unfilled grains is the highest at 27D. Harvesting at 34D appears to be optimum, judging from the lower percentage of unfilled grains and the higher filled gram recovery.
In Study II, the harvesting at Site 1 was done on the 30th day after heading and the gram loss was 1.68
%,
while at Site 2, where the harvesting was done on the 55th day after heading, the percentage was 3.03. In the main season in Kedah, the grains become very dry and susceptible to shattering at later harvesting dates. The percentage of grain loss are within the same range in both Study I and Study II.From the results of our studies it could be stated that the grain loss during hand harvesting operations would not exceed 3.5
%
for Padi Bahagia. The best time of har-vesting would be around 30th to 34th day after heading. This is in accord with thereports of University of the Philippines3l and Matsushima4l • The percentage of grain
loss obtained by us is lower than Sato's. This is probably due to the difference of rice varietis, as Radin Eboss used in Sato's study is known to be genetically more easily :shattered than Bahagia.
Summary
The studies on the grain loss during harvesting for Padi Bahagia were conducted III the Kedah State, West Malaysia, in 1969/70 and 1970/71. The grain loss during dif-ferent harvesting processes was the highest at threshing, followed by cutting and gathering. 'The total grain loss during harvesting at 27 days, 34 days and 41 days after heading
were 1.57 %,2.79 % and 3.14 %, respectively. The filled grain recovery was the highest .at 34 days after heading. From these results, a harvesting at around 34 days after heading appears to be optimum. At an earlier harvesting time the yield is lowered due to the poor maturity of the grains and at a later harvesting time the yield is also lowered by the loss due to from over-ripening and lodging. The method of threshing should be improved because much of the grain loss occurs in this process.
Acknowledgement
The authors wish to thank En. Mohd. Tamin bin Yeop and Mr. Xavier Nathan for their useful comments, Miss Anna Wong for correcting the draft, Miss Loh Sok Kee for the typing, Mr. Chuah Ah Hock for his devoted assistance, and the members of the Pusat Latehan dan Pengeluaran Padi who have in one way or another assisted in the studies.
Thanks are also due to the professors, Dr. Hiroshi Hasegawa, Dr. Keizaburo Kawa-guchi and Dr. Kazutake Kyuma of Kyoto University and Prof. Tadayo Watabe of Tottori University for their invaluable suggestions and advices.
References
1) Tadayo Watabe. "A counterplan for the yield increase of rice in Southeast Asia," The South-east Asian Studies, Vol. 5, No.4, Mar., 1968.
2) Takashi Sato. Report on Agricultural Assistance to the Federation of MALAYA under the Colombo Plan Technical Assistance Scheme. 1961.
3) University of the Philippines, College Agriculture in Co-operation with1.R. R.1. Rice Produc-tion Manual compiled by R.1. C.E. 1969.
4) Matsushima, Seizo. "Crop Science in Rice," Theory of Yield Determination and Its Applica-tion. Fuji Publishing Co., Ltd. 1967.