A Study on the Locational Distribution of Allotment
Gardens and Its Impact Factors in Osaka Prefecture
Meng YE, Tomohiko YOSHIDA
Abstract
The emergence of Japan’s allotment gardens is related to urban shrinkage, characterized by population decline, which has resulted in a significant amount of vacant land. Allotment gardens can be used as an effective means of reusing the abandoned land and adding multifaceted values for urban development. They are mainly opened in urban areas and by four-openers dominated by local government and peasants. The majority of allotment gardens in Osaka Prefecture are located in Urbanization Promotion Areas (UPA), and a few are situated in the agricultural promotion areas of Urbanization Control Area (UCA) of Northern and Southern City Planning Area (CPA). The supply of allotment gardens located in UPAs of designated and core cities is insufficient compared to that of other cities. Population size, housing type, and an aging population ratio have influenced the locational distribution of allotment gardens, which tend to be set up in areas with medium population density and fewer households living in rented houses. Senior and welfare allotment gardens are likely to be situated in areas with a slightly higher aging population ratio over the average level. The number of allotment gardens is explained by the demands of urbanization, and has a positive correlation with the scale of the city, which is mainly represented by the percentage of households living in rented houses and the number of allotment gardens in UCA, which are also the most significant impact factors. Keywords: allotment garden, locational distribution, impact factor
1.Introduction
As the worldwide economic development has hastened the urbanization process, environmental degradation— together with ecological fragility—is emerging in an endless stream, which imposes a pressing demand for environmentally friendly modes of development, and ecological agriculture industrialization. An allotment garden (used in Britan)1, often called an allotment for short, or a community garden (used in North America), is a plot of vacant land publicly or privately held (Schukoske, 2000) and made available within a city in which individuals can grow food plants—mostly vegetables2—and carry on non-commercial gardening activities (Colding et al., 2006), and these allotments are also used as recreational spaces in which city residents can connect with the natural environment (Okvat & Zautra, 2011), loosen their bodies and minds (Kiesling & Manning, 2010; Van den Berg, 2010), and experience agricultural work (Fukami & Nakamura, 2016) near an urban area. Because of the benefits for the environment (Krasny & Tidball, 2009), the land, and human society (Partalidou & Anthopoulou, 2017; Holland, 2004) in general, allotments as a form of urban agriculture and a distinct type of land use have experienced significant
development in Japan, Europe, and America. The emergence of Japan’s allotments is associated particularly with urban shrinkage (Fukami & Nakamura, 2016), a phenomenon characterized by population decline. Japan is the first industrialized country to undergo significant population shrinkage, which has been the result of a record-low fertility rate and strict regulations on overseas immigration, making it one of the fastest-aging countries in the world (Yamada et al., 2016). Combined with a renewed trend toward migration to metropolitan centers, this population decline is estimated to be most pronounced in areas outside of the major metropolitan centers, resulting in a great deal of vacant land in prefectural cities. However, green spaces still need to be created in metropolitan areas. Here, a metropolitan area is a region consisting of a densely populated urban core and its less-populated surrounding territories, sharing industry, infrastructure, and housing (Squires, 2002), and it is defined as one or more central cities and its associated outlying municipalities by Statistics Bureau of Japan (SBJ)3. “Kyoto-Osaka-Kobe” is the second-most-populated metropolitan area in Japan after the Greater Tokyo Area, containing approximately 15% of Japan’ s population. Prefectural cities in this paper are defined as municipalities of prefecture except the central cities of “Kyoto-Osaka-Kobe” and Greater Tokyo Area. For example, special wards of Tokyo, Osaka City and Sakai City4 are excluded from prefectural cities. In short, both prefectural cites and metropolitan areas have high demands for green space, and the ever-increasing phenomenon of urbanization has increased the distance from the city to the farmland and reduced the amount of contact between human beings and nature.
Allotments have broad significance in the fields of land use systems, environmental symbiosis, ecological education, the enhancement of the elderly’s existence worth and wellbeing, and the promotion of food safety. Specifically, allotments not only promote the effective use of urban vacant lands and promote compact land use (Holmer & Drescher, 2005), but they also make space for future urban development, and can also be used as evacuation spaces when disasters occur (Tidball & Krasy, 2007). They contribute to environmental sustainability (DeSilvey, 2003) by adjusting the urban microclimate (Huang et al., 2008) and beautifying the city’s landscape, and they also increase opportunities for children to connect with nature (Bowker & Tearle, 2007) and participate in agricultural work, which combines ecological education with recreation and lets children be taught in an automatic and spontaneous way. Allotments also provide the elderly with healthy lifestyle options by increasing the amount of physical exercise that they receive and expanding their opportunities for interpersonal socialization, thereby providing them with spiritual pleasure (Milligan et al., 2004). They also promote healthier and balanced diets by cultivating and harvesting fresh, safe, and organic agricultural products.
With regards to previous studies, plenty of literature has documented how grassroots groups took advantage of vacant lots to produce community gardens (Lawson, 2005; Schmelzkopf, 2002). Community-based allotment gardens have been regarded as a land use management strategy, and 60% of the local government in Tokyo’s metropolitan area has established such allotments to utilize farmland, with the primary reason being to create recreational activities, and the second reason being to revitalize the abandoned cultivated land (Takano & Akita, 2016). In most cases, allotments are located on the margins of old urbanization promotion areas, while they are seldom located in urban agricultural promotion regions (Yamazaki, 1985). Vast research has focused on the users’ evaluations, using conditions, and using motivations, and some of the researchers have conducted a quantitative analysis on the factors influencing their evaluation. The most chosen motivations are simply to be performed as a hobby, as a means of getting exercise and improving health, and as a way to grow safe food by oneself (Matsumiya & Nakamura, 2015; Lin & Kitahara, 2001). Distance from home to the allotment is an important factor influencing the use of senior allotments. Senior users’ satisfaction especially increases with the decrease of distance from home to allotment. Therefore, in the city center where there is still some residual farmland, this distance for prospective allotments should not be increased but decreased (Miyake, Matsumoto & Takase, 1999). There are other studies pointed out
distance affect the degree of satisfaction, and the future willingness to use the space provided by the allotment in the same way (Miyake & Satoh, 1995; Yuzawa, 2012). From the standpoint of landowners, many allotments have a financial loss in the process of allotments’ management, while in the city where land prices are expensive, they can be compensated sufficiently, and in the area where allotments are used as agricultural land for conservation, the allotments make considerable profit without the financial support of the local government, such as the direct payment of rent to the landowners from users when they use allotments, and the reduction and exemption of fixed assets tax when landowners convert the agricultural land into an allotment (Oba & Obase, 2001). However, there is little research regarding the spatial distribution of allotments, especially their locational proportion in urban promotion and urban control areas, as well as their impact factors, including the population size, housing type, and aging population ratio, which have implications for the positioning and the location selection of future allotments. The increase of population size and aging population ratio will increase the number of allotments. While the increase of the percentage of people living in rental houses will decrease the number of allotments. Moreover, the empirical approach by SPSS in this paper is precise and convictive in identifying the most significant impact factors through correlation analysis and multiple linear regression analysis, contributing to making constructive suggestions for allotments’ future development.
The originality of this paper lies in that there is rare previous study exploring the impact factors of allotments’ spatial distribution and also no study conducting statistical analysis to pick out the significant impact factors which can influence the increase and decrease of the total number of allotments in a city. Because allotments are usually served as urban green space, the number and area of allotments should be the more the better. After multiple linear regression, the authors identified two significant impact factors, based on which policy makers can formulate targeted polies to realize the increase of the number of allotment in a city, further to add new green space for a city, which is also the practical implications. Theoretically speaking, the topic of allotments involves multi-disciplinary knowledge, including urban planning, environmental engineering, policy science, etc., and through this paper, various theories and knowledge can be made a full integration and mutual complementation.
2.Methodology
This paper mainly adopted document analysis and spatial analysis, combined with statistical analysis.
Specifically, The Number and Area of Japanese Allotments, The Number of Allotments of Osaka Prefecture Based on City and Village, The Variation Trend of Allotment’s Quantity and Total Area from 1992-2015, The Percentage of Allotment’s Quantity by Regional Agricultural Type from 2003-2015, The Variation of Allotment’s Quantity by Openers from 1992-2015, and The Number of Allotments of 2016 by Different Openers and Acts were revealed based on document analysis using reports of MAFF (year of 2015 & 2016) and Osaka Prefectural Government (year of 2016 & March, 2017). Acts and Policies Relevant to Japanese Allotments were revealed based on document analysis principally using Act on Lease of Specified Farmland, Act on Promotion of Development of Community Farm, City Planning Act, Urban Green Space Conservation Act, and Productive Green Space Act. Secondly, Locational Distribution of Allotments by UPA and UCA in Osaka Prefecture, Locational Distribution of Allotments by Population Distribution, The Percentage of Rental Housing to Total Housing and Locational Distribution of Allotments, and The Distribution of Aging Population Ratio and Locational Distribution of Allotments were based on spatial analysis using ArcGIS. Thirdly, regarding the significant impact factors of the number of allotments in a municipality, correlation analysis and multiple linear regression were used. The dependent variable is the number of allotment in a city, and five independent variables are the number of allotments in UPA, the number of allotments in
UCA, population size, the percentage of households living in rented houses, and aging population ratio.
3.Development Status of Japanese Allotments and Osaka Prefectural Allotments
3.1.Number and Area of Japanese Allotments
The European and American allotment is formally introduced to Japan from the late 1920s (Kudo, 2009), and Japanese allotments began to be created in October 1924 (Zhou, 2007), when some gardening lovers in Kyoto spontaneously organized the Kyoto Gardening Club, through which allotments were constantly established and operated in the outskirts of Kyoto. Influenced by this event, the Municipal Government and Agricultural Association of Osaka City opened the first allotment of Osaka City in 1926. However, allotments were forced to close during the Second World War, and remained closed for a long period thereafter. Allotments reappeared in Tokyo and Kobe in 1969, and allotments boomed in both the quantity and the land area, both of which have been increasing continually since then. The total number and area of Japanese allotments in March 2016 are shown in Table 1.
The numbers of allotments and plots have reached to 4,223 and 189,895, respectively, until March 2016, demonstrating an increase of 1.08% and 0.54% compared to the previous year. However, the total area of allotments reached to 1,381 hectares, demonstrating a slight decrease of 1.57% in 2016.
According to the Ministry of Agriculture, Forestry and Fisheries (MAFF), the Osaka Prefectural Government, and PotGraph, there were a total of 426 allotments in Osaka Prefecture before March 2017, but only 386 can be found
Table 1. The Number and Area of Japanese Allotments in 2016 and 2015 Year 2016 2015 Increase/Decrease of 2016 compared to 2015Number Percentage
Number of Allotments 4,223 4,178 +45 +1.08%
Number of Plots 189,895 188,878 +1,017 +0.54%
Total Area (ha.) 1,381 1,402 -22 -1.57%
Source: based on the MAFF, “Overview of Allotments in Japan.”5
Table 2. The Number of Allotments of Osaka Prefecture Based on City and Village Name of City and
Village Total Number of Allotments (After Integration) Total Number of Allotments (Before Integration)
Name of City and Village Total Number of Allotments (After Integration) Total Number of Allotments (Before Integration)
Higashiosaka City 30 30 Takaishi City 7 7
Yao City 25 25 Matsubara City 7 8
Hirakata City 24 32 Neyagawa City 5 6
Sakai City 23 25 Takatsuki City 4 4
Tondabayashi City 23 23 Izumisano City 3 3
Kashiwara City 22 23 Kadoma City 3 3
Mino City 17 18 Kishiwada City 2 2
Suita City 17 21 Moriguchi City 2 2
Osaka City 17 17 Tadaoka Village 2 4
Kawachinagano City 16 16 Nose Village 2 2
Izumi City 15 27 Sennan City 1 1
Habikino City 12 14 Daito City 1 1
Kaizuka City 10 12 Ikeda City 1 3
Katano City 10 12 Fujidera City 1 1
Toyonaka City 10 13 Shijonawate City 0 0
Ibaraki City 9 9 Settsu City 0 0
Kumatori Village 9 12 Total 338 386
Izumiotsu City 8 10
on the official websites of municipal governments, enterprises, and the Japan Agricultural Association (JA), which opened the allotments. Of these 386 allotments, 338 can be mappable through ArcGIS. 386 is the total number of allotments before integration, and 338 is the total number of allotments after integration, shown in Table 2. Before integration means the number of allotments calculated according to official websites of municipal governments, enterprises, and JA, while after integration means the number of allotments calculated after displaying allotments on the map generated by ArcGIS. The integration of allotments here is called short for integration, which means the comprehensive calculation result of official websites and map display. Table 2 also displays the number of allotments in each city and village, from high to low. The cities having more than 20 allotments—which are also the cities with high quantities of allotments—are Higashiosaka City, Yao City, Hirakata City, Sakai City, Tondabayashi City, and Kashiwara City, and these are located in eastern and southern Osaka.
It is obvious from Figure 1 that both the quantity and the total area of allotments showed a gradual increase from 1992 to 2015, though there was a minor decrease of the total area in 2015. The quantity showed a sharp increase from the beginning to 2006, after which time it decreased slightly in 2007 but then began to increase with a relatively steadier pace than previously. This trend indicates that allotments have revealed a strong developmental momentum in recent years. Furthermore, with the governmental policies on protecting farmland and reducing the amount of abandoned land, dominated by Productive Green Space Act, and Basic Plan about the Maintenance of Green Land
and Promotion of Greening6, this momentum will be sure to be promoted, or at least maintained, in the future. The
quantity of allotments’ plots also demonstrated an increase similar to that of the quantity of allotments.
0 500 1000 1500 2000 2500 3000 3500 4000 4500 1990 1995 2000 2005 2010 2015 2020
Number of Allotment Total Area
Figure 1. The Variation Trend of Allotment’s Quantity and Total Area from 1992 ~ 2015
Source: based on the MAFF, “Overview of Allotments in Japan,” same with note 1.
0% 10% 20% 30% 40% 50% 60% 70% 80% 90% 100%
Mountain Agricultural Area Agricultural Area between Plain and Mountain
Plain Agricultural Area Urban Area
It is noticeable from observing the data presented in Figure 2 that around 70% to 80% of allotments were located in urban areas from 2003 to 2015. However, the percentages of allotments established in mountainous and plains agricultural areas were relatively stable, with a respective percentage of 5% and ranging from 5% to 10%, a very small proportion. Allotments established between plains agricultural areas and mountainous agricultural areas showed a slight decrease from 13% to 10%. In short, urban areas are the optimum place for the growth of prospective allotments.
3.2.Acts and Policies Relevant to Japanese Allotments
In the process of Japanese allotments’ generation and development, there have been a series of critical acts and policy decisions. Originally, the establishment of allotments was impossible in the farmland system, according to the regulation of Agricultural Land Act (No. 249), which was enacted on July 15, 1952. The lineation system was introduced
by City Planning Act (No. 100) on June 15, 1968, which subdivided land use regions and laid a foundation for the
emergence of allotments. In 1973, the Urban Green Space Conservation Act (No. 72) stipulated that taxes should be levied
on agricultural lands, equivalent to homesteads, in urban promotion areas. In the Productive Green Space Act (No. 68) of
1974, the agricultural land of the person who planned to continue agriculture production even though the land was in an urbanization promotion area should be preserved and be levied lower taxes. In the year of 1975, the Ministry of Agriculture, Forestry and Fisheries began to open recreational gardens, enabling allotments to be established by way of the entrance contract. The Allotment Garden Promotion Parliament Association and the Kleingarten Study Group of Japan were separately inaugurated in 1983 and 1985, contributing to the carrying out of the preparatory work of establishing allotments. Taxation on land equivalent to a homestead was reinforced in 1987. In the year of 1989, the first special act of allotments was promoted, the name of which was the Act on Special Provision of the Farmland Act, etc. in Relation to Lease of Specified Farmland, also called the Act on Lease of Specified Farmland (No. 58). This act
specified that cities, wards, villages, and agricultural cooperatives had the right to open allotments. In 1990, another important act called the Act on Promotion of Development of Community Farms was enacted, which provided a legal
basis for allotments and meanwhile aimed toward the maintenance and promotion of well-planned and productive allotments. In 1991, the Productive Green Space Act was revised, dividing the farmland into productive green land and
residential farmland in specific urban areas of three major metropolises, including Tokyo, Osaka and Nagoya. In 1994, the Ministry of Construction authorized the maintenance business of allotments and also issued “On Promoting the Development of Specific Community Farms”, which stipulated that the tax evaluation value can be reduced by 30% for the rental farm whose contract period exceeded 20 years. In 1999, the Food, Agriculture, and Rural Areas Basic Act (No. 106) adopted the development of allotments as an agricultural policy. In 2002, the Act on Special Districts for Structural Reform (No. 189) enabled citizens, companies and NPOs to establish allotments in specially designated areas.
In 2005, three separate events took place regarding allotments. First, through the revision of the Act on Lease of Specified Farmland, farmers were eligible to establish allotments. Second, the Act on Promotion of Development of Community Farms added some regulations to enable farmers and NPOs to establish allotments. Third, the MAFF
established the Urban Agriculture・Regional Communication Room, which was the first establishment of a management department for allotments. In 2006, the MAFF issued a notification stipulating that selling vegetables on allotments was permissible. In 2008, the Autonomous Body Association launched an activity for the promotion of urban farmland’s conservation in the 34 wards, cities, and villages of Tokyo. In 2014, the Ministry of Land, Infrastructure, Transport, and Tourism revised the Urban Green Space Conservation Act and a newly-added system
called the Citizen Green Space Authorization System was proposed to revitalize the suburban under-utilized and vacant lands to increase the amount of open green space, of which allotment gardens were just one example. In
addition, the fixed assets tax and city planning tax could be reduced to 2/3 of the tax standard in the first three years, in principle.
All of these acts and policies have promoted the development and prosperity of Japanese allotments. Among them, the two most important and widely used acts are the Act on Lease of Specified Farmland, which was enacted in 1989,
and the Act on Promotion of Development of Community Farms, which was enacted in 1990. The former act stipulates no
limitation on the opening of allotments, while the latter act limits the openers to local governments and peasants. Therefore, the Act on Lease of Specified Farmland is in fact more prevalent.
3.3.Openers of Japanese Allotments
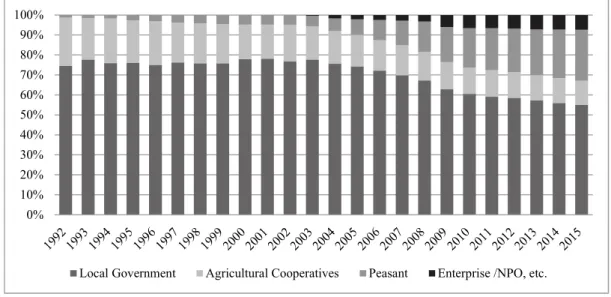
In the process of opening and operating Japanese allotments, there are four major openers including the local governments, agricultural cooperatives, peasants, and enterprise/NPOs, which are dominated by local governments. The roles of these four openers have developed over time.
We can see from Figure 3 that, from 1992-2015, local governments were the consecutively dominant openers for the allotments, followed by peasants, agricultural cooperatives, and enterprises/NPOs. However, the status of agricultural cooperatives and peasants has reversed since 2008, because the number of allotments opened by peasants has surpassed those opened by agricultural cooperatives. Nowadays, a significant proportion of allotments are opened by peasants. Before the year of 2006, the proportion of allotments opened by local governments ranged from 70% to 80%, but this proportion has gradually reduced since then, down to roughly 55% in 2015. The previous proportion of allotments opened by agricultural cooperatives was 20% or so, but with a gradual shrinkage to 10% in 2015. On the contrary, the allotments opened by peasants showed a dramatic increase from less than 5% before 2003 to greater than 20% in 2015. The reasons why more and more peasants participating in allotment affair are that: with the relaxation of policy constraints, peasants were eligible to open an allotment after 2005; with the transformation of people’s view on agriculture, peasants are caring more about the relationship between agriculture and environment; agriculture like the form of allotments can not only add benefits to environment, but also bring peasants respectable incomes meanwhile; under the circumstance of long economic recession, agriculture has become an alternative
0% 10% 20% 30% 40% 50% 60% 70% 80% 90% 100%
Local Government Agricultural Cooperatives Peasant Enterprise /NPO, etc. Figure 3. The Variation of Allotment's Quantity by Openers from 1992-2015
occupation, and engaging in allotment is an easy way for peasants to realize this career choice7. Allotments opened by enterprises/NPOs began in 2003, and this proportion rose gradually and steadily to less than 10% until 2015. For future allotments, local governments are still the main openers, but peasants will become a greater and greater proportion of the opening of new allotments. In addition, we ought to improve the status of agricultural cooperatives because of the current weakening role in opening allotments, the strong power to organize members and associate members, and the function on building a good community. We should also encourage more enterprises/NPOs to participate in allotments because of their abundant capital. In authors’ own opinions, moderate governmental intervention rather than excessive intervention is preferable, and equal status should be given to other market subjects such as agricultural cooperatives, so as to guarantee the freedom to participate in market competition. Local government serves as a security of allotment supply, while other market subjects serve as active elements, in this way, it can promote benign competition among various subjects and finally improve the facilities and services openers provide.
Table 3 shows that, in terms of the openers, the local governments are the dominant openers, and the quantity of allotments opened by local governments accounts for more than half of the total quantity of allotments, followed by peasants, agricultural cooperatives, and enterprises/NPOs. In terms of the act relied upon, 88% of allotments are based on the Act on Lease of Specified Farmland, while 12% are based on the Act on Promotion of Development of Community Farms, indicating that the former is the main act relied upon when opening an allotment.
3.4.Basic Characteristics of Osaka Prefectural Allotments
There are two reasons for choosing Osaka Prefecture as a research object. Firstly, there are many studies focusing on allotments around Tokyo area and Nagaya area, including the studies of Matsumiya et al., Lin and kitahara, Yuzawa, Oba and Obase, which are listed in the references of this paper, whereas less studies on allotments have been done in Osaka Prefecture. Second, according to the official data of MAFF, the number of allotment gardens of Osaka Prefecture lags behind that of Kanagawa Prefecture, Tokyo, and Aichi Prefecture, all of which are metropolitan areas and densely inhabited regions with larger population. Comparatively speaking, Osaka has less allotments than other areas with large population. Consequently, more allotment gardens should be promoted in Osaka Prefecture to meet people’s corresponding needs. In summary, the universal significance of the research on Osaka prefecture’s allotments can further complement the related research in the metropolitan areas.
Table 3. The Number of Allotments of 2016 by Different Openers and Acts Act on Lease of Specified Farmland (Enacted in 1989) Act on Promotion of Development of Community Farms (Enacted in 1990) Total A B Local Government 2,062 259 259 0 2,321 ( 55%) Agricultural Cooperative 469 42 42 0 511 ( 12%) Peasant 883 195 28 167 1,078 ( 26%) Enterprise/NPO 292 21 21 0 313 ( 7%) Total 3,706 (88%) 517 (12%) 350 (8%) 167 (4%) 4,223 (100%)
Note: “A” is about lending and paying method of specified farmland based on Article 2 Clause 2 No.1 of the Act on Promotion of Development of Community Farms. “B” is about the utilization method of community farms, based on Article 2 Clause 2 No.1 of the Act on Promotion of Development of Community Farms.
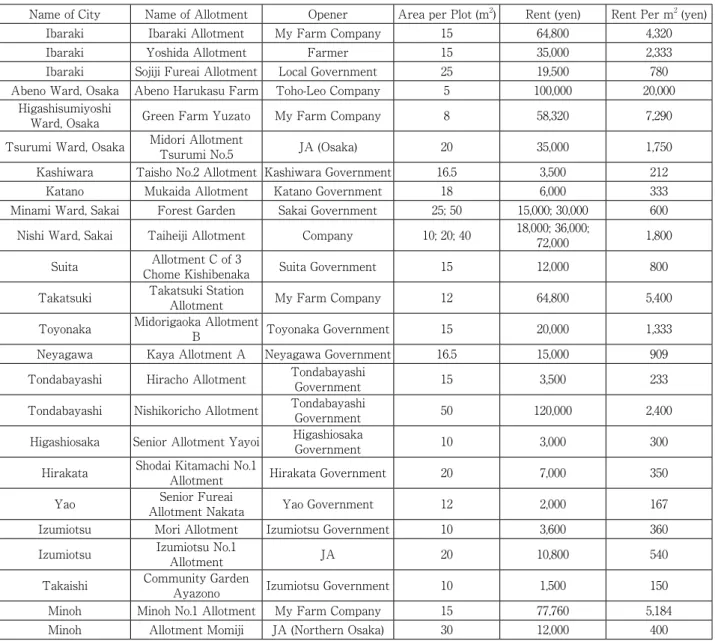
The author selected some allotments of Osaka Prefecture whose openers are local governments, farms, JA (Agricultural Cooperative of Japan), and companies. The basic features of these allotments are shown in Table 4.
(1) A plot of allotments is always presented in the shape of a rectangle, a triangle, or sometimes an irregular polygon. The area per plot ranges from 3 to 99m2, and most allotments have an area per plot of 15m2. Generally speaking, one allotment has one type of plot, but there are still 12 allotments in seven cities which have various types of plots with different areas, such as Taiheiji Allotment in Sakai City.
(2) The rent of a normal allotment ranges from 1,500 to 120,000 yen per year. However, some senior and welfare allotments are rent-free and are usually provided by the local governments. In addition, the rent of senior and welfare allotments is usually lower than the rent of normal allotments, such as the rent of senior allotments located in Higashiosaka City, Yao City, Izumiotsu City, and Takaishi City. Allotments opened by private companies have the highest rent, and the lowest rents are possible when the allotment is opened by local governments. Allotments located in Southern Osaka are cheaper than those in other areas, but Osaka City and Northern Osaka have higher
Table 4. The Basic Characteristics of Some Allotments in Osaka Prefecture
Name of City Name of Allotment Opener Area per Plot (m2) Rent (yen) Rent Per m2 (yen)
Ibaraki Ibaraki Allotment My Farm Company 15 64,800 4,320
Ibaraki Yoshida Allotment Farmer 15 35,000 2,333
Ibaraki Sojiji Fureai Allotment Local Government 25 19,500 780 Abeno Ward, Osaka Abeno Harukasu Farm Toho-Leo Company 5 100,000 20,000
Higashisumiyoshi
Ward, Osaka Green Farm Yuzato My Farm Company 8 58,320 7,290 Tsurumi Ward, Osaka Midori Allotment Tsurumi No.5 JA (Osaka) 20 35,000 1,750 Kashiwara Taisho No.2 Allotment Kashiwara Government 16.5 3,500 212
Katano Mukaida Allotment Katano Government 18 6,000 333 Minami Ward, Sakai Forest Garden Sakai Government 25; 50 15,000; 30,000 600 Nishi Ward, Sakai Taiheiji Allotment Company 10; 20; 40 18,000; 36,000; 72,000 1,800
Suita Chome KishibenakaAllotment C of 3 Suita Government 15 12,000 800 Takatsuki Takatsuki Station Allotment My Farm Company 12 64,800 5,400 Toyonaka Midorigaoka Allotment B Toyonaka Government 15 20,000 1,333 Neyagawa Kaya Allotment A Neyagawa Government 16.5 15,000 909 Tondabayashi Hiracho Allotment Tondabayashi Government 15 3,500 233 Tondabayashi Nishikoricho Allotment Tondabayashi Government 50 120,000 2,400
Higashiosaka Senior Allotment Yayoi Higashiosaka Government 10 3,000 300 Hirakata Shodai Kitamachi No.1 Allotment Hirakata Government 20 7,000 350 Yao Allotment NakataSenior Fureai Yao Government 12 2,000 167 Izumiotsu Mori Allotment Izumiotsu Government 10 3,600 360
Izumiotsu Izumiotsu No.1 Allotment JA 20 10,800 540
Takaishi Community Garden Ayazono Izumiotsu Government 10 1,500 150 Minoh Minoh No.1 Allotment My Farm Company 15 77,760 5,184 Minoh Allotment Momiji JA (Northern Osaka) 30 12,000 400
rents.
(3) The contract period is usually either between one and three years, fewer than five years, or basically one year. There are also some allotments which have a contract period of 11 or 23 months.
(4) The applicant for using allotments is limited to local residents in the case that the allotment is opened by the local government, but there is no such limitation if the allotment is opened by an enterprise, peasants, or an agricultural cooperative. The use of senior and welfare allotments designed for the elderly and the disabled is restricted to local residents who are over 60 or 65 years old and hold disability certificates or rehabilitation certificates, but is still able to farm.
4.Locational Distribution of Allotments in Osaka Prefecture
4.1.Locational Distribution of Allotments by UPA and UCA
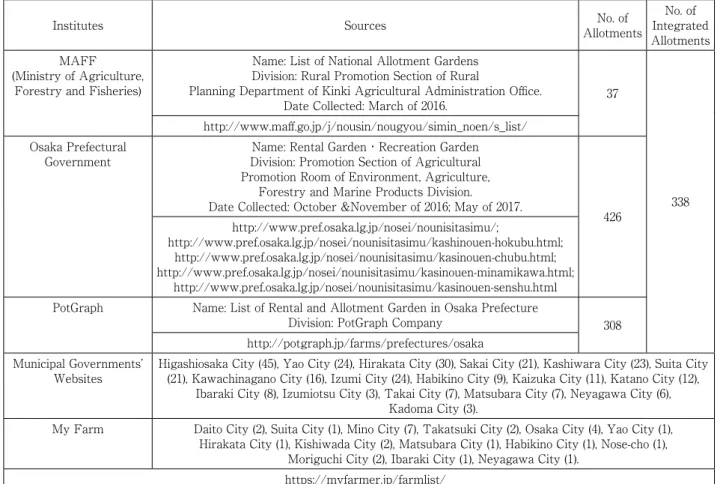
As mentioned before, according to the Osaka Prefectural Government, there are 426 allotments in the Osaka Prefecture, but only 338 of these can be mappable and displayed in Figure 4, which was generated by ArcGIS. The missing allotments are the result of missing addresses or overlapping, i.e. when two or more allotments share the same address. Therefore, the 338 mappable allotments are used as the research object for analysis. The data sources of these allotments are shown in Table 5.
Table 5. Data Sources of Allotments
Institutes Sources AllotmentsNo. of Integrated No. of Allotments MAFF
(Ministry of Agriculture, Forestry and Fisheries)
Name: List of National Allotment Gardens Division: Rural Promotion Section of Rural
Planning Department of Kinki Agricultural Administration Office.
Date Collected: March of 2016. 37
338 http://www.maff.go.jp/j/nousin/nougyou/simin_noen/s_list/
Osaka Prefectural
Government Division: Promotion Section of Agricultural Name: Rental Garden・Recreation Garden Promotion Room of Environment, Agriculture,
Forestry and Marine Products Division. Date Collected: October &November of 2016; May of 2017.
426 http://www.pref.osaka.lg.jp/nosei/nounisitasimu/; http://www.pref.osaka.lg.jp/nosei/nounisitasimu/kashinouen-hokubu.html; http://www.pref.osaka.lg.jp/nosei/nounisitasimu/kasinouen-chubu.html; http://www.pref.osaka.lg.jp/nosei/nounisitasimu/kasinouen-minamikawa.html; http://www.pref.osaka.lg.jp/nosei/nounisitasimu/kasinouen-senshu.html PotGraph Name: List of Rental and Allotment Garden in Osaka Prefecture
Division: PotGraph Company 308 http://potgraph.jp/farms/prefectures/osaka
Municipal Governments’
Websites Higashiosaka City (45), Yao City (24), Hirakata City (30), Sakai City (21), Kashiwara City (23), Suita City (21), Kawachinagano City (16), Izumi City (24), Habikino City (9), Kaizuka City (11), Katano City (12), Ibaraki City (8), Izumiotsu City (3), Takai City (7), Matsubara City (7), Neyagawa City (6),
Kadoma City (3).
My Farm Daito City (2), Suita City (1), Mino City (7), Takatsuki City (2), Osaka City (4), Yao City (1), Hirakata City (1), Kishiwada City (2), Matsubara City (1), Habikino City (1), Nose-cho (1),
Moriguchi City (2), Ibaraki City (1), Neyagawa City (1). https://myfarmer.jp/farmlist/
In Figure 4, black dots represent the site of allotments, light-colored areas represent urbanization promotion areas (UPA), areas with gridlines represent urbanization control areas (UCA), white areas with contour line and small black dots represent agricultural promotion areas, and dark-colored areas represent the areas designated as agricultural lands. Besides, agricultural promotion areas and the area for agricultural lands belong to UCA. It is obvious that the majority of allotments in the Osaka Prefecture are located in UPA, while only a few are located in UCA. Of these 338 allotments, 79.59% are located in UPA, while 20.41% are located in UCA. In terms of the allotments situated in UCA, almost all of them are situated in agricultural promotion areas but none of them are located in the area for agricultural lands, with an exception of Tondabayashi City and two exceptions in Kawachinagano City. The allotments located in UCA are all situated in the Northern, Eastern, and Southern Osaka City Planning Areas (CPA), dominated by Northern and Southern CPAs.
There are several reasons for this spatial distribution of allotments. (1) According to Article 7 of the City Planning Act9, in order to prevent unregulated urbanization, the difference between UPA and UCA is laid out in the city plan. UPA is an area that has already been urbanized and has been taken into consideration planned urbanization with a precedence within ten years. Housing, stores, and factory buildings can be built within the boundaries of UPAs. On the contrary, UCA is an area where urbanization is to be restricted, and where development activity and the maintenance of municipal facilities are controlled. The intention of this is to entirely convert UCA into rural areas dedicated to agriculture, forestry, and
fishery, which corresponds to UPA. In short, development activities are encouraged in UPA but discouraged in UCA. Because allotments are regarded as land use systems and play an important role in terms of regional revitalization, it is better to locate them in UPA based on the rules above. (2) The Act on Promotion of Development of Community Farms specifies the places where allotments are permitted to be established. One area is the allotment region designated by cities, wards, and villages, while the other is limited to the UPA regulated in the City Planning Act. Therefore, if the legal basis of the allotment is the Act on Promotion of Development of Community Farms, there is a greater possibility to locate the allotment in UPA. (3) The nature of the allotment lands are considered to be agricultural land in Japan, while they are characterized as urban green spaces in European countries. As mentioned above, UCA is intended to be completely converted into rural areas where there are or will be large amounts of available agricultural land. Therefore, allotments have more significance when they are established in UPA than in UCA, contributing to the survival
Figure 4. Locational Distribution of Allotments by UPA and UCA in Osaka Prefecture
Source: based on data sources shown in Table 5; Portal Site of Official Statistics of Japan.8
and preservation of agriculture in cities as well as the increase of urban green space. (4) UPA occupies 3.8% of the total area of CPA, while UCA occupies 9.9%. Despite their relative sizes, 67.1% of the total population lives in UPA, while only 9.5% of the population lives in UCA10. Because the target population of allotments is urban residents, allotments should be located in urban areas or suburbs within the scope of UPA for easy access for daily use by the city’s residents. (5) Agricultural promotion areas, forestry, and fishery constitute UCA, while forestry and fishery are contradictory locations for allotments. Therefore, if it is decided that an allotment will be set up in UCA, it must be located in the agricultural promotion area. (6) Very few people live in the area designated for agricultural land, and those living in these areas are farmers, most of whom already have their own farmland; therefore, they have no need for allotments. In addition, allotments are aimed at non-farmer residents. As a result, hardly any allotments are located in areas already designated as agricultural lands. (7) The Osaka Prefecture CPA consists of Northern CPA, Eastern CPA, Southern CPA, and Osaka CPA. The percentages of the UCA area to total CPA area in each CPA are 60%, 35%, 60%, and 5%, in the order that appears above. In other words, the Northern and Southern CPA have the largest areas of UCA among these four CPAs, followed by the Eastern CPA and Osaka CPA. Consequently, most of UCA’s allotments are located in the Northern and Southern CPA.
4.2.Locational Distribution of Allotments by City Type
Based on the local Autonomy Law, Japanese cities are classified into designated cities, core cities, and other cities mostly according to the population size11. The characteristics of allotments’ locational distribution in these three kinds of cities are shown in Figure 5. Whether in UPA or in UCA, other cities have the largest number of allotments, followed by core cities and then by designated cities. From other cities to core cities to designated cities, the number and percentage of allotments located in UPA present a noticeably decreasing trend. Specifically, 80.87% of allotments are located in other cities’ UPA, while 77.94% and 75% are respectively located in core and designated cities’ UPA. Osaka City and Sakai City are considered to be designated cities, which means that they have populations over 0.5 million, indicating that they have the largest populations in Osaka Prefecture. Core cities require a population greater than 0.3 million, which means that they are the cities with the second-largest populations. Nevertheless, designated and core cities have fewer allotments in UPA compared to other cities with smaller populations.
Designated cities and core cities are the most developed areas in the Osaka Prefecture, which attracts more population and a more significant need for commerce, housing, factories, transportation, and other facilities. Land use in these areas is often mixed and compacted, resulting in less vacant land and less space for allotments. However, people living in designated and core cities actually have a stronger desire for allotments because of the insufficiency of their connection to nature and the limited green space offered to them. An allotment is a place where city residents search for substantial leisure and a sense of togetherness with natural environment and can experience agricultural work easily (Fukami, 2016). According to a study (Okvat & Zautra, 2011), allotments promote psychosocial health among urban residents because that characteristics of the physical environment, such as the presence of vegetable gardens, parks, and tree diversity, may be as important as characteristics of the socio-cultural environment, which implies that interventions to enhance mental health and community well-being in urban areas should consider both the social and physical features of neighborhoods, and a community garden as a “socio-ecological space” is one entity that brings these together. Therefore, more allotments are recommended to be set up in designated and core cities’ UPA, especially in designated cities’ UPA to relieve urban residents’ work and life pressure, and also as a socio-ecological space for socialization and collective activities.
5.Impact Factors on Locational Distribution of Allotments in Osaka Prefecture
5.1.Impact Factors: Population Size, Housing Type, and Aging Population Ratio 5.1.1.Population Size
269 (79.59%)
30 (75%)
53 (77.94%)
186 (80.87%)
69(20.41%)
10(25%)
15(22.06%)
44(19.13%)
0%
20%
40%
60%
80%
100%
Total
Designated Cities
Core Cities
Other Cities
UPA
UCA
Figure 5. The Number and Percentage of Allotments Located in UPA and UCA by City Type
Source: authors
Figure 6. Locational Distribution of Allotments by Population Distribution
Allotments are prone to be located in districts with a medium-sized population density. In the left-hand side of Figure 6, the areas with black slashes represent densely inhabited districts, and we can clearly see that allotments are located within the scope of this densely inhabited district. In very few cases, allotments are arranged outside of this area, a phenomenon which mostly occurs in the southern and northern UCA. This locational feature can be more specifically explained by the picture on the right-hand side of Figure 6. The graduated color represents population density, which equals the total population of a city divided by the total area of a city. The areas with darker color indicate a higher population density. There is an explicit relationship between population size and locational distribution of allotments. It is obvious that Osaka City—especially some central wards—has the densest population, followed by Toyonaka City, and Suita City, which surround Osaka City to the north, and then by Hirakata City, Higashiosaka City, and Yao City, etc., which surround Osaka City to the east. However, the majority of allotments are located in medium dense areas, with a population density of 5,008 to 8,138 person/km2.
Allotments are most popular among older groups, people over 50 (Yuzawa, 2012) or 60 (Matsumiya, et al., 2015) years old, who have abundant amounts of spare time and higher income conditions, and they live in less dense cities with only medium population densities. However, people living in Osaka City, the densest area, are mostly young people with less spare time and less income, resulting in fewer opportunities to make use of allotments. Besides, land prices in Osaka City are usually higher than those in other areas, making it more economical to establish allotments outside of the densest area. Combined with the allotment’s non-profitability, the rent charged for the allotments cannot balance the high land prices in metropolises and city centers. Moreover, the commercial, residential, and industrial lands are often mixed and concentrated in city centers, resulting in less land space to be used for allotments. For example, agricultural land accounts for only 0.5% (115ha.) of the total area of Osaka City12..
5.1.2.Housing Type
Allotments are situated in cities with fewer households living in rented houses. In Figure 7, the area with the darkest color indicates a larger percentage of households occupying rented houses in this area. Over 43% of households live in rented houses concentrated in most of the wards of Osaka City, Toyonaka City, Suita City, and Kadoma City, as well as Sakai Ward, Kita Ward, and Minami Ward of Sakai City. In addition, over 53% of households live in rented houses across the 9 wards located in the center of Osaka City. However, the locations of the allotments are further away from the areas with a higher percentage of rental housing dominated by Osaka City. The locations form a semi-ring, with the darkest-colored and second darkest-colored areas being the center. In other words, allotments are situated in cities with fewer households living in rented houses. According to some studies, the users of allotments usually earn a relatively high income, identified as the so-called middle class, indicating that they prefer to own their
Figure 7. The Percentage of Rental Housing to Total Housing and Locational Distribution of Allotments
homes, rather than rent. Consistent with this explanation, allotments are located in the areas in which most users live, and these areas are also the cities where fewer people live in rented houses.
5.1.3.Aging Population Ratio
The aging rate, also known as aging population ratio, has an impact on the locational distribution of allotments, especially on senior and welfare allotments, which are likely to be situated in areas with a slightly higher aging population ratio than the average ratio of Osaka Prefecture. According to the calculation of the Osaka Prefectural Government, the aging population ratio of Osaka Prefecture was 26.6% in 2015. Table 6 lists the cities with a number of allotments over 20, which are also the cities with the most allotments. Most of these cities have an aging population ratio exceeding that of Osaka Prefecture.
We can see this phenomenon more clearly in Figure 8. Most allotments are located in the cities of eastern Osaka, with an aging population ratio between 26.08% and 28.26%. Furthermore, based on our data collection, Higashiosaka City and Yao City have the highest number of senior and welfare allotments used by the elderly. Therefore, the locational distribution of allotments—especially senior and welfare allotments—has a close relationship to the distribution of the aging population ratio. The establishment of allotments in the cities mentioned above takes into consideration the aging population ratio of each city.
5.2.Correlation and Multiple Regression Analysis of Municipality Data
The scale of the city is to some extent represented by the population size, the number of allotments both in UPA and UCA, and the percentage of rental housing. Generally speaking, big cities with large populations have more allotments, both in UCA and UPA, along with more rented houses, all because of the strong demands of urbanization. Based on this hypothesis, the authors analyzed the correlations among the number of allotments and the factors shown in Table 7.
Table 6. The Aging Rate13 of Cities of Osaka Prefecture in 2015
City Name PrefectureOsaka Higashiosaka Yao Hirakata Sakai Tondabayashi Kashiwara
Aging Rate 26.6% 28.5% 27.4% 27.0% 26.9% 27.1% 26.5%
Source: Osaka Prefectural Government, “Aged People Plan of Osaka Prefecture”14.
Figure 8. The Distribution of Aging Population Ratio and Locational Distribution of Allotments
AG_N represents the total number of allotments, while UCA_N stands for the number of allotments in UCA and UPA_N stands for the number of allotments in UPA. P_D refers to the population density, P_S stands for population size, A_R stands for the ratio of aging population, and Rented refers to the percentage of households living in rented houses.
It is obvious by looking at the information provided in Table 8 that, as for AG_N, Pearson product-moment correlation coefficients (Pearson’s r) of UCA_N, UPA_N and P_S are significant at 0.01 level, and Pearson’s r of Rented is significant at the 0.05 level, and they all have positive correlations with AG_N. Moreover, according to the
Table 7. The Impact Factors and Their Meanings Abbreviation Meaning
AG_N The total number of allotments
UCA_N The number of allotments located in UCA UPA_N The number of allotments located in UPA P_D Population density
P_S Population size
A_R The ratio of aging population (aging rate)
Rented The percentage of households living in rented houses
Source: authors
Table 8. Correlations
UCA_N P_D Rented A_R P_S UPA_N
AG_N Pearson Correlation .556** .290 .382* -.229 .395** .934** Sig. (2-tailed) .000 .059 .011 .140 .009 .000
N 43 43 43 43 43 43
UCA_N Pearson Correlation 1 -.116 .007 -.006 .107 .223
Sig. (2-tailed) .459 .962 .972 .494 .150
N 43 43 43 43 43 43
P_D Pearson Correlation 1 .699** -.326* .505** .390**
Sig. (2-tailed) .000 .033 .001 .010
N 43 43 43 43 43
Rented Pearson Correlation 1 -.558** .421** .445**
Sig. (2-tailed) .000 .005 .003
N 43 43 43 43
A_R Pearson Correlation 1 -.172 -.266
Sig. (2-tailed) .270 .085
N 43 43 43
P_S Pearson Correlation 1 .417**
Sig. (2-tailed) .005
N 43 43
UPA_N Pearson Correlation 1
Sig. (2-tailed)
N 43
**. Correlation is significant at the 0.01 level (2-tailed). *. Correlation is significant at the 0.05 level (2-tailed).
size of Pearson’s r, we can determine the degree of correlation. 0.5 < UCA_N’s r = 0.556 <0.8, means that AG_N has significant correlation with UCA_N. 0.3 < Rented’s r = 0.382 <0.5, means that AG_N has low correlation with Rented. And AG_N also has a low correlation with P_S in the same way. 0.8 < UPA_N’s r = 0.934 <1, means that AG_N has a high correlation with UPA_N. In summary, the number of allotments has a positive correlation with the number of allotments located in UCA (significant correlation), the number of allotments located in UPA (high correlation), population size (low correlation), and the percentage of households living in rented houses (low correlation).
The correlations presented above by Pearson’s r only give us a macroscopic relationship between various factors, thus a multiple linear regression should be conducted to further identify impact factors which have a significant influence on AG_N. The authors took AG_N as the dependent variable, and UCA_N, P_S along with Rented as independent variables. The reason for the independent variables to have been selected is that UPA_N has positive correlations with AG_N, P_D, P_S, and Rented, while UCA_N only has a positive correlation with AG_N. Therefore, under the condition that AG_N is selected as the dependent variable of the multiple linear regression, UCA_N is more appropriate than UPA_N as an independent variable and to enter into the regression model. Through several tests, the author found that the dependent variable could be explained by UCA_N—which is, in other words, the suburban area of the cities—and Rented (the percentage of households living in rented houses). Therefore, the authors finally chose UCA_N and Rented as independent variables, because they typically demonstrate the scale of a city. Also, the t-value of the constant is not significant at 95% confidence intervals, and adjusted R square is bigger if omitting the constant. Therefore, the author adopted a forced entry method and no constant term to conduct the regression, and the results are listed in Table 9, Table 10, and Table 11.
y = the number of allotment garden, x1 = UCA_N (the number of allotments located in UCA), x2 = Rented (the percentage of households living in rented houses). y is dependent variable, x1 and x2 are independent variables. The linear equation is:
y=β1x1+β2x2
In Table 9, adjusted R square is 0.698, suggesting that model 1 can really reflect 69.8% of the raw data. DW value is 2.274, suggesting that autocorrelation is basically inexistent among independent variables. In general, this model is good to conduct further analysis.
Table 9. Model Summaryc,d
Model R R Squareb Adjusted R Square Std. Error of the
Estimate Durbin-Watson
1 .835a .698 .683 6.559 2.274
a. Predictors: Rented, UCA_N
b. For regression through the origin (the no-intercept model), R Square measures the proportion of the variability in the dependent variable about the origin explained by regression. This CANNOT be compared to R Square for models which include an intercept.
c. Dependent Variable: AG_N d. Linear Regression through the Origin
In Table 10, Sig. value of model 1 is 0.000, smaller than 0.05, showing that this model is significant.
In Table 11, VIF=1.21<5, which means that collinearity is basically inexistent between the two factors. Regarding standardized coefficients, x1’s Beta is 0.445, and Sig. is 0.000<0.05, which means that it is significant. x2’s Beta is 0.546, and Sig. is 0.000<0.05, which also means that it is significant, and they both have positive correlations with y. In addition, x2’s Beta is greater than x1’s Beta, suggesting that x2’s contribution rate is higher. In summary, the percentage of households living in rented houses and the number of allotments in UCA are the most significant impact factors. The former has a greater influence than the latter, and they both have positive correlations with the number of allotments. The equation of linear regression is listed below:
y=1.47x1 (UCA_N)+21.412x2 (Rented)
6.Conclusion and Recommendation
6.1.Conclusion
(1) Allotments demonstrate a general increase in both quantity and area. They are mainly opened in urban areas by four various sources, dominated by local governments and peasants, who will likely be the primary opener in the future. The Act on Lease of Specified Farmland and the Act on Promotion of Development of Community Farms are the major acts relied upon to open an allotment. Allotments have an average area per plot of 15m2 and a 1-to-3-years’ contract period. The rents of allotments are unstable based on factors such as the type of opener, the location, and the area of the plot. Allotments opened by enterprises have the highest rents, and the lowest rents are offered
Table 10. ANOVAa,b
Model Sum of Squares df Mean Square F Sig.
1 Regression 4074.262 2 2037.131 47.355 .000c
Residual 1763.738 41 43.018
Total 5838.000d 43
a. Dependent Variable: AG_N b. Linear Regression through the Origin c. Predictors: Rented, UCA_N
d. This total sum of squares is not corrected for the constant because the constant is zero for regression through the origin.
Source: outputted by SPSS 22.0.
Table 11. Coefficientsa,b
Model Unstandardized Coefficients Standardized Coefficients t Sig. Collinearity Statistics
B Std. Error Beta Tolerance VIF
1 UCA_N 1.470 .312 .445 4.715 .000 .827 1.210
Rented 21.412 3.706 .546 5.778 .000 .827 1.210
a. Dependent Variable: AG_N b. Linear Regression through the Origin
when the allotments are opened by the local government. Senior and welfare allotments are also of lower rent, and sometimes even free of rent, and they are usually opened by the local governments, dominated by Yao City, Higashiosaka City, and Southern Osaka.
(2) The majority of allotments in Osaka Prefecture are located in UPA, but a few are situated in agricultural promotion area of UCA of the Northern and Southern CPA. The number and percentage of allotments located in the UPA in designated and core cities are lower than that in other cities due to the overcrowded population and less space generally available for allotments.
(3) Population distribution, housing type, and the aging population ratio all influence the spatial distribution of allotments. Allotments tend to be set up in districts with a medium population density and a smaller number of households living in rented houses. Senior and welfare allotments are likely to be situated in areas with a slightly higher aging population ratio over the average aging population ratio of Osaka Prefecture.
(4) The number of allotments in every municipality is explained by the demand of urbanization and has a correlational relationship with the scale of the city, which is represented by population size, the percentage of households living in rented houses, the number of allotments located in UCA, and the number of allotments located in UPA. The number of allotments has a positive significant correlation with the number of allotments located in UCA, a positive high correlation with the number of allotments located in UPA (high correlation), and a positive low correlation with the population size and the percentage of households living in rented houses.
(5) Through a multiple linear regression, it turns out that there are two impact factors which have significant influence on the number of allotments in every municipality. The first impact factor is the percentage of households living in rented houses, which is also the most significant impact factor, and the other impact factor is the number of allotments in UCA. Both of these factors have positive correlations with the number of allotments. In addition, percentage-point-increase of households living in rented houses and an increase of one allotment in UCA can add 21.412 allotments and 1.47 allotments, respectively.
6.2.Recommendation
(1) Preferential policies for the enlargement of the quantity and proportion of allotments in UPA in designated and core cities should be introduced and implemented, especially in designated cities.
(2) Make a moderate increase of allotments located in the UCA of municipalities and promote the maintenance and use of the current UCA’s allotments by support measures, such as the facts that owners can enjoy property tax exemption and users can enjoy a rent concession or a bigger allotment as a benefit.
(3) Encourage particular groups who live in rented houses to participate in the usage of allotments, especially for people living in the center of Osaka City, because of a bigger percentage of households living in rental housing in this area. There should be a rent difference between users living in owned houses and rented houses, considering their different economic conditions. For users living in rented houses, the rent of allotments should be reduced appropriately—lower than the rent charged from people living in owned houses, and they are willing to pay with the reason that this rent is affordable and only occupies a small part of their incomes—or otherwise subsidized by the municipalities.
(4) Given the limited land resources and high land prices in the center of Osaka City, for the new construction of future allotments, the form of allotments should be made with adjustments toward roof gardens/roof allotments, which is beneficial in terms of compact land use and urban microclimate regulation, such as the exemplary practices of the Abeno Harukas Farm on the roof of Abeno Harukas15 and the Just Now Farm in Kita Ward of Osaka City16.
Green roof has social benefits for the reason that it has become a refugee oasis and gathering place for recreational activities for urban society (Dunnett & Kingsbury, 2004). Furthermore, a roof garden is recognized as an intensive green roof, which contributes for urban regeneration in the city, especially in a commercial area (Syumi, et al., 2015). In fact, the Osaka Natural Environment Protection Act has introduced some regulations in an effort to promote greening on the roofs and walls of buildings such as these17. Policy makers need to initiate the establishment of allotments on the rooftops, since there is currently no such roof allotment operated by the local governments.
7.Acknowlegement
Notes
1 The term “allotment” is not used in the United States to refer to these garden plots, as shown by the entries in the American Heritage Dictionary and the Cambridge American English Dictionary.
2 Scottishi Allotments & Gardens Society, Definition of an allotment, http://www.sags.org.uk/docs/ReportsPresentations/LawChan
gesBulletPointswithHeaderandFooter.pdf, October 17th, 2017. 3 http://www.stat.go.jp, October 17th, 2017.
4 http://www.stat.go.jp/english/data/jyutaku/pdf/25daitoshi.pdf, October 17th, 2017.
5 Ministry of Agriculture, Forestry and Fisheries, The Relevant Situation of Allotments, 市民農園をめぐる状況 , http://www.maff.
go.jp/j/nousin/nougyou/simin_noen/zyokyo.htm, August 28, 2017.
6 Ministry of Land, Infrastructure and Transport, The Present Conditions and Problems of Green Policies, みどりの政策の現状と課
題 , http://www. mlit.go.jp/singikai/infra/city_history/city _planning/park_green/h18_1/images/shiryou06.pdf, October 11th, 2017. 7 http://www.tjf.or.jp/clicknippon/zh/archive/docs/TB27_C.pdf, October 11th, 2017.
8 Portal Site of Official Statistics of Japan, http://www.e-stat.go.jp/SG1/estat/GL32010201.do?method= searchTop&andKeyword=la
nd+housing, June 13th, 2017.
9 City Planning Act, 都市計画法 , http://law.e-gov.go.jp/htmldata/S43/S43HO100.html, June 13th, 2017.
10 City Planning Division, City and Regional Development Bureau, Ministry of Land, Infrastructure and Transport, Introduction of
Urban Land Use Planning System in Japan, http://www.mlit.go.jp/common/000234477.pdf, June 13th, 2017.
11 There are three types of Japanese city: designated city, core city and other city. A designated city, also known as a government
ordinance city, has a population greater than 500,000 and has been designated as such by order of the Cabinet of Japan under Article 252, Section 19 of the Local Autonomy Law. A core city has a population greater than 300,000 and an area greater than 100 square kilometers. In the Osaka Prefecture, designated cities include Osaka City, Sakai City; core cities include Toyonaka, Higashiosak, Takatsuki and Hirakata; the rest of the cities (except the cities mentioned above) are defined as other cities. https:// en.wikipedia.org/wiki/Cities_designated_by_government_ordinance_of_Japan; https://en.wikipedia.org/wiki/Core_cities_of_Japan
12 City planning and Promotion Section of Osaka Prefectural Government, The Characteristics of Urban Planning in Osaka
Prefecture, 都市計画区域の特徴~大阪都市計画区域はこのような区域です~ , http://www.pref.osaka.lg.jp/sokei/tokeimasuta-puran/index.html, June 13th, 2017.
13 Permanent Mission of Japan to the United Nations. According to the WHO, the proportion of a society’s population that is
comprised of persons age 65 or older is called the “aging rate”. If a society’s aging rate exceeds 7%, it is an “aging society”. If the rate surpasses 14%, it is an “aged society”; if over 21%, it is a “super-aged society”. Japan now has an aging rate of 26%, and is categorized as a super-aged society. http://www.un.emb- japan.go.jp/jp/statements/okamura071316.html
14 Osaka Prefectural Government, Aged People Plan of Osaka Prefecture, 大阪府高齢者計画,http://www.pref.osaka.lg.jp/kaigoshien/
keikaku/, August 28, 2017.
15 Machinaka Saien, まちなか菜園 , http://www.machinaka-saien.jp/farm/harukasfarm/, June 13th, 2017.
16 Just Now, 株式会社ジャスナ , http://csijapan.sakura.ne.jp/demo/justnow/business/agricultural/farm02.html, June 13th, 2017. 17 Osaka Prefectural Government, Promotion System of Building’s Greening, 建築物の敷地等における緑化を促進する制度 , http://
References
1. Schukoske, J.E. (2000). Community Development through Gardening: State and Local Policies Transforming Urban Open Space.
Legislation and Public Policy, 3, 351-392.
2. Colding, J., Lundberg, J., Folke, C. (2006). Incorporating Green-area User Groups in Urbanecosystem Management. Ambio, 35,
237-244.
3. Heather A. Okvat, Alex J. Zautra. (2011). Community Gardening: A Parsimonious Path to Individual, Community, and Environmental Resilience. Am J Community Psychol, 47, 374-387.
4. F.M. Kiesling, C.M. Manning. (2010). How Green is Your Thumb? Environmental Gardening Identity and Ecological Gardening Practices. Journal of Environmental Psychology, 30, 315-327.
5. A.E. Van den Berg, M. van Winsum-Westra, S. De Vries, S.M.E.Van Dillen. (2010). Allotment Gardening and Health: A Comparative Survey among Allotment Gardeners and Their Neighbors without An Allotment. Environ. Heal., 9, 74.
6. Satoshi FUKAMI, Osamu NAKAMURA. (2016). Consideration of Multifaceted Value of Allotment Garden. Nagasaki University’s Academic Output SITE, Regional Environmental Study: Annual Report of Environmental Education Study Management Center, 8, 29-34.
7. Krasny, M., Tidball, K. (2009). Community Gardens as Contexts for Science, Stewardship, and Civic Action Learning. Cities and the Environment, 2, 1-18.
8. Partalidou, M., Anthopoulou, T. (2017). Urban Allotment Gardens During Precarious Times: From Motives to Lived Experiences.
2016 European Society for Rural Sociology, 57 (2), 212-228.
9. Holland, L. (2004). Diversity and Connections in Community Gardens: A Contribution to Local Sustainability. Local Environment, 9,
285-305.
10. China YAMADA, Toru TERADA, et al. (2016). Directions for Vacant Lot Management in the Outer Suburbs of the Tokyo Metropolitan Region. Urban and Regional Planning Review, 3, 66-84.
11. Squires, G. Ed. (2002). Urban Sprawl: Causes, Consequences, & Policy Responses. The Urban Institute Press.
12. R.J. Holmer, A. W. Drescher. (2005). Building Food Secure Neighbourhoods: The Role of Allotment Gardens. Urban Agric. Mag., 15,
19-20.
13. Tidball, K. G., Krasy, M. E. (2007). From Risk to Resilience: What Role for Community Greening and Civic Ecology in Cities?
A. E. J. Wals (Ed.), Social Learning towards a Sustainable World: Principles, Perspectives and Praxis (pp. 149-164). Wageningen, The
Netherlands: Wageningen Academic Publishers.
14. C. DeSilvey. (2003). Cultivated Histories in A Scottish Allotment Garden. Cult. Geogr., 10, 442-468.
15. L. Huang, J. Li, D. Zhao, J. Zhu. (2008). A Fieldwork Study on the Diurnal Changes of Urban Microclimate in Four Types of Ground Cover and Urban Heat Island of Nanjing, China. Building and Environment, 43, 7-17.
16. Bowker R., Tearle P. (2007). Gardening as A Learning Environment: A Study of Children’s Perceptions and Understanding of School Gardens as Part of An International Project. Learn. Environ. Res., 10 (2), 83-100.
17. C. Milligan, A. Gatrell, A. Bingley. (2004). Cultivating Health: Therapeutic Landscapes and Older People in Northern England.
Social Science & Medicine, 58, 1781-1793.
18. Lawson, L.J. (2005). City Bountiful: A Century of Community Gardening in America. Berkeley: University of California Press.
19. Schmelzkopf, K. (2002). Incommensurability, Land Use, and the Right to Space: Community Gardens in New York City. Urban Geography, 23, 323-343.
20. Kento TAKANO, Noriko AKITA (2016). Land Use Management of the Urbanization Control Area by the Community-Based Allotment Gardens. Landscape Research, 79(5), 631-634.
21. Juichi YAMAZAKI (1985). A Study on the Actual Condition of an Allotment and Its Role for Regional Environment and Community. Journal of City Planning Institute of Japan, 20, 343-348.
22. Ashita MATSUMIYA, Mari NAKAMURA and Yoichiro UKAI (2015). Using Form and Consciousness Structure of Allotments’ User -- From the Survey of Users of Nagoya City’s Allotments. Social Welfare Studies, 17, 19-36.
23. LIN Yao, Toshio KITAHARA (2001). A Study on the Present Conditions and Subjects of Allotment Gardens in Chiba Newtown - Analysis of their management and using conditions. Journal of Architecture and Planning (Transactions of AIJ), 544, 201-207.
24. Yasunari MIYAKE, Yohei SATOH, Ryuta TAKASE (1999). User Distance Analysis of the Allotment Gardens for the Aged Using the Geographic Information System. Journal of Rural Planning Association, 18, 223-228.
25. Yasunari MIYAKE, Yohei SATOH (1995). A Study on Charateristics of Evaluation for Allotments by Its Users. Journal of the Japanese Society of Irrigation, Drainage and Rural Engineering (Trans. of JSIDRE), 176, 1-9.
26. Akira YUZAWA (2012). A Study on User Characteristic and Effect of Allotment Garden. Journal of Architecture and Planning (Transactions of AIJ), 77, 1095-1102.
27. Rie OBA, Reiji OBASE (2001). A Study on the Allotment Gardens in Tokyo Area and the Financial Situation of Landowners.
Journal of City Planning Institute of Japan, 36, 283-28.
28. Yutaka KUDO. (2009). Historical Change of the Japanese Community Garden and Its Publicness. J. Archit. Plann., AIJ, Vol.74 (9) No.643, 2043-2047.
29. Zhou Yuxin. (2007). Study on the Business Model of Japanese Allotment Garden. World Agriculture, 11, 42-46.
30. Dunnett, N. & Kingsbury, N. (2004). Planting Green Roofs and Living Walls. Timber Press, Portland. Gedge, D. (2002). Roofspace - a place for brownfield biodiversity. ECOS, 22 (3/4), 69-74.
31. Syumi, R. A. R., Hamidah, A., Sapura, M., &Muhamad, S. F. R. (2015). Perception of Green Roof as a Tool for Urban Regeneration in a Commercial Environment: The Secret Garden, Malaysia. Procedia - Social and Behavioral Sciences, 170, 128-136.