TUMSAT-OACIS Repository - Tokyo University of Marine Science and Technology (東京海洋大学)
Statistical Analysis and Design of a Rudder
Roll Stabilization System
journal or
publication title
東京商船大学研究報告. 自然科学
volume
47
page range
111-118
year
1997
URL
http://id.nii.ac.jp/1342/00000544/
Statistical
Analysis
and Design
of
a Rudder Roll Stabilization
System
Kohei
Ohtsu
Department
of Marine
Technology
Abstract : The multivariate auto-regressive rudder roll control system (MARCS) proposed by the authors has been improved by being designed using a new type of performance index which attempts to keep the movement of the rudder motion as smooth as possible. Further-more the MARCS is statistically analyzed from the point of view of rudder-roll-yaw coupling motions, using noise contribution functions and impulse response functions.
Keywords : Rudder roll control system, rudder-roll-yaw coupling motion, multivariate auto-regressive (MAR) model, multivariate auto-regressive rudder roll control system (MARCS).
1. INTRODUCTION
It is a common experience for mariners, to see that steering with a ruddergenerally induces rolling of the ship, though the original aim of the rudderis to keep the ship's heading to the required course. At the first stage, when a rudder is steered, usually a ship heels in an inward direction, due to the roll moment acting on the rudder. At the next stage in steering, the main heel may change to an outward direction. This coupling between rudder and roll motion has become an attractive problem from the pojnt of view of roll stabilization using the rudder, because it is a natural insight that if the rudder action is skillfully related to the change of roll as well as to the course deviation, the roll can be reducedto a certain degree. This interesting problem has been discussed by many researchers (Kallstrom, 1981; van Amerongen, et a!., 1984). Ohtsu and Kitagawa (1979), foresaw that roll reduction by meanofthe rudder is possible by
applying a simple multivariate auto-regressive (MAR) model and its optimal control theory. However, since the most important role of a ship's autopilot is to maintain her course, the main problem with this kind of autopilot system, having the ability to reduceroll, is how to compromise between the two roles of the autopilot system. Oda, et al. (1992) and Sasaki, et al. (1993) developed a rudder roll stabilization control system based on this theory, called the MARCS (multivariate auto-regressive rudder roll control system).
The main aim of this paper is to discuss the results of the actual full-scale sea trials carriedout on various types of ship and to make clear their statistical properties, using the actual data. Section 2 proposes some new ideas on designing the MARCS. In the new system, the MARCS provides the criterion function of performance which takes account of the movement of the steering gearas well as the
(112) K.Ohtsu
behavior of a ship, to prevent frequentuse of the rudder. The principal design of the MARCS and the hardware implementation are also described. Section 3 details experiences from full-scale trials applied to several types of ship. The typical results of the new type of MARCS are shown in this section. Section 4 analyzes the full-scale experimental records from a statistical point of view, in order to make cleat especially the coupling effects between the roll and yaw motions of the MARCS, using the tools of power spectra, relative noise contribution functions and impulse response functions. These tools are introduced by a MAR model fitted to the actual data.
2. DESIGN OF THE MARCS
Jp=EI X ( X(n)'QX(n)+Y(n-l)1RY(n-l)
Ln=l
(3)
where the first term Q in the bracket is the penalty to the course and'the roll rate deviation from the desired values. The second term R is the penalty to the rudder action. P is chosen large enough that any future increase of Jp does not produce a significant change of the control gain. As is well known, the optimal solution of this problem is given by a feedback law with the stationary gain G. Then the optimal control law is represented by
Y(n) = GZ(n). (4)
2.1 Statistical Control of the MARCS
The philosophy behind the MARCS is that the ruddercan be used as the actuator to control both steering and roll reduction. In order to control the two outputs ofyaw and roll motion with only one input from the ruddermotion, the control law of the MARCS must be based on multivariate control theory. The basic model adopted here for prediction of roll and yaw motion is a control type of the MAR model
x(n)= Jj a(m) x(n-m) + j? b(m) Y(n-m) + u(n)
m»1 m«I
(1)
where X(n) denotes a 2-dimensional state vector whose components areyaw and roll motion, and Y(n) denotes a 1-dimensional control vector with one, namely ruddermotion. The order M of this model is obtained by the Minimum AIC Estimate (MAICE) procedure (Akaike and Nakagawa, 1994), using the data gained from the preliminary full-scale trials for the identification of the ship's steering dynamics. Once the MAR model has been identified, a state-space representation of the ship's steering dynamics is given by
Z(n) =.H Z(n-l) +. r Y(n-l) + U(n) X(n) = H Z(n) (2)
whereZ(n) is the state vector and E is the transfer matrix that controls the transition of the state Z(n). F is the control vector, and H is the observation vector. U(n) denotes a white noise vector. Now, to formulate an optimal control problem, a quadratic criterion function Jp is adopted :
2.2 New Idea in Designing the MARCS
To make the steering motion smoother, a new version of the ,MARCS provides a new criterion function of the performance, that takes account of the movement of the steering gear. This criterion function must penalize three undesirable quantities. The first is the.deviation of the roll and yaw motions from.the desired values. The second is the amount of rudder motion. The third is the rate of change of the steering gear. To fulfill these demands, the new criterion is adopted for Jp:
JP=[£ (X(n)' QX(n)+ Y(n-l)' RY(n-l)
+"( Y(n-l) - Y(n-2) )' T( Y(n-l) - Y(n-2) )]]
(5)
In this formulation, the third term is the penalty to the change of the rudderangle. In this case, the optional control law is obtained from
Y(n) = GZ(n) + FY(n-l) (6)
where G and F are the optimal control gain and the optimal smoothing factor (Ohtsu and Kitagawa
1984). If the weighting matrices T are set to zero, the criterion function is reduced to the well-known quadratic cri terion.
2.3 Hardware Implementation of the MA RCS
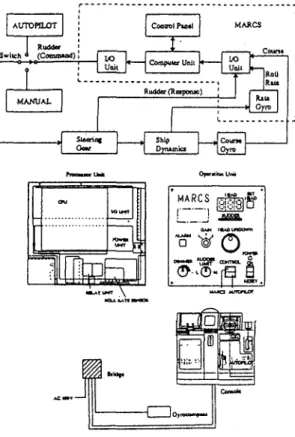
In order to utilize the ship's own original autopilot set-up as much as possible, the MARCS was
installed in the spare circuit of the autopilot system asshown in Figure 1. Theprocessorunit is madeup of a computer, an interface and a roll-rate sensor. On
the operation unit, one of three control gains can be selected, and the course can be set. Thus, by turning on the mode switch of the operation unit, one can easily select one of two control modes, the original
autopilot or the MARCS. Moreover, when an abnormal condition occurs in the MARCS, one can immediately switch off the MARCS and go back to the original autopilot, or to a manual steering mode
(Oda, et al., 1995).
AU TO PIL OT C ontrol Pm *I I R udder
sw itch ・ (Com m aod) Z H Z _ . c_ IS , H ^ ^ '- ^ ' r H touail 1 R o ll L - . . . , . . - _ _ - - . , R t u R u d d e r ( R e サ p o n サ c ) K i t* G y ro I ^ ^ ^ ^ H I m j t O IM T fi fi f I K X K W l* * T I B S = ^ ^ ^ H ^ ^ ^ ^ 9 i i l
I
iSii^ m !蝣 IVI I å £»«X ,M^R£.^ iHi'i »•E•E>t5S?" OHM. MA«awivuir D 0 m 13 1 !". !サ rliFig. 1 Hardware implementation of the MARCS
3. RESULTS OF FULL-SCALE TRIALS
3.1 Experimental Results
The full-scale measurements were carried out on various types of ships. These included measurement of roll angle, roll rate, heading and rudder angle. The rudder roll stabilization system was tested by making comparative measurements with and without the MARCS, having the autopilot at a constant setting. The comparative tests were carried out immediately after each other, in order to minimize any statistical variation in sea conditions. The control signal to the steering system was commanded by the MARCS at every 0.5-sec period.
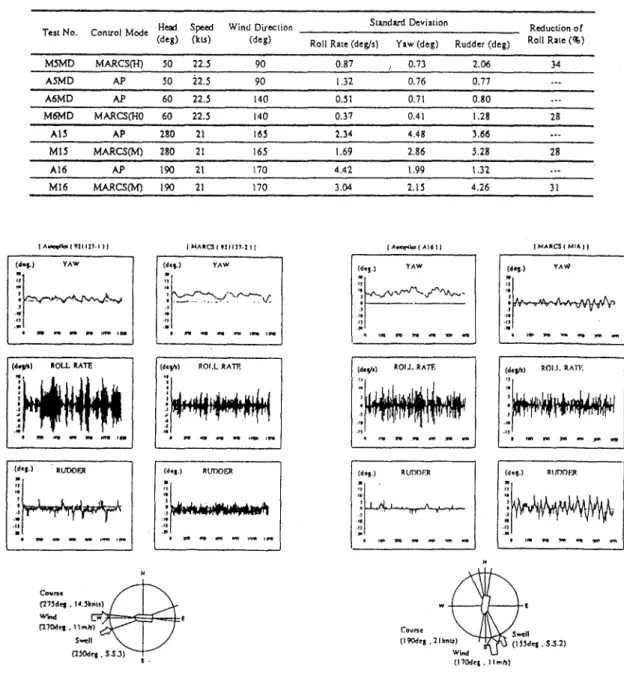
The principal dimensions and roll reduction of five ships are shown in Table 1. In this paper, the new results are demonstrated by two types of ship, referred to below as ship D andship E. Figures 2 and3 show typical results of time 'histories of the yaw, the roll rate and the rudder motion, using the MARCS and the conventional autopilot. Both of the experiments were implemented under conditions of wind scale 2 and quarter bow sea. Tables 2 and 3 show the standard deviation of the yaw, the roll rate, the rudderand the reduction ratio of the roll rate. The reduction ratio of the roll rate is defined by
Reduction (%)=^'MARCS x lOO AP (7)
where "AP" denotes the standard deviation of the roll rate in the conventional autopilot. "MARCS" denotes the standard deviation of the roll rate in the MARCS. From these figures and tables, it can be concluded that the roll motion using the MARCS decreases in comparison with that produced by the conventional autopilot. The MARCS reduced the roll motion on average by 30 - 50 %. Also, the yaw motion obtained by the MARCS can maintain the desired course within the allowable limits.
Table 1 The principal dimensions and roll reduction
S h ip S h i p A S h i p B S h i p C S h i p D S h i p E U e m G T ( t ) 4 2 5 2 6 3 0 9 3 3 3 3 0 3 4 6 L X B X D ( m ) 4 6 X l O X 3 . 8 8 3 X l O . 5 X 4 . 5 8 5 X l O .5 X 4 . 5 6 3 X 7 . 9 X 4 . 4 5 2 X 7 . 5 X 2 . 3 S p e e d ( k n o t ) 1 3 . 5 1 6 . 5 1 9 1 7 . 6 2 6 .3 R o l l P e ri o d ( s e c ) 6 - 7 l l 1 0 . 5 g 4 . 6 R u d d e r A r e a ( m 2 ) 4 . 3 1 0 . 3 4 . 3 X 2 4 . 3 X 2 1 . 3 X 2 R u d d e r S p e e d ( d e g / s e c ) 3 . 0 - 5 . 0 2 . 3 3 . 3 2 . 3 3 . 6 R e d u c t i o n o f R o l l R a t e ( % ) 4 0 - 5 0 3 0 ^ 4 0 3 0 - 4 0 3 0 - 5 0 3 0 - 4 0
(114) K.Ohtsu
Table 2 The results of full-scale experiments (Ship D)
T ォ t N o . C o n tr o l M o d e ( d e g ) * " ・ S p " ? ( k u ) W in d - ^( d e g ) C d e g ) m S t a n d a r d D e v i a t i o n R o l l R i t e ( d e g / j ) Y a w ( d e g ) R u d d e r ( d e g ) R e d u c t i o n o f R o l l R a t e ( % ) 9 2 1 1 2 7 - 1 M A R C S (M ) 1 5 0 1 4 . 6 2 8 0 2 .0 0 1 . 6 8 2 .4 8 5 0 .4 9 2 1 1 2 7 - 2 A P 1 5 0 1 4 . 7 2 8 0 4 . 0 3 1 . 5 5 2 .2 2 9 2 1 2 2 5 - 5 A P 1 7 6 1 3 . 9 2 8 5 3 .7 7 2 . 6 4 4 .9 6 . 9 7 1 2 2 6 - 6 M A R C S ( M ) 1 7 6 1 3 . 9 3 2 0 2 .0 7 3 . 3 6 3 . 1 5 4 5 . 1 1 2 2 8 - 1 M A R C S ( M ) 1 1 5 1 7 3 3 0 0 . 5 3 3 .2 4 2 . 5 9 2 4 . 3 1 2 2 8 - 2 A P 1 0 8 1 7 3 3 0 0 . 7 0 2 .3 1 3 . 1 4 0 1 0 6 - 1 A P 9 6 1 7 2 8 0 0 . 4 2 2 . 3 3 2 . 9 8 0 1 0 6 - 3 M A R C S ( M ) 9 6 1 7 2 8 0 0 . 2 6 3 . 6 7 2 .4 9 3 8 . 1
Table 3 The results of full-scale experiments (Ship E)
T ォ t N o . C o n t r o l M o d e c d e g ) H e a d S p e e do c u ) W i n d ( d e g ) ( d e g )D ir e c t io n S i i n d a r d D e v i a t i o n R o l l R a c e ( d e g / s ) Y a w (d e g ) R u d d e r ( d e g ) R e d u c t i o n o f R o l l R a t e ( % ) M 5 M D M A R C S ( H ) 5 0 2 2 . 5 9 0 0 . 8 7 0 . 7 3 2 . 0 6 3 4 A 5 M D A P 5 0 2 2 . 5 9 0 1 .3 2 0 . 7 6 0 . 7 7 A S M D A J > 6 0 2 2 . 5 1 4 0 0 .5 1 0 . 7 1 0 . 8 0 M S M D M A R C S f H O 6 0 2 2 .5 1 4 0 0 . 3 7 0 . 4 1 1 . 2 8 2 8 A 1 3 A P 2 8 0 2 1 1 6 5 2 . 3 4 3 . 6 6 M 1 5 M A R C S fM 1 2 8 0 2 1 1 6 5 1 . 6 9 2 . 8 6 5 .2 8 2 8 A 1 6 A P 1 9 0 2 1 1 7 0 A A 1 1 .9 9 1 .3 2 M 1 6 M A R C S ( M ) 1 9 0 2 1 1 7 0 3 . 0 4 2 . 1 5 4 .2 6 3 1
( A«c*lt0< (91l llM J l IMARCS(flHlM)I (A»npW(Alii|
('•E»å )
(iipi) KOLL RATE
tm *•E m n ««!•E>
f^Wpfy^y^
Co» rje C275dcj. H.JVnu) ww tntWct , llmA) S-ell OSftfrj , S.SJ) «<».) "V. (i«V>)k
(d «J. ) RUDOERH-*
< < ・ ! 蝣 ) l l ) ) I I ^ ^ y ^ w * m o n y サ ォ ・ j サ ォ w W« !/0 »n) Course (190<fcj , 2lknu) Wind (<!«»å > 1/W-vvv^AvvvvyWV W«0) •E rat ra )M m yn m «•E!å > HWI-(I7(Mc|. llmA)Fig. 2 Time histories in the experiment with the Fig. 3 Time histories in the experiment with the autopilot and the MARCS(Ship D) autopilot and the MARCS(Ship E)
loops, called noise contribution functions defined in the frequency domain. The ratio
Pi i(f) (ll)
is called the "relative noise contribution", where <\:(f)
gives the amount of the contribution of the noise
Uj(n) to the power spectrum of the process X;(n), and
P;j(f) denote the power spectrum of the i-th process
X:(n). The cumulative function,
Rij(f)= X Yih(f)
h = 1
is useful for graphical display.
(12)
Figure 5 shows a comparison of the noise contribution functions of the conventional autopilot and the MARCS in the full-scale experiment on Ship A. It is indicatedin Figure 5 [A-l],[A-2] that the effect of the roll rate on the yaw motion has a large contribution at around the peak frequency (0.16Hz) of the roll motion. Figure 5 [B-l],[B-2] shows the noise contribution functions to the roll rate from the rudder motion, the yaw and the roll rate itself. In the case of the MARCS ([B-2]), the contribution of the rudder motion to the roll rate is very high. From this fact, it can be detected that the rudder motion induces the roll motion. Figure 5 [C-l],[C-2] shows the noise contribution function to the rudder motion from the roll rate, the yaw and the ruddermotion itself. Figure 5 [C-2] shows that the MARCS feeds back the roll rate from around the peak frequency of the roll motion.
42 Noise Contribution Function and Impulse Response Function Analysis
If the X(n) in eq.(10) is composedof roll, yaw and rudder motions, the noise contribution function in the roll is defined as the contribution to the roll power spectrum from the yaw, the rudder mo'tions and the roll motion itself. Thus the effect of rudder motion can be related to roll andyaw motions.
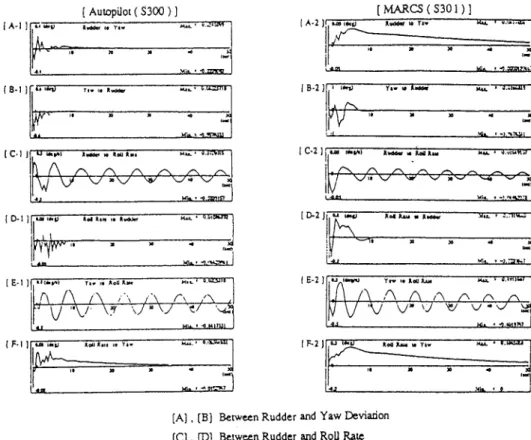
Figure 6 shows the impulse response functions of the conventional autopilot and the MARCS in the full-scale experiment on Ship A. From Figure 6 [C-l],[C-2], one can understand the reason, by comparing the impulse response function of the roll motion with the ruddermotion. It is seen in these figures that the response of the roll motion induced by the rudder motion always comes out at around the natural period of the roll. Looking carefully at these
[ Autopilot( S300 ) ]
(A-ll
•E^
Rudder lo Y*w\ Roll Hit In Yiw Yiwu, Yiw
(B-l|
Rudder u> Roll feu RoU Raw u> RoU R*uj
r^z
Yiw us Roll Rue
IC-II tMARCS(S301 ) ) [A-l| 18-ll - R u d d e r to R o ll ft i i* v Y t w u > R o l l R o ll R a u9 m m u > R o U R ォ e I [C-21 / R o ll P m * t o R u d d e rR u d d e r R u d d e r to to R u A fe r R u d d e r ^ ' ^ ^ サ '" ^ ^ " 'ォ ^ ^ サ ' - ^ W ^ W M B I I (A) ToYaw (B) ToRollRate (C) ToRudder
(116) K.Ohtsu
The comparison of typical values with the MARCS arid a fin-roll-stabilizer system are shown in Table 4. The main advantage of such a rudder roll stabilization control system would be much lower investment cost compared with other stabilization systems such as fin-roll- stabilizers or anti-rolling tank systems.
Table 4 Comparison of typical values of the
M A R C S a n d fin s ta b iliz e r M A R C S F in S la b iliz e r V o lu m e 2 0 k g 3 0 0 0 k g S p ac e 4 0 C o st R atio 1 ] 0 M a in te n an c e L o w C ost E x p e n s iv e R ed u c tio n 3 0 % 4 0 % 7 0 % 8 0 % 3.2 Design ofAdvancedMARCS
It may be observed that the amount of the rudder motion is considerable, and the rate of the rudder motion is high. To avoid this large andquick motion of the control signal as seen in the rudder motion, one can introduce the new criterion using the T matrices. The MARCS provides the T matrices, defined by eq.(5), which take account of the movement of steering gear to diminish this fault. Figure 4 shows typical results of the time histories in a full-scale experiment using ship A. The performance of the original autopilot system is also shown in this figure. From these results, it can be seen that the MARCS with T matrices might have the ability to reduce the roll rate, while maintaining the yaw motion within the allowable limit.
4. STATISTICAL ANALYSIS OF SHIP MOTIONS
4.1 Statistical Analysis Method
This section gives an analysis of the ship's actual data, when steered by the conventional autopilot and by the MARCS system. The MAR model is also useful for the analysis of such feedback systems. Assume that each x;(n) ofX(n) is represented by
M k
xi(n)= X Eaij(m) Xj(n-m) + Uj(n)
m=1j=1 (8) *ti ) r-~ ^•EVMAr*H^HH!>y'>.t'\.->W.« ^ ft' AJ'VAl Wi ffr+t ' >å *å * å •E "T
å 'å ^
fff^M^i
«X>(**)Fig. 4 Time histories in the experiment by the
MARCS with T matrices(Shi'p A)
where a^m) of A(m) is the impulse response
function from Xj(n) to X;(n), Uj(n) is a colored noise,
and aii(m)=0. It is well known that, in the presence of
feedback loops, the direct application of the ordinary
least-squares method yields biased estimates unless
Uj(n) is a white noise. This difficultycan be avoided
by an AR modeling of the colored noise U:(n)
U i(n) = £ CiCJ) ui(n-j) + £i(n)
(9)
Then, it can be shown that the model using eq.(8)
with eq. (9) can be expressed by a MAR model
M+k
X(n)= £ A(m) X(n-m) + E(n)
m=l ^V>
where E(n) is a white noise.
The most important problem is the choice of the order of the MAR model. To realize this determination of model order, the minimum AIC estimate (MAICE) procedure is employed. Once the MAR model with some orderis fitted to the actual data, many important tools for analyzing a system are introduced (Akaike and Nakagawa, 1994). An impulse response function of the j-th component to the i-th one is calculatedby eq.(10), and other functions, such as a spectrum and a closed-loop frequency response function, are also obtained. Moreover, Akaike (1968) introduced a new important concept for analyzing a system with some feedback
AuiopUot ( S300 ) ] サ J M . U i w M v lォ Y i - M * t ' ォ .J ' U V I k e サ M ォ S -4 1 a (B-l] (ClI' [ D-l HCtJ n* i« Km M u . 蝣 O J W I S A / s / ¥ / ¥ / T V - j T ¥ V j ^ j t w サ ¥ y w ^ s * ^ M k . < Hj .a n in
P^r
[E-l )|,"»*«AA
/\
7^7^
Y7J ±-V v (F-n A-tollfU.t IB Ti-Cjjl. M A R C S ( S 3 0 1 ) ] I A - 2 J I B - 2 J I C - 2 ] D - 2 E - 2 ] I F - 2 ) % m <* t {j K w W tf w T w ・*サ * . ・ ォ 蝣蝣* ・蝣* サ J II * サ * ・ M ^ ^ B H ^ ^ ff l ォ <・*サ ) Y サ w lO A w fc M r M M . " X z ^ ' V M it ' - J .-t n S l X M te サ JL o 41 K im 蝣 / N S ¥ s ¥ / ¥ ^ ii ¥ ^ r W V サ 蝣- ' ^ 5 ^y
I k "" " K o t JU u 蝣 JL m "T I x サ *4 M 1/ " - s = " (I m iサ . ・ - j .r ^ i fc i T A / ¥ r ¥ / ¥ V V v v - v:J ^ J ¥ JM i* . *' ¥J 1 W lt NG Jt oti JU u w Y iwI- ^
I t サ サ^
ォ- -II
- *J Mi l ・ 0 ][A] , [B] Between Rudder and Yaw Deviation (C] , [D] Between Rudder and Roll Rate [E] , [F] Between Yaw Deviation and Roll Rate
Fig. 6 Impulse response function of the conventional autopilot and the MARCS
figures, one can clearly detect that the roll damping of the MARCS is stronger than that of the conventional autopilot. Figure 6 [D-l],[D-2] shows the impulse response function of the rudder to the impulse change of the roll rate. It is seen from Figure 6 [D-2] that the opposite rudder action to the
change of the impulse roll rate motion at the initial stage gives rise to checking steering. The impulse response function between the roll rate and the yaw motion is shown in Figure 6 [F-l],[F-2]. One can comprehend that the heeling to one side induces the yaw motion.
movement of steering gear is also presented. Furthermore, by statistically analyzing the influence of rudder-roll-yaw coupling motions in the applications of this advanced control method, the effect of rudder motion on roll and yaw motions can be understood.
It can be concluded that the MARCS reduced the roll motion on averageby 30 - 50 % in comparison with a conventional autopilot. It is also concluded that the MARCS not only keeps to the required course,, but also reduces roll motion, even in rough seas.
5. CONCLUSIONS
This paper presents a rudder roll stabilization control system which is called the MARCS. The philosophy behind the MARCS is that a ruddercan be used as the only actuator to control yaw and roll motions at the same time. By means of full-scale experiments using various types of ships, it has been shown that the MARCS developed here exhibits good performance. The advanced MARCS, with a new performance criterion which takes account of
ACKNO WLEDGE MENTS
In the full-scale experiments described in this paper, helpful support was given by the captains and crews of the various ships, with especial thanks to Shioji Maru. Helpful suggestions and encouragement were received from Dr. M.Hamamoto, Dr. Y.Yamanouchi, Dr. M.Hirano and other colleagues in the Akishima Laboratories (Mitsui Zosen.) Inc., and M.Sasaki of the Mitsui Engineering & Shipbuilding Co., Ltd.
(118) K.Ohtsu
REFERENCES
Akaike, H. (1968). On the Useof a Linear Model
for the Identification ofFeedback Systems.
Ann. Inst. Statist. Math. Vol.20.
Akaike, H. and T. Nakagawa (1994). Statistical
Analysis and Control of Dynamic
Systems. Kluwer Academic Publishers.
Kallstrom, C.G. {\9U). Control ofYawandRoll a
Rudder Fin Stabilization System.
Proceedings 6th Ship Control Systems
Symposium, Ottawa, Canada.
Oda, H., K. Ohtsu and T. Hotta (\995).Study on
Roll Stabilization by Rudder Control.
The Journal of Japan Institute of
Navigation. Vol.92.
Oda, H., K. Ohtsu, M. Sasaki, Y. Seki andT. Hotta
(1992). Rudder Roll Stabilization Control
System through Multivariate Auto
-Regressive Model. CAMS'92. Italy.
Ohtsu, K. andG. Kitagawa(1979). A New Ship's
Auto Pilot Design through a Stochastic
Model. Automarica, Vol. 15, No.3.
Ohtsu, K. and G. Kitagawa (1984). Statistical
Analysis of the AR Type Ship's
Autopilot System. Journal of Dynamic
System. Measurement and Control.
Vol.106.
Sasaki, M., H. Oda, Y.Seki, K. Ohtsu and T. Hotta
(1993). Actual Experiences in Designing
Rudder Roll Control System. SCSS'93.
Canada
vanAmerongen,J., P. G. M. van der Klugt and
J.B.M. Pieffers (1984). Model Tests and
Full Scale Trials with a Rudder Roll
Stabilization System. Proceedings 7th
Ship Control Systems Symposium, Bath,