Systemic inflammation and family
history in relation to the prevalence
of type 2 diabetes based on an
alternating decision tree
Hirokazu Uemura
1,*, A. Ammar Ghaibeh
2,*, Sakurako Katsuura-Kamano
1, Miwa Yamaguchi
1,
Tirani Bahari
1, Masashi Ishizu
1, Hiroki Moriguchi
2& Kokichi Arisawa
1To investigate unknown patterns associated with type 2 diabetes in the Japanese population, we first used an alternating decision tree (ADTree) algorithm, a powerful classification algorithm from data mining, for the data from 1,102 subjects aged 35–69 years. On the basis of the investigated patterns, we then evaluated the associations of serum high-sensitivity C-reactive protein (hs-CRP) as a biomarker of systemic inflammation and family history of diabetes (negative, positive or unknown) with the prevalence of type 2 diabetes because their detailed associations have been scarcely reported. Elevated serum hs-CRP levels were proportionally associated with the increased prevalence of type 2 diabetes after adjusting for probable covariates, including body mass index and family history of diabetes (P for trend = 0.016). Stratified analyses revealed that elevated serum hs-CRP levels were proportionally associated with increased prevalence of diabetes in subjects without a family history of diabetes (P for trend = 0.020) but not in those with a family history or with an unknown family history of diabetes. Our study demonstrates that systemic inflammation was proportionally associated with increased prevalence of type 2 diabetes even after adjusting for body mass index, especially in subjects without a family history of diabetes.
The prevalence of type 2 diabetes has been increasing globally1. Obesity is a key risk factor for various chronic
diseases, including type 2 diabetes2,3. A number of other risk factors have also been identified for type 2 diabetes.
However, unknown factors or patterns may also affect the risk for type 2 diabetes. We have conducted a prospec-tive cohort study since 2008 in Tokushima Prefecture, Japan. This cohort study has included considerable baseline data (about 240 variables) on medical history, family history of diseases, lifestyle characteristics, anthropometric measurements, and biochemical examinations4,5.
In the present study, we first generated a prediction model for the prevalence of type 2 diabetes in this baseline dataset using alternating decision tree (ADTree) algorithm6, a powerful classification algorithm for data mining.
There has been a recent increase in the use of data mining methods in various aspects of medicine due to their promising results7–9. Data mining aims to extract useful information from available data by applying techniques
from various fields including databases, machine learning, statistics, and visualization10.
The resulting ADTree in the present study indicated that having a positive or unknown family history of diabetes showed positive impact on the prevalence of type 2 diabetes; furthermore, in subjects without a fam-ily history of diabetes, increased serum levels (≥ 0.26 mg/L) of high-sensitivity C-reactive protein (hs-CRP), a systemic inflammatory marker, showed positive impact on the prevalence of type 2 diabetes. Having a family history of diabetes is a well-recognized risk factor for developing type 2 diabetes11. Low-grade systemic
inflam-mation has also been reported to be associated with various diseases including type 2 diabetes12,13. However, the
combined associations of family history of diabetes and systemic inflammation with type 2 diabetes have been scarcely reported, especially in the Japanese population. Therefore, we performed hypothesis testing and logistic
1Department of Preventive Medicine, Institute of Biomedical Sciences, Tokushima University Graduate School,
3-18-15, Kuramoto-cho, Tokushima 770-8503, Japan. 2Department of Medical Informatics, Institute of Biomedical
Sciences, Tokushima University Graduate School, 3-18-15, Kuramoto-cho, Tokushima 770-8503, Japan. *These
authors contributed equally to this work. Correspondence and requests for materials should be addressed to H.U. (email: uemura.hirokazu@tokushima-u.ac.jp)
received: 25 October 2016 accepted: 01 March 2017 Published: 31 March 2017
OPEN
history of diabetes (n = 14), or any potential confounding factors included in the multivariable-adjusted models (n = 31); (3) extremely high (> 4,000 kcal/day) or low (< 1,000 kcal/day) estimated daily energy intake (n = 11); and 4) missing serum hs-CRP values (n = 5) or values ≥ 10 mg/L (n = 15) (confirmed acute inflammatory status), history of rheumatoid arthritis (n = 4), which is accompanied by systemic inflammation, and/or regular use of anti-inflammatory analgesics (n = 48) that could affect serum hs-CRP values. The remaining 1,102 subjects (556 men and 546 women) were included in the analyses.
All participants in the J-MICC Study provided written informed consent prior to participation. This study was conducted according to the principles of the Declaration of Helsinki, and the ethics committees of Nagoya University School of Medicine (the affiliation of the former principal investigator, Nobuyuki Hamajima), Aichi Cancer Center (the affiliation of the current principal investigator, Hideo Tanaka), and Tokushima University Graduate School all approved the protocol of the present study.
Questionnaire.
All participants were requested to complete a structured self-administered questionnaire regarding lifestyle characteristics, including leisure-time exercise, smoking status, alcohol consumption, and die-tary habits over the past year at the baseline survey, as described previously4,5,15. This questionnaire also includedthe questions about medical history and family history of diseases.
Leisure-time exercise was divided into three categories: light exercise such as walking or hiking, moderate exercise such as light jogging or swimming, and vigorous exercise such as marathon running or competitive sports, based on the intensity of the exercise: 3.4, 7.0, and 10.0 metabolic equivalents (METs), respectively. The amount of each exercise category was calculated by multiplying the frequency and duration of each exercise activ-ity (MET level × hours per activactiv-ity × activactiv-ity frequency per week); these were summed to estimate the degree of leisure-time exercise and are expressed as MET-hours/week, as described previously15.
Dietary evaluations were conducted using a validated short food frequency questionnaire (FFQ)16–19. The
FFQ included questions regarding the intake of 47 foods and beverages, listed in Fig. 1, over the previous year. Information concerning the intake frequency and amounts of the 3 staple foods (i.e., rice, bread, and noodles) consumed at breakfast, lunch, and dinner was obtained. The volume and frequency of the consumption of alco-holic beverages including sake, beer, shochu (a Japanese distilled beverage), chuhai (a sweetened beverage mixed with shochu), whiskey, and wine, were determined. Only the intake frequency was obtained for the other 43 foods and beverages as follows (eight categories): three or more times/day (3/day), twice/day (2/day), once/day (1/day), 5–6 times/week (0.8/day), 3–4 times/week (0.5/day), 1–2 times/week (0.2/day), 1–3 times/month (0.1/day), and never or seldom (0/day). Daily energy intake and carbohydrate intake were calculated using a program developed by the Department of Public Health, Nagoya City University School of Medicine16,17.
Additionally, medical history of diabetes (yes, no, or unknown) for each subject’s mother and father was obtained. When neither the mother nor father had a medical history of diabetes, the subjects was considered negative for a family history of diabetes; when either the mother or father had a medical history of diabetes, the subjects was considered positive for a family history of diabetes. In others cases, a family history of diabetes was regarded as unknown.
Measurements and diabetes assessment.
Body height and weight were measured to the nearest 0.1 cm and 0.1 kg, respectively, at the time of health check-up. Body mass index (BMI) was calculated as weight (kg) divided by height (m) squared. Venous blood was drawn from each participant, and serum was separated within three hours. Fasting plasma glucose levels were obtained from the health check-up data, and hs-CRP levels in stored sera at − 80 °C were also measured at an external laboratory (BML Inc., Tokyo, Japan).Diabetes was defined as a fasting plasma glucose level ≥ 126 mg/dL or as receiving diabetes treatment20.
Statistical analyses.
Our data had a large imbalance; i.e. there were a fewer number of cases of type 2 dia-betes compared to the number of non-cases. In such situations, standard data mining techniques such as decision trees usually fail to provide good results21,22. Setoguchi et al.23 used alternating decision trees in a highly skeweddata set to predict the potential for developing pressure ulcers in in-hospital patients. We used a similar approach in our work. Decision trees are powerful classification methods that have been used successfully in many medical studies24 because they provide easily understandable graphical classification rules with good accuracy. However,
decision trees and many other machine learning and statistical methods encounter difficulties when working with highly skewed and imbalanced data21. One solution is to apply a boosting algorithm25. Although boosting
can improve the performance of decision trees, it results in multiple trees and makes the results difficult to under-stand. Freund et al.6 have developed an easy-to-understand decision tree that combines two-layer decision trees
(decision stumps) and Adaptive Boosting (AdaBoost)26 to generate a single, easily understandable tree called
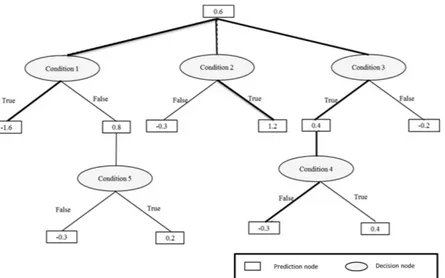
ADTree. An ADTree consists of two kinds of nodes: decision nodes and prediction nodes, as shown in Fig. 2. It starts with a prediction node at its root, then alternates between decision nodes and prediction nodes until it finally terminates with prediction nodes. A decision node provides an inequality condition for one of the input factors (e.g. family history of diabetes) and followed by two prediction nodes correspond to each of the two pos-sible inequality results (True or False). Each prediction node has a real value that indicates the contribution of the corresponding inequality result to the final classification (i.e. diagnosis). Depending on the inequality result further decision nodes might be added before we finally reach a terminal prediction node. The route from the root node to any of the terminal prediction nodes is usually referred to as a path where in general an instance can trav-erse multiple paths. The final classification is determined by the sign of the summation of the values of all predic-tion nodes that belong to all instance multiple paths. A positive sign indicates a positive class, and a negative sign indicates a negative class. The factors used in the decision node inequality are determined through a search pro-cedure that look for the factor with best classification power. The ADTree was generated using RapidMiner Studio Ver. 7.2 (http://www.rapidminer.com), and was validated using 10-folds cross validation technique10. 10-folds
cross validation is a low variance estimation method widely used in data mining. The data set is divided into 10 subsets and the classification model is generated 10 times. During each run, one of the subsets is used for valida-tion and the remaining 9 subsets combined are used for model generavalida-tion. The average and standard deviavalida-tion of the 10 validations are reported. The generated ADTree’s accuracy, sensitivity, and specificity were 69.6 ± 5.2%,
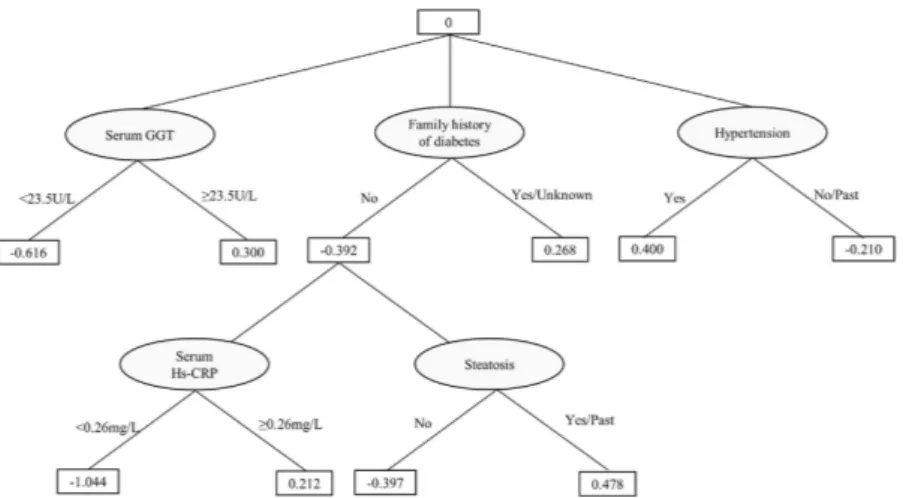
72.3 ± 22.4%, and 69.4 ± 6.2%, respectively. The ADTree showed that having a positive or an unknown family history of diabetes was related to increased prevalence of type 2 diabetes; within the group of subjects without a family history of diabetes, elevated serum hs-CRP level was related to increased prevalence of type 2 diabetes (shown in Fig. 3). To calculate the statistical importance of each factor in the ADTree, we performed logistic regression analyses. In these analyses, family history of diabetes was divided into two categories according to the ADTree; “negative” and “positive or unknown”. The prevalence rates of diabetes according to “negative”, “positive”, and “unknown” status were 3.2%, 9.2%, and 8.3%, respectively.
Continuous variables were expressed as means ± SD or medians (25th percentile, 75th percentile). Categorical
variables were expressed as the number (%). Two sample t-test, Wilcoxon rank sum test, or chi-square tests were used to compare the baseline characteristics between subjects having negative and positive/unknown family his-tory of diabetes as appropriate. Logistic regression analyses were performed to evaluate the associations between serum hs-CRP levels and the prevalence of type 2 diabetes after adjusting for the following covariates: (1) age (continuous) and sex (model 1); (2) age, sex, recruitment group (binary), smoking status (current, past, and never), current alcohol drinking (no, yes), leisure-time exercise (MET-hours/week; quartiles), daily carbohydrate intake (g/day; continuous), and daily energy intake (kcal/day; continuous) (model 2); (3) the covariates in model 2 plus BMI (kg/m2; quartiles) (model 3); and (4) the covariates in model 3 plus family history of diabetes
(nega-tive; positive or unknown) (model 4).
We also evaluated the combined associations of serum hs-CRP level (≤ median, > median) and family history of diabetes (negative, positive or unknown) with the prevalence of diabetes by similar logistic regression analy-ses. The effects of the interactions between serum hs-CRP level and family history of diabetes on the prevalence of diabetes were evaluated by including interaction terms in the models. We further evaluated the associations between serum hs-CRP level (three categories: first plus second quartiles, third quartile, and fourth quartile in all subjects) and the prevalence of diabetes stratified by family history of diabetes. In this stratified analysis, in addi-tion to the strata of negative and positive/unknown family history, the stratum of positive family history alone (excluding unknown family history) was also evaluated, and stratum-specific quartiles of leisure-time exercise and BMI were included in the models.
All calculations and statistical tests were performed using SAS version 9.4 (SAS Institute Inc., Cary, NC, USA). All statistical tests were based on 2-sided probabilities, with a significance level of P < 0.05.
Results
As shown in the resulting ADTree in Fig. 3, having a positive or unknown family history of diabetes showed positive impact on the prevalence of type 2 diabetes; in addition, within the group of subjects without a family history of diabetes, elevated serum hs-CRP levels (≥ 0.26 mg/L) showed positive impact on the prevalence of type 2 diabetes.
Baseline characteristics of the subjects according to family history of diabetes.
Table 1 shows the baseline characteristics of the subjects according to their family history of diabetes. The prevalence of diabetes was significantly higher (8.8%) in subjects positive for or with an unknown family history of diabetes than that (3.2%) in subjects without a family history of diabetes. Subjects positive for or with an unknown family history of diabetes were older and had a lower level of leisure-time exercise compared to those without a history. Energy intake and the distributions of recruitment groups, gender, smoking habit, and alcohol drinking did not differ between the two groups.Figure 2. An alternating decision tree (ADTree) structure and prediction method. A case with the following
conditions (Condition 1 = True, Condition 2 = True, Condition 3 = True, Condition 4 = False, Condition 5 = True) will be associated with the multi-path with bold solid line. Its diagnosis prediction = sign (0.6 + 0.4– 0.3 + 1.2–1.6) = sign (+ 0.3). This positive sign (+ 0.3) means positive association with a setting outcome.
Associations between serum hs-CRP levels and the prevalence of type 2 diabetes.
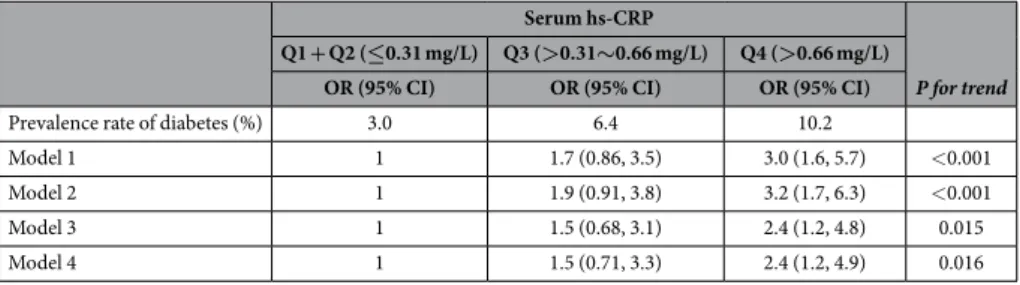
Table 2 pre-sents the associations between serum hs-CRP level and the prevalence of diabetes. Elevated serum hs-CRP level was proportionally associated with increased prevalence of diabetes after adjusting for probable covariates (P for trend was < 0.001 in model 2). After additionally adjusting for BMI (model 3), the association remained signifi-cant, although it was slightly attenuated (P for trend was 0.015). Further adjusting for family history of diabetes did not change the association observed in model 3 (P for trend was 0.016 in model 4).Figure 3. Result of the alternating decision tree (ADTree) for the prevalence of type 2 diabetes. The ADTree
indicates that having a positive or unknown family history of diabetes has positive impact and not having a family history has negative impact on the prevalence of type 2 diabetes. In addition, within the group of subjects without a family history of diabetes, elevated serum hs-CRP (≥ 0.26 mg/L) levels have positive impact on the prevalence of type 2 diabetes, while serum hs-CRP levels < 0.26 mg/L have negative impact. GGT, gamma-glutamyl transferase; hs-CRP, high-sensitivity C-reactive protein.
Family history of diabetes Negative Positive/Unknown P (n = 626) (n = 476) Genderc Men 319 (51.0) 237 (49.8) 0.701 Women 307 (49.0) 239 (50.2) Recruit groupc
Health Check-up Center 295 (47.1) 218 (45.8)
0.662 Participants by leaflet 331 (52.9) 258 (54.2) Age (years)a 52.0 ± 9.9 53.6 ± 9.5 0.009 BMI (kg/m2)b 22.8 (21.0, 25.2) 23.1 (21.0, 25.8) 0.078 Smoking statusc Current 94 (15.0) 83 (17.4) 0.521 Past 162 (25.9) 124 (26.1) Never 370 (59.1) 269 (56.5) Alcohol drinkingc Current 345 (55.1) 261 (54.8) 0.716 Past 8 (1.3) 9 (1.9) Never 273 (43.6) 206 (43.3)
Leisure-time exercise (MET-hours/week)b 7.65 (1.28, 23.10) 5.10 (1.28, 17.85) 0.046
Carbohydrate intake (g/day)b 234 (198, 278) 233 (195, 274) 0.712
Energy intake (kcal/day)b 1677 (1490, 1904) 1660 (1471, 1862) 0.274
Serum hs-CRP (mg/L)b 0.30 (0.15, 0.61) 0.32 (0.16, 0.70) 0.316
Fasting plasma glucose (mg/dL)b 92 (87, 99) 93 (88, 101) 0.022
Diabetes prevalencec 20 (3.2) 42 (8.8) < 0.001
Table 1. Clinical characteristics of the subjects according to their family history of diabetes. aMean ± SD, bMedian (25%, 75%), cNumber (%). BMI, body mass index; MET, metabolic equivalent; hs-CRP, high-sensitivity
Combined associations of family history of diabetes and serum hs-CRP level with the
preva-lence of diabetes.
As shown in Table 3, compared to the subjects in the reference group (not having a family history of diabetes and having lower hs-CRP level [≤ median]), subjects positive for or with an unknown family history of diabetes and lower hs-CRP level as well as those without a family history and with higher hs-CRP levels (> median) showed significantly high multivariable-adjusted odds ratios of 9.7 (2.6–63.0) and 6.2 (1.7–40.3), respectively, for the prevalence of diabetes (model 3). Having a positive or unknown family history and higher hs-CRP level resulted in a significantly high adjusted odds ratio of 12.5 (3.5–80.0) for the prevalence of diabetes; however, these impacts were not multiplicative, and the interaction effect between family history of diabetes and serum hs-CRP level on the prevalence of diabetes was significant (P for interaction was 0.039 in model 3).Associations between serum hs-CRP level and the prevalence of diabetes stratified by family
history of diabetes.
Stratified analyses revealed that elevated serum hs-CRP level was proportionally and significantly associated with an increased prevalence of type 2 diabetes in subjects without a family history of diabetes (P for trend was 0.020), but not in those positive for or with an unknown family history nor in those with a family history (Table 4).Discussion
The current study utilizing ADTree algorithm, a powerful classification algorithm for data mining (machine learning), and traditional statistical analyses (logistic regression analyses) revealed that elevated serum hs-CRP level, a systemic inflammation biomarker, was proportionally associated with an increased prevalence of type 2 diabetes after adjusting for traditional risk factors including BMI in the Japanese population. The impact of ele-vated serum hs-CRP level on the prevalence of type 2 diabetes was prominent in subjects without a family history of diabetes.
Serum hs-CRP
Family history of diabetes Negative Positive/Unknown OR (95% CI) OR (95% CI) Model 1 ≤ Median 1 10.1 (2.8–64.6) > Median 8.2 (2.3–51.8) 15.5 (4.5–97.4) *Pinteraction 0.023 Model 2 ≤ Median 1 9.8 (2.7–63.2) > Median 8.5 (2.4–54.1) 17.2 (5.0–108.5) *Pinteraction 0.035 Model 3 ≤ Median 1 9.7 (2.6–63.0) > Median 6.2 (1.7–40.3) 12.5 (3.5–80.0) *Pinteraction 0.039
Table 3. Combined associations of family history of diabetes and serum hs-CRP with the prevalence of type 2 diabetes. hs-CRP, high-sensitivity C-reactive protein; OR, odds ratio; CI, confidence interval. The
median value of hs-CRP was 0.31 mg/L. Model 1: adjusted for age and sex. Model 2: adjusted for age, sex, recruit group, smoking status, current alcohol drinking, leisure-time exercise, carbohydrate intake, and energy intake. Model 3: adjusted for the covariates in model 2 plus body mass index. *P values for interaction of family history of diabetes (no, yes) and serum hs-CRP (≤ median, > median).
The prevalence of type 2 diabetes has been rapidly increasing, which has become major worldwide public health and economic problems27,28. Therefore, it is essential to identify the risk and contributing factors of type
2 diabetes in order to develop preventative measures. Most lifestyle-related diseases, including type 2 diabetes, are multifactorial. Various genetic, lifestyle and environmental risk factors have been identified, including family history due to the similarity in heredity and lifestyles11. As presented in the resulting ADTree in the present study,
having a positive or unknown family history of diabetes, elevated serum gamma-glutamyl transferase, and suffer-ing from hypertension showed positive impact on the prevalence of type 2 diabetes; these findsuffer-ings are concordant with previous reports11,29,30. Systemic inflammation has also been identified as playing a role in the pathogenesis
of various diseases including type 2 diabetes12,13. CRP is produced by the liver in response to inflammation in
the body and is a sensitive systemic biomarker of inflammation31. Fibrinogen and hs-CRP are the inflammatory
markers most extensively studied for their relation to cardiovascular risk. As for the relation to diabetes, hs-CRP is most frequently studied, and hs-CRP measurement has recently become popular in clinical and health exami-nation settings for assessing low-grade systemic inflammation. Therefore, we used serum hs-CRP as a biomarker of systemic inflammation in the present study. Although a number of studies have reported independent relation-ships between some inflammatory markers, such as CRP and interleukin (IL)-6, and the risk of developing type 2 diabetes12,13,32,33, conclusions about their independent associations have not been consistent between studies.
Some studies, including a meta-analysis, have reported no associations after adjusting for adiposity such as BMI or waist circumference and have demonstrated that CRP may not be an independent risk factor for developing type 2 diabetes34,35.
The combined associations of family history of diabetes and systemic chronic inflammation with the prev-alence of type 2 diabetes, investigated by applying a powerful algorithm called ADTree6, have been scarcely
reported in the Japanese population. Therefore, the present study evaluated the associations of family history of diabetes and serum hs-CRP level with the prevalence of type 2 diabetes in the Japanese population using cross-sectional data. We observed that elevated serum hs-CRP level was significantly and proportionally asso-ciated with an increased prevalence of diabetes (P for trend was < 0.001) after adjusting for probable covariates (model 2). Additional adjustment for BMI (model 3) slightly attenuated this association, but it remained signif-icant. Chronic inflammation level is elevated in obese subjects; serum hs-CRP level was significantly correlated with BMI in our subjects, but this correlation was not so strong (gender-adjusted partial correlation coefficient = 0.256, P < 0.001) (data not shown). Therefore, we believe that the relationship between elevated serum hs-CRP level and increased prevalence of type 2 diabetes may be explained in part by increased BMI; however, other mechanisms likely contribute to this relationship. Combined analyses (Table 3) revealed that having a positive or unknown family history of diabetes was highly associated with increased prevalence of diabetes in each serum hs-CRP level (≤ median and > median) and elevated serum hs-CRP level (> median) was also associated with increased prevalence of diabetes in both subjects without a family history of diabetes and those having a positive or unknown family history. The cut-off value of 0.31 mg/L (median) was nearly equal to that (0.26 mg/L) indi-cated by ADTree (Fig. 3). Stratified analyses (Table 4) revealed that elevated serum hs-CRP level was proportion-ally and intensely associated with an increased prevalence of diabetes among subjects without a family history of diabetes. Although having a family history and elevated systemic inflammation are independently associated with the prevalence of diabetes each other, the impact of systemic inflammation on diabetes might be obvious in subjects without a family history of diabetes.
Serum hs-CRP
Family history of diabetes
Negative (n = 626) Positive/Unknown (n = 476) Positive only (n = 271)
OR (95% CI) OR (95% CI) OR (95% CI)
Model 1 Q1 + Q2 1 1 1 Q3 7.3 (1.8–48.9) 1.0 (0.40–2.4) 1.2 (0.33–4.1) Q4 10.2 (2.6–67.2) 2.0 (0.92–4.2) 1.5 (0.56–4.3) P for trend 0.002 0.086 0.401 Model 2 Q1 + Q2 1 1 1 Q3 7.5 (1.8–50.8) 1.1 (0.44–2.8) 1.1 (0.28–4.0) Q4 12.1 (3.0–80.6) 2.2 (0.99–4.8) 1.7 (0.55–5.1) P for trend < 0.001 0.056 0.372 Model 3 Q1 + Q2 1 1 1 Q3 6.0 (1.4–42.5) 0.84 (0.30–2.2) 0.85 (0.18–3.6) Q4 7.1 (1.6–50.0) 1.7 (0.70–4.0) 1.3 (0.36–5.0) P for trend 0.020 0.218 0.632
Table 4. Associations of serum hs-CRP with the prevalence of diabetes stratified by family history of diabetes. hs-CRP, high-sensitivity C-reactive protein; Q1, first quartile; Q2, second quartile; Q3, third quartile;
Q4, fourth quartile. OR, odds ratio; CI, confidence interval. Model 1: adjusted for age and sex. Model 2: adjusted for age, sex, recruit group, smoking status, current alcohol drinking, leisure-time exercise, carbohydrate intake, and energy intake. Model 3: adjusted for the covariates in model 2 plus body mass index.
populations. Despite these limitations, we consider our results to be meaningful for the prevention of type 2 dia-betes. Measuring hs-CRP level is now convenient and popular in health examination and may be useful for the identification of individuals in the Japanese population at high risk of type 2 diabetes, especially those without a family history of diabetes.
In conclusion, our study demonstrates that systemic inflammation as measured by serum hs-CRP was pro-portionally associated with an increased prevalence of type 2 diabetes after adjusting for BMI in the Japanese population, especially in subjects without a family history of diabetes. Further larger and prospective studies are necessary to confirm these associations and causality between serum hs-CRP level and type 2 diabetes.
References
1. Guariguata, L. et al. Global estimates of diabetes prevalence for 2013 and projections for 2035. Diabetes Res. Clin. Pract. 103, 137–149 (2014).
2. Luo, Z. C., Xiao, L. & Nuyt, A. M. Mechanisms of developmental programming of the metabolic syndrome and related disorders.
World J. Diabetes 15, 89–98 (2010).
3. Danaei, G., Finucane, M. M. & Lu, Y. National, regional, and global trends in fasting plasma glucose and diabetes prevalence since 1980: systematic analysis of health examination surveys and epidemiological studies with 370 country-years and 2.7 million participants. Lancet 378, 31–40 (2011).
4. Uemura, H. et al. Abundant daily non-sedentary activity is associated with reduced prevalence of metabolic syndrome and insulin resistance. J. Endocrinol. Invest. 36, 1069–1075 (2013).
5. Uemura, H., Katsuura-Kamano, S., Yamaguchi, M. & Arisawa, K. Relationships of elevated levels of serum hepatic enzymes and alcohol intake with arterial stiffness in men. Atherosclerosis 238, 83–88 (2015).
6. Freund, Y. & Mason, L. The alternating decision tree learning algorithm, In Proceedings of the 16th International Conference on
Machine Learning, San Francisco, CA. 124–133 (Morgan Kaufmann, 1999).
7. Bellazzi, R. & Zupan, B. Predictive data mining in clinical medicine: Current issues and guidelines. Int. J. Med. Inform. 77, 81–97 (2008).
8. Satomi, J., Ghaibeh, A. A., Moriguchi, H. & Nagahiro, S. Predictability of the future development of aggressive behavior of cranial dural arteriovenous fistulas based on decision tree analysis. J. Neurosurg. 123, 86–90 (2015).
9. Nakamura, Y. et al. On-admission pressure ulcer prediction using the nursing needs score. JMIR. Med. Inform. 3, e8 (2015). 10. Tan, P. N., Steinbach, M. & Kumar, V. Introduction to data mining (Person Education, 2006).
11. Adeghate, E., Schattner, P. & Dunn, E. An update on the etiology and epidemiology of diabetes mellitus. Ann. N. Y. Acad. Sci. 1084, 1–29 (2006).
12. Donath, M. Y. & Shoelson, S. E. Type 2 diabetes as an inflammatory disease. Nat. Rev. Immunol. 11, 98–107 (2011).
13. Wang, X. et al. Inflammatory markers and risk of type 2 diabetes: a systematic review and meta-analysis. Diabetes Care 36, 166–75 (2013).
14. Hamajima, N. J-MICC Study Group. The Japan Multi-Institutional Collaborative Cohort Study (J-MICC Study) to detect gene-environment interactions for cancer. Asian Pac. J. Cancer Prev. 8, 317–323 (2007).
15. Uemura, H. et al. Association between dietary calcium intake and arterial stiffness according to dietary vitamin D intake in men. Br.
J. Nutr. 112, 1333–1340 (2014).
16. Tokudome, S. et al. Development of a Data-based Short Food Frequency Questionnaire for Assessing Nutrient Intake by Middle-aged Japanese. Asian Pac. J. Cancer Prev. 5, 40–43 (2004).
17. Tokudome, Y. et al. Relative validity of a short food frequency questionnaire for assessing nutrient intake versus three-day weighed diet records in middle-aged Japanese. J. Epidemiol. 15, 135–145 (2005).
18. Goto, C. et al. Validation study of fatty acid consumption assessed with a short food frequency questionnaire against plasma concentration in middle-aged Japanese people. Scand. J. Nutr. 50, 77–82 (2006).
19. Imaeda, N. et al. Reproducibility of a short food frequency questionnaire for Japanese general population. J. Epidemiol. 17, 100–107 (2007).
20. Report of the Expert Committee on the Diagnosis and Classification of Diabetes Mellitus. Diabetes Care 20, 1183–1197 (1997). 21. He, H. & Garcia, E. A. Learning from imbalanced data. IEEE. Trans. Knowl. Data Eng. 21, 1263–1284 (2009).
22. Cieslak, D. A. & Chawla, N. V. Learning decision trees for unbalanced data. In Proceedings of the European Conference on Machine
Learning and Principles and Practice of Knowledge Discovery in Databases (ECML PKDD) Antwerp, Belgium. 241–256
(Springer-Verlag, 2008).
23. Setoguchi, Y. et al. Predictability of pressure ulcer from operation time, transfer activity and BMI using alternating decision tree.
J. Med. Invest. 63, 248–255 (2016).
24. Podgorelec, V., Kokol, P., Stiglic, B. & Rozman, I. Decision trees: an overview and their use in medicine. J. Med. Syst. 26, 445–463 (2002).
25. Guo, H. & Viktor, H. L. Learning from imbalanced data sets with boosting and data generation: The DataBoost-IM approach. Sigkdd
Explorations 6, 30–39 (2004).
26. Freund, Y. & Schapire, R. E. A decision theoretic generalization of on-line and an application to boosting. J. Comput. Syst. Sci. 55, 119–139 (1997).
27. Zimmet, P. Z., Magliano, D. J., Herman, W. H. & Shaw, J. E. Diabetes: a 21st century challenge. Lancet Diabetes Endocrinol. 2, 56–64 (2014).
28. Zhang, P. et al. Global healthcare expenditure on diabetes for 2010 and 2030. Diabetes Res. Clin. Pract. 87, 293–301 (2010). 29. Ford, E. S. et al. Liver enzymes and incident diabetes: findings from European Prospective Investigation into Cancer and Nutrition
(EPIC)-PotsdamStudy. Diabetes Care 31, 1138–1143 (2008).
30. Hypertension in Diabetes Study (HDS): I. Prevalence of hypertension in newly presenting type 2 diabetic patients and the association with risk factors for cardiovascular and diabetic complications. J. Hypertens. 11, 309–317 (1993).
31. Pepys, M. B. & Baltz, M. L. Acute phase proteins with special reference to C-reactive protein and related proteins (pentaxins) and serum amyloid A protein. Adv. Immunol. 34, 141–212 (1983).
32. Schmidt, M. I. et al. Markers of inflammation and prediction of diabetes mellitus in adults (Atherosclerosis Risk in Communities study): a cohort study. Lancet 353, 1649–1652 (1999).
33. Pradhan, A. D., Manson, J. E., Rifai, N., Buring, J. E. & Ridker, P. M. C-reactive protein, interleukin 6, and risk of developing type 2 diabetes mellitus. JAMA 286, 327–334 (2001).
34. Krakoff, J. et al. Inflammatory markers, adiponectin, and risk of type 2 diabetes in the Pima Indian. Diabetes Care 26, 1745–1751 (2003).
35. Lee, C. C. et al. Association of C-reactive protein with type 2 diabetes: prospective analysis and meta-analysis. Diabetologia 52, 1040–1047 (2009).
36. Xi, L. et al. C-reactive protein impairs hepatic insulin sensitivity and insulin signaling in rats: role of mitogen-activated protein kinases. Hepatology 53, 127–135 (2011).
37. Marnell, L., Mold, C. & Du Clos, T. W. C-reactive protein: ligands, receptors and role in inflammation. Clin. Immunol. 117, 104–111 (2005).
38. Hotamisligil, G. S. Inflammation and metabolic disorders. Nature 444, 860–867 (2006).
39. Senn, J. J., Klover, P. J., Nowak, I. A. & Mooney, R. A. Interleukin-6 induces cellular insulin resistance in hepatocytes. Diabetes 51, 3391–3399 (2002).
Acknowledgements
The authors thank the following researchers for providing us the useful food frequency questionnaire and a program to calculate nutrient intake; Shinkan Tokudome at National Institute of Health and Nutrition (formerly Nagoya City University), Chiho Goto at Nagoya Bunri University, Nahomi Imaeda at Shigakkan University, Yuko Tokudome at Nagoya University of Arts and Sciences, Masato Ikeda at University of Occupational and Environmental Health, Shinzo Maki at Aichi Prefectural Dietetic Association. This study was supported in part by Grants-in-Aid for Scientific Research on Priority Areas of Cancer (No. 17015018), on Innovative Areas (No. 221S0001), and Platform of Supporting Cohort Study and Biospecimen Analysis (JSPS KAKENHI Grant Number JP16H06277) from the Japanese Ministry of Education, Culture, Sports, Science and Technology, and by Grants-in-Aid for Scientific Research (C) (JSPS KAKENHI Grant Number JP15K08778) from the Japan Society for the Promotion of Science.
Author Contributions
H.U. collected data, designed research, analyzed data, and wrote the manuscript. A.A.G. analyzed data and wrote the manuscript. S.K.-K. collected data, analyzed data, and reviewed the manuscript. M.Y. collected data and reviewed the manuscript. T.B. reviewed the manuscript. M.I. reviewed the manuscript. H.M. contributed to discussion and reviewed the manuscript. K.A. collected data and reviewed the manuscript. All authors read and approved the final manuscript.
Additional Information
Competing Interests: The authors declare no competing financial interests.
How to cite this article: Uemura, H. et al. Systemic inflammation and family history in relation to the
prevalence of type 2 diabetes based on an alternating decision tree. Sci. Rep. 7, 45502; doi: 10.1038/srep45502 (2017).
Publisher's note: Springer Nature remains neutral with regard to jurisdictional claims in published maps and
institutional affiliations.
This work is licensed under a Creative Commons Attribution 4.0 International License. The images or other third party material in this article are included in the article’s Creative Commons license, unless indicated otherwise in the credit line; if the material is not included under the Creative Commons license, users will need to obtain permission from the license holder to reproduce the material. To view a copy of this license, visit http://creativecommons.org/licenses/by/4.0/