Design and
Dynamics
Copyright © 2013 by JSME
Junji YOSHIDA
∗∗and Daisuke YAMASHITA
∗∗ ∗∗Osaka Institute of Technology, Dept. of Mechanical Engineering5–16–1 Omiya, Asahi-ku, Osaka-shi, 535-8585 Japan E-mail: [email protected]
Abstract
In the present study, a target level setting method for the reference signal of opera-tional TPA was considered using the principal component regression method. A prin-cipal component having a high contribution to the response signal was selected and target levels of the reference signals were set through principal component sensitivity analysis. In addition, a method that can extract the behavior of a principal component having a high contribution to the response signal was considered for the countermea-sure. In order to verify the effectiveness of these methods, operational TPA and the proposed methods were applied to a small model vehicle. In the experiment, floor vibration was set as the response signal and nine measurement points, such as motor attachment points, were used as the reference signals. Here, we set the target reduction level of the response point vibration as 5 dB. Next, the target levels of the reference signal were calculated by principal component sensitive analysis and the countermea-sure was considered through the principal component behavior analysis. By referring to the analytical result, a countermeasure to reduce the floor vibration was sought. As a result, the floor vibration level was almost reduced to the target level (5 dB). These considerations and experiments indicate that operational TPA could have additional functionality, whereby the method could set reference signal targets and suggest coun-termeasure guidelines in addition to performing contribution separation.
Key words : Transfer Path Analysis, Principal Component Regression Method, Target
Setting, Principal Component Sensitivity Analysis, Principal Component Behavior Analysis, Modal Analysis, Automobile, Sensitivity Analysis
1. Introduction
Reducing vehicle interior sound levels and vibration is essential to achieving comfort-able cabin conditions. During this process, the increase in vehicle weight should also be minimized in order to make the sound and vibration performance compatible with the driving performance and fuel efficiency of the vehicle. The transfer path analysis (TPA) technique was developed as a method by which to determine the contributions of a range of different factors to sound and vibration levels and to effectively measure vehicle interior sound and vibrations. Each contribution is obtained by multiplying the individual input signals with the trans-fer function by the response signal, and several TPA methods have been proposed(1) – (14).
Operational TPA is a recently developed TPA method that enables the contributions to be obtained in a few man-hours because this method requires only sound pressure or vibration acceleration data during operation, and does not require an impulse hammering test in order to obtain transfer functions(2). A number of studies on operational TPA have examined
theoret-ical verification and application examples in vehicle development(3) – (10), as well as assessing
the accuracy and possible improvement methods for such techniques(12), (14).
This TPA method is a useful analytical tool for determining the main contributions to noise in a vehicle, and thus also for developing effective countermeasures to keep noise or
Target Level Setting Method for the Reference
Signal of Operational TPA*
*Received 23 June,2013 (No.T2-2012-JCR-0653) Japanese Original : Trans. Jpn. Soc. Mech.
Eng., Vol.79, No.801, C (2013), pp.1505-1515 (Received 26 Sep., 2012) [DOI: 10.1299/jsdd.7.317]
vibration below the target levels(5), (6). On the other hand, using the TPA results, it is difficult
to determine the degree to which we have to decrease each reference point vibration for the response point vibration to satisfy the target level, except in the case of one contribution being extremely dominant. If we can obtain a suitable target level for each reference point in order to meet the overall target response level, we can use the information that TPA provides to aid vehicle noise and vibration countermeasure development that also minimizes additional weight and cost. Moreover, we can set a target level in each system, such as the engine or suspension, to aid individual system development.
In the present study, we considered the target level setting method for the reference sig-nals used in operational TPA. In addition, we attempted to extract useful information from the operational TPA procedure in order to assist countermeasure design.
2. Target level setting method for reference signals
2.1. Procedure of operational TPA
In the operational TPA, the individual contributions are calculated by a two-step process. In the first step, the transfer function from the reference point to the response point is cal-culated using various operational data measured at the reference and response points. In the second step, each contribution is obtained by multiplying the reference point signal by the calculated transfer function(2), (12), (14). The transfer function in this method is calculated using
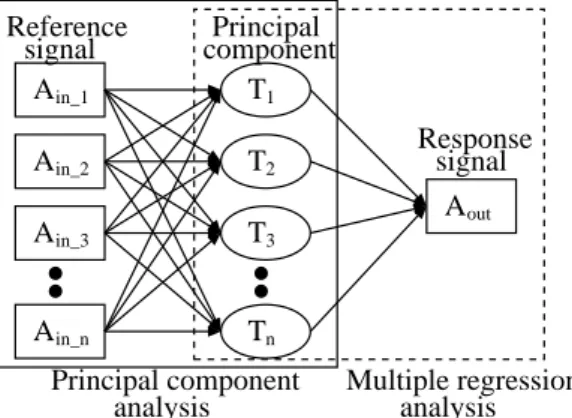
a principal component regression method. The calculation procedure is shown in Fig. 1.
Ain_2 Ain_3 Ain_n T1 T2 T3 Tn Ain_1 Aout Reference
signal componentPrincipal
Response signal
Principal component Multiple regression
analysis analysis
Fig. 1 Operational TPA model obtained using the principal component regression method.
First, a response signal and multiple reference signals are transposed to frequency-domain signals from time-domain signals by fast Fourier transform (FFT). The response signal ma-trix [Aout] can be expressed by the reference matrix [Ain] and the transfer matrix [H] for each
frequency, as follows: [ Aout ] =[ Ain ] [ H ] (1)
The (i, j)-th element in the reference matrix [Ain] is the data at the j-th reference point in the
i-th fast Fourier transform (FFT), and the (i, k)-th element in the response matrix [Aout] is the
data at the k-th response point in the i-th FFT. The ( j, k)-th element in the transfer matrix [H] is the transfer function from the j-th reference point to the k-th response point. Following singular value decomposition (SVD), the reference matrix [Ain] can be expressed as follows:
[ Ain
]
=[ U ] [ S ] [ V ]T (2)
The principal component (PC) matrix [T ] is then obtained using the results of SVD, this procedure is the same as principal component analysis (PCA):
[
T ]=[ Ain
] [
where [V] is the coefficient matrix for transposing the reference matrix [Ain] to the PC matrix
[T ], and the (i, m)-th element of [T] is the m-th PC in the i-th FFT. Next, multiple regression analysis (MRA) from the PC matrix [T ] to the response matrix [Aout] was performed, and the
regression coefficient matrix [B] was obtained as follows: [ Aout ] =[ T ] [ B ] (4) [ B ]=([ T ]T[ T ])−1[ T ]T[ Aout ] (5)
where [B] is the coefficient matrix used to transpose the PC matrix [T] to the response matrix [Aout], and the (m, k)-th element of [B] is the regression coefficient from the m-th PC to the
k-th response point. The transfer function [H] is obtained by multiplying k-the coefficient matrix [V] with the coefficient matrix [B], as follows:
[ H ]=[ V ] ([ T ]T[ T ])−1[ T ]T[ Aout ] (6) [ H ]=[ V ] [ S ]−1[ U ]T[ Aout ] (7)
The accuracy of the transfer function is increased by reducing the noise PC, which is generated by the measurement noise depending on the measurement condition. The amplitude or the significance probability of each PC is used to extract the noise PC(12).
The contribution to the response signal from each reference signal [Aout cont] can be
ob-tained by multiplying the measured reference signal [Ain] by the calculated transfer function
[H]: [ Aout cont ] =[ Ain cont ] [ H ] (8)
The (i, k)-th element in the contribution matrix [Aout cont] is the contribution at the k-th
re-sponse point in the i-th FFT. This procedure is used to obtain the contributions in operational TPA.
2.2. Target setting using the reference point signal
The contribution is obtained by multiplying the measured reference signal by the calcu-lated transfer function in the operational TPA.
Ain_2 Ain_3 Ain_n H1 Ain_1 Aout Reference
signal Transferfunction
Response signal H2 H3 Hn X Contribution Ain_1H1 Ain_2H2 Ain_3H3 Ain_nHn Σ X X X
Fig. 2 Contribution calculation of operational TPA.
Figure 2 shows that the response point signal at each frequency is calculated by a poly-nomial of reference point signals, as shown in Eq. (9).
ain 1h1+ ain 2h2+ ain 3h3+ · · +ain nhn= aout (9)
In the equation, ain 1 ∼ ain nand h1 ∼ hnare reference point signals (Ain 1 ∼ Ain n) and
transfer functions (H1 ∼ Hn) in each frequency, respectively. Moreover, aout is the response
The target level of each reference point can be obtained easily using this relationship according to the following two steps. The first step involves the reduction of the high-contribution reference point signal (ain1h1∼ ain nhn). The second step involves the calculation
of the response signal after reduction of the reference signal using Eq. (9). The target levels of the reference point are obtained by repeating the above procedure until the response level satisfies the target at each frequency. This is a very simple method of obtaining the target level of the reference signal. However, this method does not consider the relationship among refer-ence signals, regardless of the structure. However, depending on the structure, the referrefer-ence point signals have a certain correlation with each other in many cases because the vibration of each reference point is formed from the superposition of the vibration modes of the structure. Hence, the target level obtained through this method may be an unrealistic target. As such, we consider a target level setting method considering the relationship among the reference signals.
2.3. Target setting using the principal components
In the principal component regression analysis, the principal component is generated by applying singular value decomposition. Multiple regression analysis is performed between the principal component and the response signal to obtain the transfer function of opera-tional TPA. Principal components are obtained by extracting factors from correlated reference signals; the generated principal component is orthogonal to all other principle components. Moreover, several orthogonal vibration modes, which are excited during operation, are in-cluded in the measured reference signals. Hence, an orthogonal principal component is con-sidered to be the same as a vibration mode excited during operation(12), (14). The target setting
method using the principal component can obtain the target levels of reference signals consid-ering the relationship among reference signals. Calculation procedure for the target level by setting a focusing principal component is described below.
( 1 ) Calculating transfer functions through principal component regression. ( 2 ) Setting the target frequency range for reduction.
( 3 ) Calculating the principal component [T ] and transfer function of the principal com-ponent [HT] (relationship between the principal component and the response point signal), as
follows: [ T ]=[ Ain ] [ V ] (10) [ HT ] =([ T ]T[ T ])−1[ T ]T[ Aout ] (11)
where the transfer function of the principal component in Eq. (11) is identical to the coefficient matrix [B] in the calculation procedure of the transfer function from the reference point, as shown in Eq. (5).
( 4 ) Calculating the contribution of each principal component [Aout T cont] (principal
com-ponent sensitivity) to the response point signal by multiplying the transfer function of the principal component and each principal component, as follows:
[ Aout T cont ] =[ T ] [ HT ] (12)
This equation is the same as Eq. (8) except that the reference signal is replaced by the principal component.
( 5 ) Selecting a principal component having the maximum contribution to the response signal, and calculating the level of the response point signal after the principal component is reduced by a certain amount (e.g., 0.5 dB) using Eq. (12).
( 6 ) When the calculated response point signal does not reach the target, reduction Step 5 is repeated until the target response signal is achieved.
( 7 ) The principal component levels are saved as [Ttarget] (target level of principal
com-ponents) after the calculated response signal has achieved the target level.
( 8 ) Calculating the target level of each reference point [Ain target] from the target level
of the principal component [Ttarget] using the coefficient matrix [V] between the principal
component and the reference point, as follows: [ Ain target ] =[ Ttarget ] [ V ]−1 (13)
Through the above procedure, the reduction target level of each reference point can be obtained by considering the relationship among the reference signals (principal component sensitivity analysis). The efficiency of the proposed methods is verified in the following sec-tions through a vibration reduction test.
3. Verification of the target level setting method
3.1. Experimental apparatus
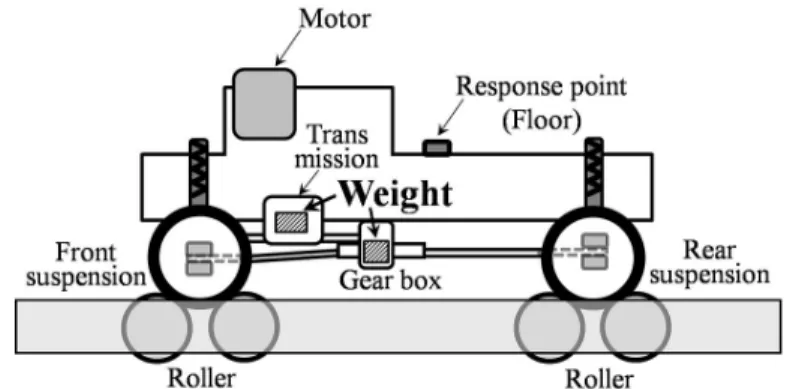
In order to verify the efficiency of the proposed target setting method using principal component sensitivity analysis, a contribution separation test was performed using a small model vehicle, as shown in Fig. 3.
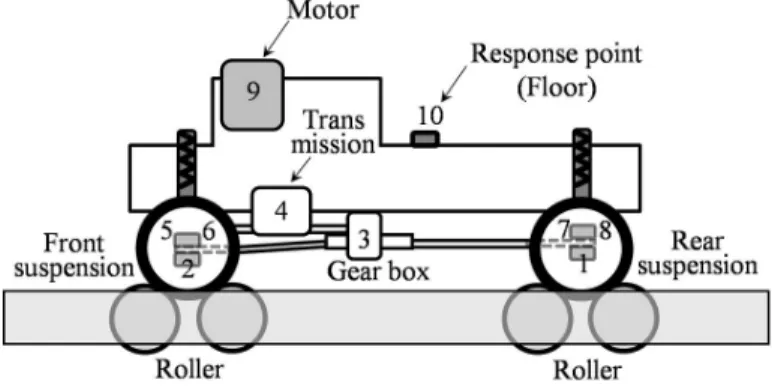
Fig. 3 Model car and vibration acceleration measurement points.
This small model vehicle, which has a three-speed automatic transmission with a mo-tor drive system, runs in four-wheel drive on rollers. In the experiment, floor vibration was set as the response point signal, and nine measurement points, such as the motor, automatic transmission, and suspension attachment points, were used as the reference signals, as shown in Fig. 3. Here, measurement points 2, 5, and 6 at the front suspension and 1, 7, and 8 at the rear suspension in Fig. 3 are the differential gear unit and the left and right suspensions, respectively, for each side. The transfer function from each reference point to the response point was calculated using measured vibration acceleration data at a moderate acceleration for 20 s in second gear, and the contribution of each reference point was calculated using the obtained transfer function and the measured acceleration of each reference point.
3.2. Target setting of the reference signal
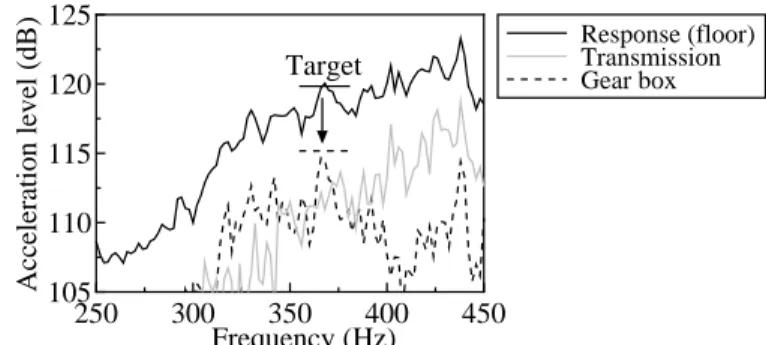
Figure 4 shows the average spectrum of the response point signal (floor vibration) in addition to the contributions calculated by operational TPA from the transmission and the gearbox, which had higher contributions than the other parts.
Based on the TPA results, the contribution from the gearbox is observed to be high at 300∼340 Hz and that from transmission is high at 380∼450 Hz. In the above frequency band,
250 300 350 400 450 105 110 115 120 125 Frequency (Hz) Acceleration level (dB) Response (floor) Transmission Gear box Target
Fig. 4 Vibration acceleration level at the floor and the contributions of the transmission and the gearbox.
the contributions from parts such as the gearbox or the transmission, are dominant. In this case, setting the target level of the reference point is easy, because the reduction target level of the reference point that has the highest contribution is the same as that of the reduction target level at the response point. However, setting the target level of reference points becomes di ffi-cult when the contributions are complicated, as observed at 340∼380 Hz in Fig. 4. In this case, we focused on the frequency range over which to apply the proposed target setting method and set 370 Hz, at which the response signal has a peak, as the reduction target frequency. We set the reduction target level at 170 Hz as 5 dB by referring to the acceleration level around this frequency. The target level of each reference point for achieving the response level reduc-tion target is calculated as follows using the principal component sensitive analysis. Figure 5 shows the principal component contribution calculated by Eq. (12).
250 300 350 400 450 105 110 115 120 125 Frequency (Hz) Acceleration level (dB) Response (floor) PC 1 PC 2 Target
Fig. 5 Contributions of the first and second principal components.
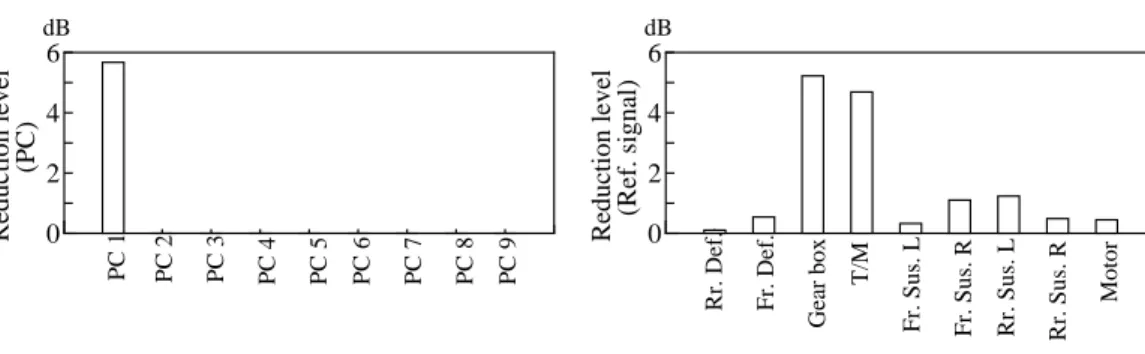
The results show that the contribution of first principal component is dominant at the response signal (floor vibration) at the target frequency (370 Hz). Next, the target reduction level of each principal component was calculated in order to satisfy the response level as the target. Here, we set the reduction step of the principal component that had the highest contri-bution as 0.5 dB and calculated the response level after the reduction. The above procedure was iterated until the response level achieved the target. As a result, the reduction level of each principal component (target level of the principal component to meet the response target at 370 Hz) was obtained as shown in Fig. 6(a). The results show that only the first principal component must be reduced.
Subsequently, the target level of each reference point was calculated according to the calculated target level of the principal component. Here, Eq. (13), which expresses the rela-tionship between each principal component and each reference point, was used to calculate the target reference point level. The difference between the original and target reference point levels (reduction target level) at 370 Hz is shown in Fig. 6(b).
As a result, both the vibrations of the gearbox and the transmission were found to be reduced by approximately 5 dB which met the target level of the response signal (floor vibra-tion). In the next section, a countermeasure designed to achieve the target levels is discussed.
0 2 4 6 Reduction level (PC) 0 2 4 6 Reduction level (Ref. signal) PC 1 PC 2 PC 3 PC 4 PC 5 PC 6 PC 7 PC 8 PC 9 Rr. Def. Fr. Def. Gear box T/M
Fr. Sus. L Fr. Sus. R Rr. Sus. L Rr. Sus. R
Motor
dB dB
(a) Reduction level of principal components (b) Reduction level of reference signals
Fig. 6 Reduction level of the principal component and the reference signal to achieve the target level of the response point.
4. Extraction of useful information for use in countermeasure design
In the present study, a target setting method for the reference point is considered using the principal component of operational TPA. Here, we attempted to extract information that is useful for the design of a countermeasure that achieves the target level obtained using the operational TPA procedure.
4.1. Principal component behavior analysis
An orthogonal principal component is generated from correlated reference signals. More-over, several orthogonal vibration modes, which are excited during operation, are included in the measured reference signals. Hence, an orthogonal principal component calculated by oper-ational TPA is considered to be the same as a vibration mode excited during operation(12), (14).
This means that the vibration mode can be expressed in terms of the behavior of the princi-pal component. In addition, we have already clarified which principrinci-pal component had a high contribution to the response signal. Therefore, the behavior of the high-contribution principal component becomes useful information with regard to the development of a countermeasure for the reduction of noise and vibration. The procedure for obtaining the behavior of the principal component is described as follows.
The principal component, which is obtained from the calculation procedure of the trans-fer function of the operational TPA using principal component regression, is expressed by reference signal [Ain] and transpose matrix [V], as shown in Eq. (14).
[
T ]=[ Ain
] [
V ] (14)
This equation could be expressed in each matrix element as follows: t11 t12 t13 t21 t22 t23 · · · · · · =
a11v11+ a12v21+ a13v31 a11v12+ a12v22+ a13v32 a11v13+ a12v23+ a13v33
a21v11+ a22v21+ a23v31 a21v12+ a22v22+ a23v32 a21v13+ a22v23+ a23v33
· · · · · · (15)
Here, timis the m-th principal component in the i-th fast Fourier transform (FFT) in the
princi-pal component matrix [T ], and ai jis the j-th reference point in the i-th fast Fourier transform
(FFT) in the reference signal matrix [Ain]. Also,vjm is the transpose coefficient from the j-th
reference point to the m-th principal component in the element of the transpose matrix [V]. The elements on the right-hand side of Eq. (15) denote the elements of each reference point transposed on the principal component coordinates. Then, the principal component
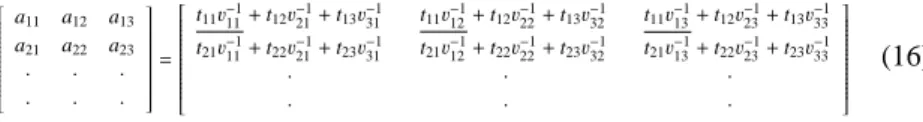
ele-ments included in each reference point signal can be obtained by re-transposing each element from principal component coordinates to reference signal coordinates, as shown in Eq. (16).
a11 a12 a13 a21 a22 a23 · · · · · · = t11v−111+ t12v−121+ t13v−131 t11v−112+ t12v−122+ t13v−132 t11v−113+ t12v−123+ t13v−133 t21v−111+ t22v−121+ t23v−131 t21v−112+ t22v−122+ t23v−132 t21v−113+ t22v−123+ t23v−133 · · · · · · (16)
Here,v−1m jis the transpose coefficient from the m-th principal component to the j-th reference point signal in the element of the inverse of the transpose matrix [V]. The right-hand side of Eq. (16) indicates the element of each principal component included in each reference point signal during operation. As an example, the underlined part in Eq. (16) denotes the element of the first principal component in each reference signal in the first FFT. These elements have complex values as well as amplitude and phase information. Hence, the behavior of each principal component can be obtained using the amplitude and phase at each reference point. This is the procedure of the principal component behavior analysis.
This analysis was adapted to the first principal component in the verification test, which had the highest contribution to the response signal (floor vibration) at 370 Hz. The behavior of the model vehicle is shown in Fig. 7.
Fig. 7 Actual vibration behavior of the first principal component at 370 Hz.
As shown in Fig. 7, both the gearbox and the transmission move synchronously along the vertical axis. Based on the analytical results, vertical vibrations at the gearbox and the transmission must be measured in order to reduce the floor vibration.
4.2. Countermeasure
We established a countermeasure based on the results of principal component behavior analysis and verified the target setting method proposed in the present study using principal component sensitivity analysis. In order to reduce the vibration of the floor vibration, the structure around the gearbox and the transmission must be modified in order to restrict the behavior along the vertical axis based on the principal component sensitivity and behavior analyses. Then, we added several weights around the transmission and gearbox attachment points in order to reduce the vibration, as shown in Fig. 8.
Fig. 8 Weight attachment points for reducing the acceleration level at reference points.
Here, we decided the amount of added weight necessary to meet the target reduction level of each reference point through a number of trials. The countermeasure was performed simul-taneously to all reference points according to the target level of each point and the principal component behavior. As a result, 300 g and 80 g weights were better to be attached around the transmission and the gearbox, respectively, to meet the target. The reduction level of each reference signal achieved by attaching these weights is shown in Fig. 9.
−2 0 2 4 6
Reduction level (Ref. signal)
Rr. Def. Fr. Def.
Gear box
T/M
Fr. Sus. L Fr. Sus. R Rr. Sus. L Rr. Sus. R
Motor
dB
Fig. 9 Actual reduction level at reference points as a result of the countermeasure.
As shown in the figure, the reference point signals were reduced almost to the target level (Fig. 6). Subsequently, we measured the floor vibration (response level) in order to verify the effectiveness of the reference point modification. The measured floor vibration level of the modified model vehicle is shown in Fig. 10.
250 300 350 400 450 105 110 115 120 125 Frequency (Hz) Acceleration level (dB) Base With weight Target
Fig. 10 Comparison of the vibration acceleration level of the response signal with and without weights.
As shown in Fig. 10, the modification was found to reduce the floor vibration to approxi-mately the same level as the reduction target (5 dB). Based on these analytical and experimen-tal results, the response signal could almost be reduced to the target level by setting the target level of the reference point using principal component sensitivity analysis and by obtaining
the high-contribution principal component behavior to the response signal.
5. Summary
In the present study, we focused on the operational TPA method, which was used to dis-tinguish between the noise and vibration contributions of the individual parts of a vehicle, and investigated a target level setting method for the reference signals. In addition, we attempted to extract useful information from the operational TPA procedure in order to design a coun-termeasure that reduces noise and vibrations inside the vehicle. As a result, we obtained the following:
( 1 ) Principal component sensitivity analysis was developed for setting the target level of the reference signal in order to achieve the target response. In the proposed method, the principal component that had a high contribution to the response level was extracted and the target reduction level of each reference signal was obtained according to the target reduction level of the principal component.
( 2 ) In order to obtain useful information for the reduction of the reference and response signals to the target level, we used principal component behavior analysis. In the proposed method, the behavior of the principal component that had a high contribution to the response signal was obtained, and the behavior was used for analyzing the modification point.
( 3 ) In order to verify these methods, we attempted to reduce the floor vibration of a small model vehicle. Then, the floor vibration was set as the response signal and the target reduction level of the point was set as 5 dB. The reduction of the reference point required in order to achieve the target was calculated using principal component sensitivity analysis and the countermeasure was designed based on the results of the principal component behavior analysis. As a result, we could almost reduce both the reference and response signals to their target levels.
Based on the above considerations, we were able to set the target level of the reference point for the operational TPA to meet the response target level and obtain the behavior of the high-contribution principal component, allowing us to design effective countermeasures. Moreover, the effectiveness of these methods was verified experimentally using a small model vehicle. The future direction of this work is to develop a method that can determine the degree to which part of a structure should be modified with respect to its stiffness or weight, in order to meet the target noise and vibration levels.
References
( 1 ) Van der Auweraer, H., Wyckaert, K., Hendricx, W., Van Der Linden, P., Noise and Vi-bration Transfer Path Analysis, Lecture series - van Karman Institute for fluid dynamics, van Karman Institute, Rhode-Saint-Genese, Belgium (1979).
( 2 ) Noumura, K., Yoshida, J., Method of Transfer Path Analysis for Vehicle Interior Sound with No Excitation Experiment, FISITA2006 Proceedings F2006D183 (2006) pp. 1-10. ( 3 ) Van der Auweraer, H., Mas, P., Dom, S., Vecchio, A., Janssens, K., and Van de Pon-seele, P., Transfer Path Analysis in the Critical Path of Vehicle Refinement: The Role of Fast, Hybrid and Operational Path Analysis, Proceedings SAE Noise and Vibration Conference, AE 2007-01-2352, (2007), pp.15-17.
( 4 ) Bermayer, W., Brandl, F., Hoeldrich, R., Sontacci, A., Brandl, S., Fliesser, W., Sound Engineering based on Source Contributions and Transfer Path Results, JSAE Paper 318/20075399 (2007) pp. 7-12.
( 5 ) Sakamoto, A., Ozaki, M., Application of a Transfer Path Analysis Using Principal Com-ponent Regression Method to Interior Sound at Acceleration, JSAE Paper 60/20085414 (2008) pp. 17-20 (In Japanese).
( 6 ) Lohrmann, M., Operational Transfer Path Analysis: Comparison with Conventional Methods, ICSV 15, (2008), pp.2671-2676.
( 7 ) Gajdasy, P., Janssens, K., Gielen, L., Mas, P., and Van Der Anweraer, H., Critical as-sessment of Operational Path Analysis: mathematical problems of transmissibility esti-mation, Acoustics 08 Paris, (2008), pp.5463-5468.
( 8 ) Brandl, S., Priebsch, H.-H., Brandl, F., Biermayer, W., H¨oldrich, R., Sontacchi, A., Challenges and New Solutions for Transfer Path Analysis, ISMA2008, (2008), pp.1-16. ( 9 ) Tcherniak, D., and Schuhmacher, A.P., Application of Transmissibility Matrix Method
to NVH Source Contribution Analysis, IMAC 2009 (2009), pp.1-10.
(10) Sonehara, T., A Study on Meaning of Acceleration-based Transfer Path Analysis, JSAE
Paper 100/20095547 (2009) pp. 19-24 (In Japanese).
(11) Kobayashi, S. and Yoshimura, T., Variance Estimation for the Identified Force Spectra Based on Matrix Inversion Method, Transaction of JSME Series C, Vol.77, No.776, (2011), pp.1342-1355.(In Japanese)
(12) Yoshida, J. and Noumura, K., Noise Reduction Method for Running TPA Using Sig-nificance Probability, Journal of System Design and Dynamics, Vol.5, No.8, (2011), pp.1572-1581.
(13) Shiraishi, Y., Wada, M., Ishizuka, M. and Ota, R., Development of transfer path analysis for road noise using parametric load model, JSAE Paper 22/20125258 (2012) pp. 7-10 (In Japanese).
(14) Yoshida, J., Onishi, Y. and Narita, Y., Consideration and Verification of Accuracy Eval-uation Indices for Operational TPA, Journal of System Design and Dynamics, Vol.6, No.5, (2012), pp.616-625.