1. Introduction
Tooth development is regulated by inductive interactions between the epithelium and the mesenchyme via reciprocal signalings1-3. Early signals
for tooth development arise in the oral ectoderm, appearing as thickening of the dental lamina. The dental lamina invaginates into the underlying neural crest-derived mesenchyme to form the tooth bud. The dental epithelial cells proliferate to form a double
Isolation and Characterization of
Mouse Specificity Protein 6 Promoter
Ivan Arie Wahyudi
Taigo Horiguchi
Keiko Miyoshi
Taro Muto
Trianna Wahyu Utami
Hiroko Hagita
Takafumi Noma
Department of Molecular Biology, Institute of Health Biosciences, The University of Tokushima Graduate School, Tokushima, Japan
E-mail:[email protected]
Received September 10, 2010, Accepted October 5, 2010
Abstract
Specificity protein 6 (SP6) is a member of the SP/Krüppel-like transcription factor family and plays key roles in tooth development. To study its biological roles, it is important to understand the spatiotemporal regulation of Sp6 gene expression. For this purpose, we first identified two separate 5' ends of the Sp6 cDNA by 5' RACE analysis using mouse mandibular RNA. Next, we isolated mouse genomic DNA fragments covering the Sp6 gene including two putative mouse Sp6 promoter regions and generated a series of luciferase reporter constructs. We confirmed the activity of both promoters by a luciferase assay and found strong second promoter activity in dental epithelial cells. Unexpectedly, we also detected potential third promoter activity in the intron 2 of the Sp6 gene. Last, we also found that bone morphogenetic protein and wingless signals could enhance Sp6 promoter activity in dental epithelial cells, suggesting the regulatory roles of two cytokines in Sp6 gene expression during tooth development. Our findings may shed new light on the regulatory mechanisms of Sp6 gene expression and provide a possible linkage between cytokine regulation of Sp6 expression and inductive epithelial and mesenchymal interactions.
Keywords: Gene expression; luciferase assay; promoter activity; Sp6
layer cap that is called the enamel organ. After the cap stage, the tooth germ progresses to the bell and late bell stages before the tooth erupts into the oral cavity. All these stages are regulated not only by cytokines, such as bone morphogenetic proteins (BMPs), sonic hedgehogs (Shhs), fibroblast growth factors (FGFs), and wingless (Wnts), but also by extracellular matrices. The deletion of these gene functions results in the arrest of tooth development 1-3. Although several signaling pathways have been
reported to regulate tooth development, their precise molecular basis remains to be determined.
Specificity protein 6 (SP6) is a member of the SP/ Krüppel-like transcription factor family. This family is composed of over 25 member proteins, which contains a DNA-binding domain with three tandem zinc fingers of the C2H2 type at their C-terminal region4, 5. Recent studies have revealed that SP6 plays
an important role in tooth development since Sp6 knockout mice showed abnormalities in teeth, hair, and limb bud formation6, 7. In our previous study, we
reported that overexpression of the Sp6 gene in ameloblast-lineage G5 cells results in the inhibition of follistatin gene expression, suggesting that the
follistatin gene may be one of the Sp6 target genes
in ameloblasts8. The structure of the Sp6 (epiprofin
used as a synonym) gene is shown to be comprised of two first exons and common exon 2, which contains the entire coding region of the Sp6 gene. Each first exon has been independently reported by two research groups, possibly due to the tissue- and developmental stage-specificities of the samples examined9, 10.
Although SP6 seems to play important roles in a spatiotemporal manner, the regulatory mechanisms of Sp6 transcription itself remain unclear. To address this question, we characterized the promoter region of the Sp6 gene and analyzed its activity. In addition, we examined the effects of BMP and Wnt signals on
Sp6 promoter activity because both cytokines are
heavily involved in tooth development1-3.
2. Materials and Methods
2.1 Animals
Six-week-old C57BL/6J mice were purchased from Japan SLC (Hamamatsu, Japan). At day 18.5 of pregnancy, the mice were sacrificed by cervical dislocation under anesthesia. Mandibles were harvested from the E18.5 embryos and stored at -80°C until RNA purification. The mice were maintained and treated in accordance with the guidelines for Animal Experiments of the University
of Tokushima. Experimental protocols were approved by the Ethics Committee for Animal Experiments of the University of Tokushima.
2.2 Reagents
Ham’s F-12 Medium (F12) and Dulbecco’s Modified Eagle Medium (DMEM) were purchased from Nissui Pharmaceutical (Tokyo, Japan). α-Minimum essential medium (αMEM) was purchased from GIBCO-BRL (Grand Island, NY, USA). Fetal bovine serum (FBS) was purchased from JRH Biosciences, Inc. (Lenexa, KS, USA). TRI reagent was purchased from MRC Inc. (Cincinnati, OH, USA). Reverse transcription (RT) was performed using the RNA PCR kit (AMV) ver.3.0 (Takara, Otsu, Japan). GoTaq DNA polymerase and PrimeSTAR GXL DNA Polymerase were purchased from Promega (Madison, WI, USA) and Takara, respectively.
2.3 Oligonucleotides for cloning of mouse
Sp6 promoter region
The following oligonucleotides were synthesized for polymerase chain reaction (PCR) to amplify DNA fragments from the mouse Sp6 promoter region: Xho1-F1 (5' -TCC ACG ATG GGT TTC AAC TCT AGT C-3' ); Xho1-F2 (5' -GCT TCT CAT TCA CTC GAG AAT GAG G-3' ); Sma-F1 (5' -AGC AGG GAC CTC ACA GAA TTT GCT C-3' ); Sma-F2 (5' -AGA GTG TAC CCG GGT TCT CCA GGT G-3' ); Xho1 reverse1 (Xho1-R1) (5' -TTG TTC AAA TCC CGA CTT GGA ACC C3' ); Xho1R2 (5' -CCT CAT TCT CGA GTG AAT GAG AAG C-3' ); E1b-R1 (5' -GTT CCG AAC ACC TTT CCC CAC CCA C-3' ); E1b-H-R2 (5' -ATA AGC TTG CGA CGG TGG AGG GCA GTG AGA G-3' ); E2-R1 (5' -CTG GTA TGT CTG GAG AGG TTG CAG G-3' ); and E2-H-R2 (5' -ATA AGC TTT GCC GGG ATC CGG GAT GGA ATG-3' ).
2.4 5' -Rapid amplification of cDNA ends
(5' RACE)
Total RNA from the E18.5 mandibles of C57BL/6J mice was extracted with TRI reagent following the
manufacturer’s protocol. First-strand cDNA was synthesized using the Transcriptor First Strand cDNA Synthesis kit (Roche, Mannheim, Germany) with a specific primer, Sp6 RACE0 primer (5' -TCA TAG CCC TGT GAG AAG TC-3' ), and 5' RACE PCR was carried out with the 5' RACE system (GIBCO-BRL). In brief, we added a dC-tail to the first strand cDNAs by terminal deoxynucleotidyl transferase. Next, PCR was performed using a bridged anchor primer (GIBCO-BRL) and Sp6 RACE1 primer (5' -GAG CCA CAG ACA GCG GTT AG-3' ). Then, nested PCR was performed using primer AUAP (GIBCO-BRL) and either Sp6 RACE2 (5' -GAC GGT CAA GGG TAC CTC AG-3' ) or
Sp6 RACE3 (5' -CGG TCC ATG GAG CCC AGA GCT
G-3'). For PCR, GoTaq polymerase (Promega) and GC buffer I or II (Takara) were combined in the PCR reaction. After amplification, the PCR products were cloned into the pGEM-T Easy Vector (Promega) and sequenced.
2.5 Isolation and sequencing of mouse
Sp6 genomic clones
The 5' flanking regions of the mouse Sp6 gene were isolated from the genome library of ICR Swiss mice by nested PCR using the GenomeWalkerTM kit
(Clontech Laboratories, Inc., Palo Alto, CA, USA) following the manufacturer ’s instructions. PCR products were cloned into the pGEM-T Easy Vector, and their identities were confirmed by cycle sequencing using the ABI PRISM Big Dye Terminator v3.1 cycle sequencing kit (Applied Biosystems, CA, USA) and an ABI PRISM 3100-Avant genetic analyzer (Applied Biosystems). The sequencing data obtained in this study have been submitted (accession number: AB574420).
2.6 Cell culture
G5 cells11 and HAT-7 cells12 are dental epithelial cells
derived from rat incisors. RDP4-1 cells are a rat clonal dental pulp cell line13, HeLa14, HepG215, and HEK293
cells16 are human cell lines derived from cervical
cancer, hepatoblastoma, and embryonic kidney,
respectively. Mv1Lu cells17 are a mink lung-derived
epithelial cell line. Three cell lines (HepG2, HEK293, and Mv1Lu) were obtained from the American Type Culture Collection (Manassas, VA, USA). G5 and HAT-7 cells were maintained in DMEM/F12 medium. HeLa, HepG2, and HEK293 cells were maintained in DMEM. RDP4-1 cells were maintained in αMEM. The cells were cultured in each media with 10% FBS at 37°C in humidified air containing 5% CO2. When the cells grew to 80% confluency, they were washed twice with phosphate-buffered saline without calcium and magnesium [PBS (-): 137 mM NaCl, 8.1 mM Na2HPO4•12H2O, 2.68 mM KCl, and 1.47 mM KH2PO4, pH 7.4] and used for the experiments.
2.7 Reporter constructs
A series of luciferase reporter constructs (LuC constructs) were generated by recloning the DNA fragment in the pGEM-T Easy Vector into the corresponding restriction enzyme sites of the pGL3 Basic vector (Promega). To analyze enhancer activity, pGL3 promoter reporter (Promega) was used. The minimum promoter region of SV40 within the pGL3 promoter plasmid was replaced with the minimum second promoter of the Sp6 gene (+5096 to +5460). DNA fragments from +4534 to +5308 were placed either at the 5' end of minimum promoter with the forward direction or at the 3' end of the luciferase gene with the reverse direction.
2.8 Transient transfection and luciferase
assay
For the transfection experiment, G5, HAT-7, RDP4-1, HeLa, HepG2, HEK293, and Mv1Lu cells were seeded at 1 × 10⁵ cells/well in 24-well plates. The cells were
then transfected with 200 ng/well of each LuC construct, pGL3 Basic plasmid, and 2 ng/well pRL-TK (Promega) as the controls using Lipofectamine and Plus reagent (Invitrogen, Carlsbad, CA, USA). The transfected cells were harvested with passive lysis buffer (Promega) 48 hr after transfection. Luciferase activities were measured with the dual-luciferase
2.10 Semi-quantitative RT-PCR
Total RNA was isolated from cultured cells with the TRI reagent. RNA was treated with DNase I (Invitrogen) to eliminate genomic DNA contamination. One microgram of total RNA was reverse transcribed to cDNA using the Takara RNA PCR kit (AMV) ver.3.0 (Takara) following the manufacturer’s instructions. The first strand of cDNA was then used as a template for PCR. PCR analysis was carried out using rat Sp6-specific primers as follows: 5' -primer, 5' -CCG GCA ATG CTA ACC GCT GTC TGT G-3' ; and 3' -primer, 5' -GGC TCA GTT GGA GGA CGC CGA GCT G-3' . PCR reactions were performed with 30 cycles of denaturing at 95°C for 30 sec, annealing at 59°C for 30 sec, and extensions at 72°C for 90 sec. Each assay was normalized by the level of GAPDH expression. The primer set for GAPDH was as follows: 5' -primer, 5' -CAT TGA CCT CAA CTA CAT GG-3' ; and 3' -primer, 5' -CTC AGT GTA GCC CAG GAT GC-3' . PCR products were electrophoresed in 1% agarose gels and visualized by ethidium bromide staining. The fluorescent signal of each PCR product was captured using ChemiDoc XRS (Bio-Rad, Tokyo Japan), and the expression level was quantified using Quantity One software (Bio-Rad).
3. Results
3.1 Determination of 5' end of Sp6
transcript
Two different 5' ends of mouse Sp6 transcripts have been reported independently by two research groups using either molar (E19.5) or testis RNA, and they were separately registered as epiprofin exon 19 and Sp6 exon 110. In order to study the regulatory
mechanisms of Sp6 gene expression, it was critical to determine the 5' -end of the gene. We first prepared total RNA from E18.5 mouse mandible and performed 5' RACE analysis with the Sp6 gene-specific primers that are complementary to sequences within exon 2 (Fig. 1A, open arrowheads). All PCR products were recloned into the pGEM-T Easy reporter assay system following the manufacturer’s
instructions. The activity of each Sp6 promoter was calculated by the ratio of firefly/renilla luciferase activities normalized with the value obtained from the pGL3 control group.
2.9 Cytokine responsiveness
G5 cells were passaged the day before experiment and maintained without serum. Then, the cells were treated with or without cytokines (Wnt1; 0, 0.3, 1, 3, and 10 nM, BMP2; 0, 300, and 500 ng/mL) for 24 hr. Total RNA from each sample was isolated with the TRI reagent. Reverse transcription-polymerase chain reaction (RT-PCR) analysis was carried out using primers specific for rat Sp6 as follows: 5' -primer, (5' CCG GCA ATG CTA ACC GCT GTC TGT G3' ); and 3' -primer, (5' -GGC TCA GTT GGA GGA CGC CGA GCT G-3' ).
pTOPflash and pFOPflash (Upstate, Lake Placid, NY, USA) were used for monitoring Wnt signaling activity. TOPflash reporter plasmid contains two sets (with the second set in the reverse orientation) of three copies of the TCF-binding site upstream of the
thymidine kinase (TK) minimal promoter and luciferase open reading frame. FOPflash contains
mutated TCF-binding sites as the negative control. The TCF binding site sequence of TOPfalsh and FOPflash are as follows: 5' -AAG ATC AAA GGG GGT AAG AKC AAA GGG GGT AAA ATC AAA GGG GGC CCC CTT TGA TCT TAC CCC CTT TGA TCT TAC CCC CTT TGA TCC TTA -3' and 5' - gcC AAA GGG GTA AAG gcc AAA GGG GGT AAg gcC AAA GGG GGC CCC CTT TGg cCT TAC CCC CTT TGg cCT TAC CCC CTT TGg cCT T -3' , respectively. K indicates G or T. TCF recognition sequences are underlined and the mutated portions of TCF recognition sequences are indicated as lowercase18.
The reporter plasmids were transfected into G5 cells and incubated for 24 hr in the presence or absence of Wnt1 and BMP2, and their reporter activities were analyzed.
Vector, and their sequences were entirely confirmed. We identified six distinct PCR products and found that one cDNA was derived from epiprofin exon 1, and the others (five out of six) were from Sp6 exon 1. Therefore, we named them exon 1a and exon 1b instead of epiprofin exon 1 and Sp6 exon 1, because each transcript contains the common exon 2, resulting in synthesis of the same SP6 protein. Interestingly, sequence analysis of our 5' RACE products revealed that the products containing exon 1b demonstrated multiple 5' ends (Fig. 1B, lower panel), although the 5' end of exon 1a started from the same position as the epiprofin exon 1 reported by Nakamura et al.9 (Fig. 1B, upper panel). To confirm
whether exon 1a has a variety of 5' ends, we performed an additional 5' RACE analysis using the
Sp6-specific primer that had a complementary
sequence to exon 1a (Fig. 1A, open arrowhead). We obtained the additional 5' RACE products that begin 33 bases upstream of the 5' end of exon 1a (Fig. 1B, upper panel). Therefore, we registered the position of the most 5' end of exon 1a as +1, and consequently, the 5' end of exon 1b is positioned at +5165. Hereafter, we designated the following: the promoter that regulates transcription from exon 1a is the first promoter, and that from exon 1b is the second promoter. The exon-intron organization of the Sp6 gene is summarized in Figure 1A.
3.2 Isolation and characterization of Sp6
promoter activity
To determine whether the 5' flanking region of the mouse Sp6 gene contains a functional promoter, DNA fragments that cover from 5 kb upstream of exon 1a to exon 2, were isolated by the GenomeWalker system, and serial luciferase reporter constructs were generated (Fig. 2A).
First, we analyzed the upstream region of exon 1a, which may contain tooth-specific regulatory elements according to a previous report9. However,
all constructs showed weak luciferase activity in G5 cells (Fig. 2A, middle panel). Two constructs, -4688/ +75LuC and -3497/+75LuC showed 2.7- and 1.5-fold
increased activities, respectively, compared to the basal luciferase activity of the promoter-less pGL3-Basic plasmid, indicating weak first promoter activity in G5 cells. Similarly, only weak promoter activities (less than a 2-fold increase using the same two constructs) were observed in another dental epithelial cell line, HAT-7 cells (data not shown).
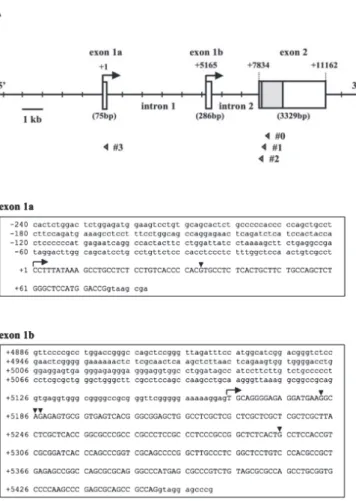
Figure 1. Gene structure and nucleotide sequence of mouse Sp6 gene. (A) Gene structure and exon/
intron organization of the Sp6 gene. The 5' end of exon 1a is indicated as +1. Arrows indicate the transcription start sites from exon 1a and exon 1b. Open arrowheads indicate the positions of gene specific primers, and the symbols #0 to #3 indicate
Sp6 RACE0 to 3 primers, respectively. (B) The
nucleotide sequences of exon 1a (75 bp) and exon 1b (286 bp) are shown. The sequences of exon 1a and exon 1b are indicated by uppercase letters. Black arrowheads indicate the 5' ends of RACE products.
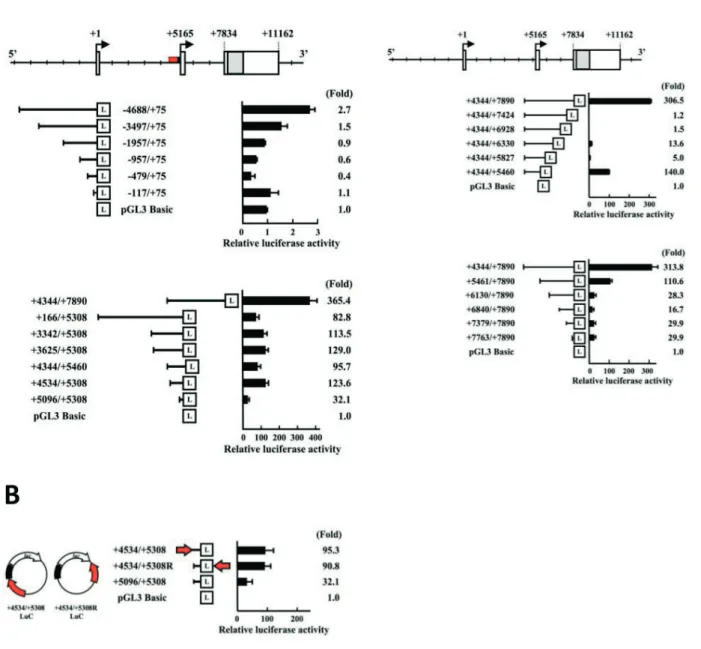
Figure 2. Functional characterization of Sp6 promoter activity. (A) Upper panel: Gene structure and exon/
intron organization of the Sp6 gene. Middle panel: Analysis of first promoter activity using a set of deletion constructs. Lower panel: Analysis of second promoter activity using a series of deletion constructs. (B) Identification of potential enhancer activity upstream exon 1b. Black and red bars indicate the minimum second promoter (upstream exon 1b) and the potential enhancer regions, respectively. The arrow indicates the 5' to 3' direction. (C) Analysis of promoter activity of intron 1. Upper panel: Gene structure and exon/ intron organization of the Sp6 gene. Middle panel: Analysis of the second promoter activities using a set of 3' deletion constructs. Lower panel: Analysis of potential third promoter activities using a set of 5' deletion constructs. Relative promoter activities compared to pGL3 Basic promoter (set to 1) are shown as the mean values of triplicate samples. “L” in boxes indicates the luciferase coding region.
Next, we examined the upstream region of exon 1b. We generated six promoter constructs such as +166/ +5308LuC, +3342/+5308LuC, +3625/+5308LuC, +4344/+5460LuC, +4534/+5308LuC, and +5096/ +5308LuC, in addition to one construct that contains intron 1, +4344/+7890LuC (Fig. 2A, lower panel). In contrast to the upstream region of exon 1a, all constructs showed much higher promoter activities: 82.8-, 113.6-, 129.0-, 95.7-, 123.6-, 32.1-fold, respectively. These results demonstrate that the second promoter region has significantly stronger promoter activity in dental epithelial G5 cells. Comparison of the activities between the shortest construct (+5096/+5308LuC) and other second promoter constructs showed more than 2.5-fold difference, suggesting that there is a transcription-enhancing domain within the region +4534 to +5095. To confirm the enhancer activity, we generated new constructs that contain the Sp6 minimal promoter (+5096 to +5308) combined with the potential enhancing region, +4534 to +5095, in a different direction and position in the reporter plasmid (Fig. 2B). The luciferase analysis showed that both constructs had 3-fold higher activity compared to the construct +5096/+5308, indicating that the region +4534 to +5095 has enhancer activity (Fig. 2B).
The construct +4344/+7890LuC that contains the region +4344 to +5308 is connected with whole intron 2. The construct showed the highest transcriptional activity, 365.4-fold higher luciferase activity than that of pGL3 Basic. To further analyze the regulatory domain, we created several deletion constructs as shown in Figure 2C. Luciferase analysis demonstrated that promoter activity decreased dramatically (306.5-fold to 1.2-(306.5-fold) to the background level when we deleted the region from +7425 to +7890. The deletion from +7424 to +5828 had no gross effects. Further deletion up to +5461 restored the promoter activity to about half of the construct +4344/+7890LuC (Fig. 2C, middle panel). Taken together, these results suggest that the region from +5461 to +5827 has a negative regulatory domain and that the region from +7425 to +7890 has a positive regulatory domain.
3.3 Identification of potential third
promoter activity
To further analyze the regulatory domain in the region from +4344 to +7890, we made five deletion constructs (+5461/+7890LuC, +6130/+7890LuC, +6840/+7890LuC, +7379/+7890LuC, and +7763/ +7890LuC) that do not contain the second promoter region (Fig. 2C, lower panel). We found strong promoter activity in the construct +5461/+7890LuC (110.6-fold), about one-third of the highest promoter activity of the construct +4344/+7890LuC (313.8-fold). Because the construct +5461/+7890LuC did not contain the second promoter region, the result demonstrated that intron 2 contains the promoter activity. Further deletions from +5461 to +6129 decreased the promoter activity (~20-fold), suggesting that the region +7763 to +7890 could be the minimum third promoter (Fig. 2C, lower panel). This activity is higher than the first promoter activity (Fig. 2A) and comparable to the minimum second promoter activity (Fig. 2B). Furthermore, the construct +5461/+7890LuC had higher activity (~4-fold) compared to four other constructs (+6130/ +7890LuC, +6840/+7890LuC, +7379/+7890LuC, and+7763/+7890LuC),indicating that both regions from +4344 to +5308 and from +5461 to +6129 may contain the positive regulatory domains.
3.4 Cell type-specificity of the Sp6
promoter activity
Sp6 mRNA was highly detected in the dental
epithelium, limb bud, whole embryo, and adult testis6, 7, 9, 10. The previous findings indicated that Sp6
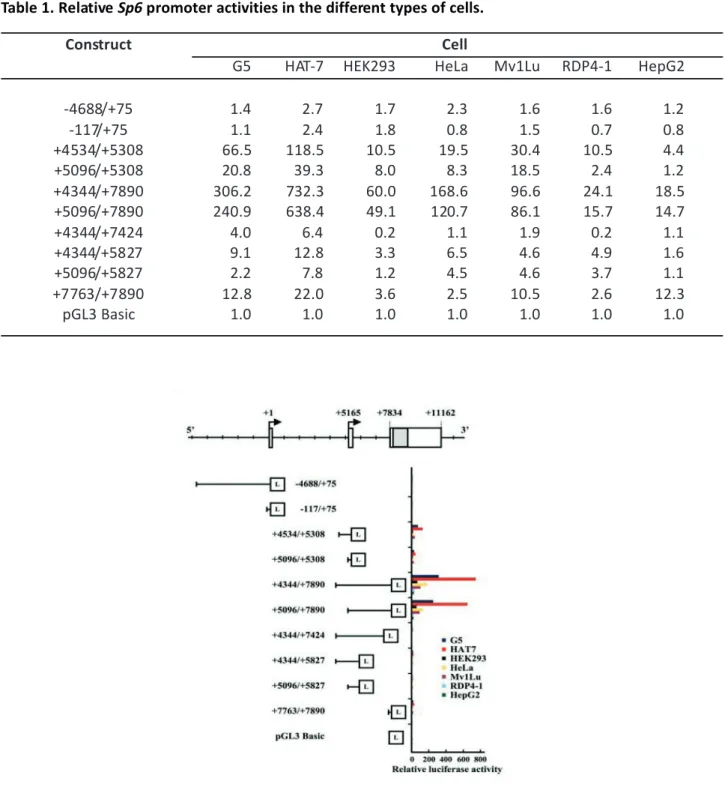
gene expression is spatiotemporally regulated. To address the molecular mechanisms of transcriptional regulation, we analyzed the cell type-specific Sp6 promoter activity. We chose ten luciferase constructs and seven cell lines, and the results of the luciferase assay are summarized in Figure 3 and Table 1.
Table 1. Relative Sp6 promoter activities in the different types of cells.
Construct Cell
G5 HAT-7 HEK293 HeLa Mv1Lu RDP4-1 HepG2
-4688/+75 1.4 2.7 1.7 2.3 1.6 1.6 1.2 -117/+75 1.1 2.4 1.8 0.8 1.5 0.7 0.8 +4534/+5308 66.5 118.5 10.5 19.5 30.4 10.5 4.4 +5096/+5308 20.8 39.3 8.0 8.3 18.5 2.4 1.2 +4344/+7890 306.2 732.3 60.0 168.6 96.6 24.1 18.5 +5096/+7890 240.9 638.4 49.1 120.7 86.1 15.7 14.7 +4344/+7424 4.0 6.4 0.2 1.1 1.9 0.2 1.1 +4344/+5827 9.1 12.8 3.3 6.5 4.6 4.9 1.6 +5096/+5827 2.2 7.8 1.2 4.5 4.6 3.7 1.1 +7763/+7890 12.8 22.0 3.6 2.5 10.5 2.6 12.3 pGL3 Basic 1.0 1.0 1.0 1.0 1.0 1.0 1.0
Figure 3. Analysis of cell type-specific Sp6 promoter activity. Ten luciferase constructs were chosen for
observation of promoter activities using seven different cell lines. The luciferase assay was performed 48 hr after transfection. Relative activities compared to pGL3 Basic promoter activity (set to 1) are also shown in Table 1. “L” in boxes indicates luciferase coding region.
The first promoter activities produced by the constructs -4688/+75 and -117/+75LuC were weak in all seven cell lines as with the similar level of the promoterless pGL3 vector. In contrast, the activity of the second promoter combined with intron 1 (+4344/+7890LuC) showed significantly high activity in dental epithelial cell lines (G5 cells, 306.2-fold; HAT-7 cells, HAT-732.3-fold) in seven cell lines. Compared to the construct +4344/+7890Luc, the second promoter activities of the construct +4534/+5308Luc were 21% in G5 cells and 16% in HAT-7 cells, and those of the construct +5096/+5308LuC were 7% in G5 cells and 5% in HAT-7 cells. Stronger luciferase activities were also observed in the epithelial-derived cells, HEK293 (60.0-fold), HeLa (168.6-fold), and Mv1Lu (96.6-fold) cells. Weak but distinct activities were also detected in non-epithelial derived cells, RDP4-1 (24.1-fold) and HepG2 (18.5-fold) cells. The remaining second promoter constructs containing intron 2, +5096/ +5827LuC, +4344/+5827LuC, and +4344/+7424LuC, produced residual and limited activities in all cell types. The potential third promoter activities were examined with the construct +7763/+7890LuC. G5, HAT-7, Mv1Lu, and HepG2 cells showed more than10-fold activities.
Taken together, these results clearly indicated that second and potential third promoter regions have unique promoter activities depending on the cell types. Also, these cell-type specificities are consistent with previous reports that demonstrate tissue-specific Sp6 expression6, 7, 9, 10, reflecting
tissue-specific promoter regulation.
3.5 Cytokine responsiveness of Sp6
promoter activity
Several cytokines, such as BMPs, Wnts, FGFs, and Shhs, are thought to regulate tooth development1-3.
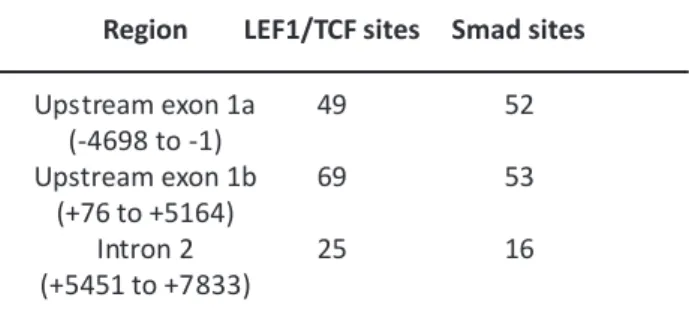
However, there is still a missing link between the Sp6 expression and the regulatory mechanisms of these cytokines. Our sequence analysis of Sp6 promoter regions revealed several potential response elements for both BMP and Wnt signaling (Table 2). Therefore, to understand the role of cytokines in Sp6 regulation,
we analyzed the effects of BMPs and Wnt on Sp6 expression. First, we examined the changes in mRNA level by RT-PCR analysis (Fig. 4A). G5 cells treated with 0.3 nM Wnt1 showed a 2.5-fold upregulation of the Sp6 mRNA level as the maximum response. When G5 cells were treated with 500 ng/mL BMP2, the level of Sp6 mRNA was increased 6-fold. These results suggested that the Sp6 mRNA expression is up-regulated through both Wnt and BMP signaling. To prove the functional activity of Wnt1 signaling, we separately monitored TCF reporter activity using TOPflash and FOPflash reporter plasmids. As shown in Figure 4B, in the presence of 0.3 nM Wnt1, luciferase activity with TOPflash was increased about 3-fold in G5 cells. We also found reporter activity with TOPflash in the absence of Wnt1, indicating that G5 cells have endogenous LEF1/TCF activity.
Table 2. The numbers of the potential cis-elements for LEF/TCF and Smad.
To further examine whether both cytokines are involved in the regulation of Sp6 promoter activity, we performed the luciferase assay using the following four constructs: -4688/+75LuC, +166/+5308LuC, +4344/+7890LuC,and +5461/+7890LuC, using pGL3 Basic as a control. Constructs -4688/+75LuC and +166/+5308LuC did not show any response to BMP2 treatment (Fig. 4C, middle panel). However, constructs +4344/+7890LuC and +5461/+7890LuC showed 1.3-fold and 1.6-fold enhancement of luciferase activity by BMP2. It was also observed that both constructs responded to BMP2 in a dose-dependent manner (data not shown). On the other hand, Wnt1 treatment enhanced the promoter activities 1.3- to 1.8-fold in three constructs, except for the first promoter (Fig. 4C, lower panel).
Region LEF1/TCF sites Smad sites
Upstream exon 1a 49 52 (-4698 to -1) Upstream exon 1b 69 53 (+76 to +5164) Intron 2 25 16 (+5451 to +7833)
Figure 4. Regulation of Sp6 expression by cytokines, Wnt1 and BMP2. (A) Upper panel: The positions of the
primers to detect Sp6 mRNA are shown with arrowheads. Middle panel: Dose-dependent effects of cytokines on Sp6 mRNA expression were examined by RT-PCR analysis. Lower panel: Relative Sp6 mRNA levels in response to cytokine treatment. For quantification of relative RNA levels, GAPDH was used as control to normalize the starting quantity. (B) Wnt responsiveness in G5 cells. To monitor Wnt signaling activity in G5 cells, TOPflash and FOPflash reporter plasmids were used as the positive and negative controls, respectively. (C) Upper panel: Gene structure and exon/intron organization of the Sp6 gene. Middle panel: Effects of BMP2 on the Sp6 promoter activities. Lower panel: Effects of Wnt1 on Sp6 promoter activities. Black and white bars indicate the presence and absence of cytokines, respectively. “L” in boxes indicates a luciferase coding region.
4. Discussion
Previous studies have shown that the Sp6 gene is expressed in a time- and tissue- specific manner during the development of teeth, hair, and limb buds, but little information is available about the regulatory mechanism of Sp6 gene expression5-9. To understand
the precise biological roles of SP6 in tooth development, it is necessary to clarify the spatiotemporal regulation of Sp6 gene expression. For that purpose, we confirmed the 5' ends of Sp6 gene, and isolated and characterized the 18-kb DNA region that covers the 5-kb upstream region of exon 1a to exon 2. Then, we examined the promoter activities using the luciferase reporter assay. Since BMP2 and Wnt1 are well-known key players associated with the reciprocal epithelial and mesenchymal interaction during tooth development1-3, we also examined the effects of
these cytokines on Sp6 promoter activity to determine whether both cytokines are involved in the regulation of Sp6 gene expression. We have summarized our findings in Figure 5.
4.1 Alternative promoter usage of Sp6
gene
Previous reports on Sp6 gene structure suggested that the Sp6 gene is transcribed by means of an alternative promoter selecting either dental-specific
epiprofin exon 1 (exon 1a) or adult non-dental
tissue-specific Sp6 exon1 (exon 1b)6, 7. However, our 5' RACE
analysis revealed that both exon 1a and exon 1b could be transcribed in mouse mandibles with some variation of the 5' ends (Fig. 1B). We also found that both transcripts are present in the teeth using postnatal day6 rat molar RNA (data not shown). This is the first report to demonstrate the alternative promoter usage of Sp6 gene in dental tissue. In addition, we found that exon 1a begins 33 bases upstream of epiprofin exon 1 and that all 5' ends of our 5' RACE products for exon 1b were located at downstream sites compared to previous reports 6, 7
(Fig. 1B). The results indicate that the Sp6 gene is one of the TATA-less genes with tissue- and time-specific regulation.
4.2 Sp6 promoter activity
Sp6 promoter activities were examined using the luciferase reporter constructs containing potential Sp6 promoter regions. Unexpectedly, all potential
first promoter constructs had little luciferase activity in all cell types that we examined, including two types of dental epithelial cells (Fig. 3), although exon 1a was reported as a tooth-specific first exon9. There
may be several reasons why we could not detect the high first promoter activity. The first possible reason is the host cells that we used. Both dental epithelial-derived G5 and HAT-7 cells might not be appropriate to detect the first promoter activity, possibly due to that the epigenetic status of Sp6 gene locus might not allow to activate the first promoter. The second possible reason is that our luciferase constructs might lose the critical activator or enhancer regions required to drive the actual or major first promoter activity, because an enhancer region of several tissue-specific genes is located far from the minimum promoter region19. The third possible reason is that
critical transcription factors might be missing in
F igure 5. Regulatory domains of mouse Sp6 promoter. Colored boxes above and below the
central scale line indicate the regulatory domains for the second promoter and the potential third promoter, respectively. The boxes above the central line indicate the minimum promoter region (black), two positive regulatory domains (red and blue), and one negative regulatory domain (yellow) for the second promoter, respectively. Green and purple boxes below the central line indicate the positive regulatory domain and the minimum promoter region for the potential third promoter, respectively.
dental-derived G5 and HAT-7 cells different from the
in vivo context. With regard to this point, Ctip2/
Bcl11b has recently been reported to be the direct regulator of the Sp6 promoter, which it accomplishes by binding to the Sp6 proximal promoter region (-178 to -87) in the first promoter20. Therefore, it would
be interesting to determine whether Ctip2/Bcl11b is functionally present in G5 and HAT-7 cells to drive
Sp6 promoter activity. The fourth possible reason is
the loss of tissue-specific cues derived from 3-dimensional cultures but not 2-3-dimensional regular cultures, possibly due to the factors involved in cell-to-cell communication. Regardless, open questions still exist with respect to the weak first promoter activity in dental epithelial cells.
For the second promoter, we found the minimum promoter region (+5096/+5308), two positive regulatory regions (+4534 to +5095 and +7425 to +7890), and one negative regulatory region (+5461 to +5827) (Fig. 2). The minimum promoter activity was detected with the construct +5096/+5308LuC. The region +4534 to +5095 has enhancer activity, although inspection of the sequences in this region did not identify any typical enhancer elements derived from SV40 promoter21, suggesting the
presence of a novel or unusual enhancer element. The strongest luciferase activity was detected using the construct +4344/+7890LuC (365.4-fold), which had more than 3-fold higher activity than that of the other second promoter with an enhancer region (+4534 to +5095). These results suggest that intron 2 may contain another strong enhancer and/or activator elements.
Further analysis with serial deletion constructs revealed that promoter activities were also detected, even in the intron 2 region. As shown in Figure 2C, the construct +5461/+7890LuC still had one-third the activity of the construct +4344/+7890LuC, whose construct did not contain the second promoter region. This finding suggested that intron 2 contains the potential third promoter. In addition, we detected promoter activity in the construct +7763/+7890LuC at a level similar to other constructs +6130/ +7890LuC, +6840/+7890LuC, and +7379/+7890LuC
(about 30-fold), suggesting that the region +7763 to +7890 is the minimum promoter context, and the region +5461 to +6129 contains positive regulatory element(s). To confirm potential third promoter activity, we tried to isolate the 5' RACE products, but we have not yet succeeded thus far. Identification of the transcription start sites remains to be determined to confirm the actual third promoter. In addition, we found that the region +5461 to +6129 showed strong positive regulatory effect on the potential third promoter (Fig. 2C, lower panel), although the region +5461 to +5827 showed a strong negative regulatory effect on second promoter activity (Fig. 2C, middle panel). The finding indicated that the same DNA region may play a role in the promoter-selective regulation.
4.3 Cytokine responsiveness and its
possible roles in tooth development
Growth factors and cytokines, such as BMPs, Wnts, Shhs, FGFs, and TNFs, are involved in the process of tooth development and morphogenesis, and they are regarded as key players in the reciprocal epithelial and mesenchymal interaction1-3, 22. Sequence analysis
of the Sp6 promoter region identified many consensus elements for LEF1/TCF and Smad-binding sites in the region from +4344 to +7890 as shown in Table 2. This finding prompted us to examine the responsiveness of Sp6 transcription to both BMP2 and Wnt1. We found that BMP2 and Wnt1 could up-regulate the steady state of the Sp6 mRNA levels. Further luciferase analysis in the presence of each cytokine clearly demonstrated that Sp6 promoter activities were up-regulated in dental epithelial-derived G5 cells. As shown in F igure 4, Wnt1 responsiveness was observed in both the second and the potential third promoter constructs, while BMP2 responsiveness was only detected in the potential third promoter containing constructs, indicating promoter selectivity in the cytokine response. On the other hand, we could find neither significant first promoter activity in G5 and HAT-7 cells nor enhancement by both cytokines, BMP and Wnt, in
G5 cells, even though there are multiple potential response elements. Again, we observed the inactivity of the first promoter in dental epithelial G5 cells.
In conclusion, our findings demonstrate the s tructure of the Sp6 gene and the potential regulatory regions of promoter activity in a cell type-specific manner. We also demonstrated functional coupling between cytokine signaling and Sp6 transcription. Further investigation is necessary to understand the precise molecular mechanisms for the spatiotemporal regulation of Sp6 transcription during the inductive epithelial and mesenchymal interaction, including the identification of transcription start sites and the specific protein interaction with the Sp6 promoter region that regulates its activity.
5. Acknowledgment
This work was partly supported by Grants-in-Aid for scientific research (Nos. 21791789, 17689051, and 20890151) from the Ministry of Education, Culture, Sports, Science and Technology, Japan, and Research Grant from KAO Health Science Research.
6. References
1. Mass R and Bei M. 1997. The genetic control of early tooth development. Crit. Rev. Oral Biol.
Med. 8 (1) :4-39.
2. Jernvall J and Thesleff I. 2000. Reiterative signaling and patterning during mammalian tooth morphogenesis, Mech. Dev. 92 (1):19-29. 3. Thesleff I. 2003. Epithelial-mesenchymal
signaling regulating tooth morphogenesis, J. Cell
Sci. 116, Pt. 9: 1647-8.
4. Suske G, Bruford E, Philipsen S. 2005. Mammalian SP/KLF transcription factors: bring in the family.
Genomics 85 (5): 551-6.
5. Jimenez-Rojo L, Ibarretxe G, Aurrekoetxea M, de-Vega S, Nakamura T, Yamada Y, Unda F. 2010. Epiprofin/ Sp6: A new player in the regulation of tooth development. Histol. Histopathol., 25, in press.
6. Nakamura T, de-Vega S, Fukumoto S, Jimenez L, Unda F, Yamada Y. 2008. Transcriptional factor epiprofin is essential for tooth morphogenesis by regulating cell fate and tooth number. J. Biol.
Chem. 283(8): 4825-33.
7. Hertveldt V, Louryan S, van Reeth T, Dreze T, van Vooren P, Szpirer J, Szpirer C. 2008. The development of several organs and appendages is impaired in mice lacking Sp6 Dev. Dyn. 237 (4): 883-92.
8. Ruspita I, Miyoshi K, Muto T, Abe K, Horiguchi T, Noma T. 2008. Sp6 downregulation of follistatin gene expression in ameloblasts. J. Med. Invest. 55 (1-2):87-98.
9. Nakamura T, de-Vega S, Fukumoto S, Vilaxa A, Fukumoto S, Yamada KM, Yamada Y. 2004. The Krüppel-like factor epiprofin is expressed by epithelium of developing teeth, hair follicles, and limb buds and promotes cell proliferation. J. Biol.
Chem. 279 (1):626-34.
10. Hertveldt V, De Mees C, Scohy S, Van Vooren P, Szpirer J, Szpirer C. 2007. The Sp6 locus uses several promoters and generates sense and antisense transcripts. Biochimie. 89 (11):1381-7. 11. Abe K, Miyoshi K, Muto T, Ruspita I, Horiguchi T, Nagata T, Noma T.2007. Establishment and characterization of rat dental epithelial derived ameloblast-lineage clones. J. Biosci. Bioeng. 103 (5): 479-85.
12. Kawano S, Morotomi T, Toyono T, Nakamura N, Uchida T, Ohishi M, Toyoshima K, Harada H. 2002. Establishment of dental epithelial cell line (HAT-7) and the cell differentiation dependent on Notch signaling pathway. Connect. Tissue Res. 43 (2-3): 409-12.
13. Kawase T, Orikasa M, Suzuki A. 1990. A clonal prostaglandin-responsive cell line (RDP 4-1) derived from rat dental pulp. Bone Miner. 11 (2): 163-75.
14. Macville M, Schrock E, Padilla-Nash H, Keck C, Ghadimi BM, Zimonjic D, Popescu N, Ried T. 1999. Comprehensive and definitive molecular cytogenetic characterization of HeLa cells by spectral karyotyping. Cancer Res. 59 (1): 141-50. 15. Ostlund RE, Seemayer R, Gupta S, Kimmel R, Ostlund EL, Sherman WR. 1996. A stereospecific myo-inositol/D-chiro-inositol transporter in HepG2 liver cells. Identification with D-chiro-[3-3H] inositol. J. Biol. Chem. 27(17): 10073-8. 16. Shaw G, Morse S, Ararat M, Graham FL. 2002.
Preferential transformation of human neuronal cells by human adenoviruses and the origin of HEK 293 cells. FASEB J. 16(8): 869-71.
17. Feng XH and Derynck R. 1996. Ligand-independent activation of transforming growth factor (TGF) beta signaling pathways by heteromeric cytoplasmic domains of TGF-beta receptors. J. Biol. Chem. 271 (22): 13123-9.
18. Ishitani T, Tsuji JN, Nagai S, Nishita M, Meneghini M, Barker N, Waterman M, Bowerman N, Clevers H, Shibuya H, Matsumoto K. 1999. The TAK1-NLK-MAPK-related pathway antagonize signaling between β-catenin and transcription factor TCF.
Nature 399 (6738): 798-802.
19. Dean A. 2006. On a chromosome far, far away: LCRs and gene expression. Trends Genet. 22 (1) : 38-45.
20. Golonzhka O, Metzger D, Bornert JM, Bay BK, Gross MK, Kioussi C, Leid M. 2009. Ctip2/Bcl11b controls ameloblast formation during mammalian odontogenesis. Proc. Natl. Acad. Sci.
USA. 106 (11): 4278-83.
21. Byrne BJ, Davis MS, Yamaguchi J, Bergsma DJ, Subramanian KN. 1983. Definition of the simian virus 40 early promoter region and demonstration of a host range bias in the enhancement effect of the simian virus 40 72-base-pair repeat. Proc. Natl. Acad. Sci. USA. 80 (3):721-5.
22. Liu F, Chu EY, Watt B, Zhang Y, Gallant MN, Andl T, Yang SH, Lu MM, Piccolo S, Schmidt-Ullrich R, Taketo MM, Morrisey MM, Atit R, Dlugozs AA, Milar SE. 2008. Wnt/β-catenin signaling directs multiple stages of tooth morphogenesis. Dev.