SOILS AND FOUNDATIONS Vol. 45, No. 6, 89-101, Dec. 2005 Japanese Geotechnical Society
LIQUEFACTION
IN THE CHI-CHI EARTHQUAKE-EFFECT
OF FINES AND
CAPPING NON-LIQUEFIABLE LAYERS
C. HSEIN JUANGi), SUSAN HUI YANGii), HAIMING YUANiii) and SUNNY YE FANGi)
ABSTRACT
The 1999 Chi-Chi, Taiwan, earthquake caused great destruction to buildings, bridges, and other facilities, and a death toll of 2470. of particular interest to geotechnical engineers in this event is the evidence of widespread liquefac-tion that caused significant damage to buildings, lifelines and harbor facilities. Shortly after the earthquake, an
extensive field investigation in the Yuanlin area, including in situ tests and laboratory tests, was conducted by Moh and Associates, Inc. These in situ and laboratory tests along with ground performance observations offer a chance to examine the existing methods of liquefaction potential evaluation. In this paper, 22 cases of ground performance in the Yuanlin area that experienced extensive soil liquefaction are studied. These are case histories that were well docu-mented with field observations of ground performance in the Chi-Chi event. Attempt is made to analyze liquefaction potential using the Standard Penetration Test (SPT) data that are associated with each case history. Results of the analyses show that in general, surface manifestation of liquefaction can be fairly accurately predicted using simplified methods. In many cases where the subsurface deposit consists of alternate layers of silty clay and silty sand, however, the effect of capping clay layers must be considered in order to correctly account for the presence or lack of surface manifestation of liquefaction.
Key words: earthquake, ground failure, probability of liquefaction, soil liquefaction, standard penetration test (IGC: B4/C8/E8)
INTRODUCTION
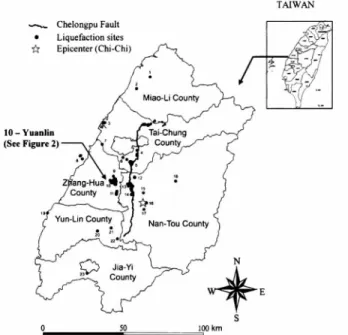
In the event of the 21 September, 1999 Chi-Chi, Tai-wan earthquake (ML=7.3; Mw=7.6), locally known as the 921 earthquake, which caused 2,470 fatalities and a great destruction to buildings, bridges, and other infras-tructure components, widespread liquefaction was ob-served in the towns of Yuanlin, Nantou, and Wufeng. Figure 1 shows the distribution of liquefaction sites in central Taiwan in the Chi-Chi event compiled by Nation-al Center for Research on Earthquake Engineering (NCREE, 1999). Shortly after the earthquake, Moh and Associates (2000) carried out an extensive field investiga-tion in Yuanlin, with an emphasis on soil liquefaction. The data compiled by Moh and Associates (2000) provide a basis for examining the applicability of existing simpli-fied methods for liquefaction potential evaluation (e.g., Hwang and Yang, 2001).
In this paper, 22 cases of ground performance in the Yuanlin area in the Chi-Chi event are analyzed. These are case histories where ground performance, either with damaging effect at the ground surface or without, was recorded with certainty. The intent of the analyses is to see if the observed ground performance in the Yuanlin
Fig. 1. Distribution of liquefaction sites in the Chi-Chi event (NCREE, 1999)
i,Department of Civil Engineering, Clemson University, Clemson,SC 29634-0911, USA(HSEIN@CLEMSON.EDU). ii) Golder Associates, Inc., Sacramento Office, Roseville, CA 95678, USA.
iii)Golder Associates
, Inc., Reno Office, Reno, NV 89509, USA.
The manuscript for this paper was received for review on November 5,2004;approved on September 6,2005.
Written discussions on this paper should be submitted before July 1,2006 to the Japanese Geotechnical Society,4-38-2, Sengoku, Bunkyo-ku, Tokyo 112-0011,Japan. Upon request the closing date may be extended one month.
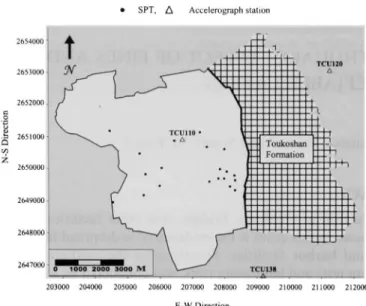
Fig. 2. Locations of the SPTs and the accelerograph stations
area in the Chi-Chi event can be satisfactorily accounted for using the existing simplified methods. Special effort is devoted to investigate the effect of capping clay layers on the presence or lack of surface manifestation of liquefac-tion.
FIELD INVESTIGATION AND GEOLOGIC
CONDITIONS IN YUANLIN
Yuanlin is a town in the Zhang-Hua County (also known as Changhwa County), which is located approxi-mately 15km from the Chelungpu fault rupture that caused the Chi-Chi event (see Fig. 1 for location of Yuan-lin which is denoted as Location No. 10). Ground motions recorded at the Yuanlin Elementary School (Station TCU 110), one of the 441 free-field digital accelerograph stations in Taiwan, were modest, with a maximum horizontal peak ground acceleration (PGA) of 0.19g. The geometric mean PGA was 0.18g. Although the town experienced widespread liquefaction effects, no evidence of liquefaction was observed at the site of the station. The accelerograph station TCU110, which is located in the town of Yuanlin, is 26km from the epicenter, and 14.13km from the fault rupture. Two other accelerograph stations TCU120 and TCU138 are near the town of Yuanlin, one to the north of the town and the other to the south (Fig. 2). TCU120 recorded a maximum horizontal PGA of 0.23g, and a mean PGA of 0.21g. TCU138 recorded a maximum horizontal PGA of 0.22g, and a mean PGA of 0.21g. These PGA numbers are quite consistent with each others. However, the station TCU 110 is closer to locations of the 22 SPTs (all within 4km) than the other two stations; thus, the PGA of 0.19g is used in the liquefaction analysis of the 22 cases. It should be noted that an attempt was made to use attenuation relations from the Chi-Chi event derived by Wang et al. (2002), which was based on regression analyses of accelerographs recorded at a large array (> 130 stations) of near-fault (<55km) stations.
However, significant discrepancy was found between the recorded PGAs and those calculated with the attenuation relations for the three stations TCUs 110, 120, and 138. Thus, the recorded PGA of 0.19g at TCU110 is consid-ered approximate but appropriate for use in the present study.
Fig. 3. Tilting of a building due to liquefaction in Wufeng in the 1999 Chi-Chi earthquake: sand boils are shown in the foreground
(Photo credit: Der-Her Lee)
Fig. 4. Sand boiling in Zhangbin Industrial Park in the 1999 Chi-Chi earthquake (Photo credit: Der-Her Lee)
Fig. 5. Liquefaction-induced settlement at Taichung Port in the 1999 Chi-Chi earthquake (Photo credit: Der-Her Lee)
In the investigation carried out by Moh and Associates (2000), liquefaction sites were mainly identified through
LIQUEFACTION IN THE CHI-CHI EARTHQUAKE 91
Table 1. Catalog of SPT-based case histories with field observations in the Yuanlin area
Note 1: One data point from the silty sand layer shows extremely high probability of liquefaction. Two data points in the same layer, which have extremely high fines content, show only moderate levels of probability. It is difficult to assess the thickness of the liquefiable layer in the Chi-Chi event.
Note 2: The calculated probability of liquefaction indicates that there is a high likelihood of liquefaction between the depths of about 4 m to 6 m. However, no data from the depth of 0.8 m to 2.8 m is available, and thus it is difficult to assess the thicknesses of the liquefiable layer and the non-liquefiable layer.
Note 3: GWT refers to the depth to the ground water table.
field reconnaissance and inquiry. If obvious liquefaction evidence such as sand boils and settlement was found (for example, see Figs. 3, 4, and 5), the site was identified as a
"liquefied site"
, and the data collected from this site were labeled "liquefied case". On the other hand, a site without any liquefaction evidence was classified as a "non -liquefied site" and the data collected from this site were labeled "non-liquefied case". In a field investiga-tion, it is easy to identify a liquefied site if obvious liquefaction evidence can be found at the site. As is described later, however, in some districts in Yuanlin,
there exits a thick capping clay layer, and, thus, it may not be assessed with certainty that no liquefaction oc-curred at a site even if there was no liquefaction evidence found on the ground surface. In this paper, only clear-cut cases that are provided with a boring log, a profile of SPT blow count, and other index tests (such as particle size distribution and Atterberg limits) are analyzed. These SPT-based case histories are cataloged and listed in Table 1. Figure 2 shows the locations of these SPTs in the town of Yuanlin, along with the three accelerograph stations.
It should be noted that energy measurements of SPTs in Yuanlin were performed by Moh and Associates (2000). The energy ratio of SPT in the analysis is a func-tion of depth as follows(Moh and Associates,2000):
where ER is the hammer energy ratio or efficiency at the depth of z. The energy ratio presented here includes both energy and rod length corrections.
Yuanlin is situated on a thick alluvial deposit of the Tsosui River at the foothill of Toukoshan Formation. Soil conditions in the relatively flat(slope<1°) portion of Yuanlin west of Shan-Jao Road consist of Holocene alluvium, which overlies older sedimentary deposits (Stewart et al.,2000). The depth to the bedrock increases from east to west, reaching a depth of more than 200 m (Ueng et al.,2000). The groundwater table is generally quite shallow, ranging from about 0.5 to 4.0 m below the ground surface. There exist layers of very loose sandy soils that are susceptible to liquefaction. At some loca-tions, these liquefiable sandy layers are capped by a thick layer of clayey soils. At other locations, however, sand deposits exist near the ground surface with little or no capping clayey layer. Severe damage to buildings was generally found at sites with little or no capping clayey layers(Ueng et al.,2000).
SPT-BASED METHOD-A BRIEF REVIEW
A brief review of the simplified methods for liquefac-tion potential evaluation is provided here to set the stage for case-by-case examination of ground performance. The simplified procedure for evaluating liquefaction
resistance of soils was originated by Seed and Idriss (1971).This procedure has evolved, through several stages ofmodification and improvement(Seed and Idriss,
1982;Seed et al., 1985), as a standard of practice for evaluating liquefaction resistance of soils. The most recent update ofthe method is documented by Youd et al. (2001).In Japan and many oriental countries, simplified methods recommended by Japan Road Association (1990),Tokimatsu and Yoshimi(1983), and Iwasaki et al. (1982)are often employed. In the present study, a standard penetration test(SPT)-based simplified method by the authors is used for evaluating liquefaction poten-tial, which is expressed in terms of both factor of safety and probability of liquefaction. of course, any of the methods mentioned above could be used for liquefaction analysis. In a post-earthquake analysis of soil liquefac-tion, however, it would be desirable to be able to estimate the probability of liquefaction.
In the proposed method, the following equation is used for determination of cyclic stress ratio(CSR7.5):
(1)
σv=the vertical total stress ofthe soil at the depth considered,
σ'v=the vertical effective stress of the soil at the same depth,
amax=the peak horizontal ground surface tion,
g=the acceleration of gravity,
rd=the shear stress reduction factor, and MSF=the magnitude scaling factor.
Equation(1)was originated by Seed and Idriss(1971). However, a minor change was made here;the CSR is adjusted to earthquake magnitude of 7.5 using the mag-nitude-scaling factor(MSF)defined as:
(2) where MW is the moment magnitude. Equation(2)was originated by l. M.ldriss(cited in Youd et al.,2001). The MSF defined in Eq.(2)represents the lower bound of the range of MSFs recommended by Youd et al.(2001). The variable rd in Eq.(1)is calculated as follows(Liao et al.,1988):
(3)
Equations (2)and (3)are generally accepted by the
geotechnical community, although many other different
sets of rd and MSF formulas have been proposed. Equations(1)through(3)are collectively referred to here-in as the CSR, .S model.
For liquefaction potential evaluation, the calculated
CSR, .S is compared with the cyclic resistance ratio
(CRR,.S). The following CRR,.S model is used in the
present study. This model is developed through
regres-sion analysis of"limit state"data generated by a search-ing algorithm that is based on artificial neural network learning of case histories(Juang et al.,2000a). The detail of the development process for this model is beyond the
scope of the present paper but a summary with needed
equations and an assessment of this model are given below:
(4) where Ka is a function of the effective stress σ'v and NE is the equivalent blow count:
(5)
(6) where the variable RP is a function of LL and PI:
(7) and where the variable a is a function of LL:
(8)
LIQUEFACTION IN THE CHI-CHI EARTHQUAKE 93
Fig.6. Plot of CRR model(Eq.(4))along with searched limit state data points
(% of particle size smaller than 0.005mm), fines content (% of particle size smaller than No.200 sieve, or 0.075 mm), liquid limit, and plasticity index. Use of 5μm(i.e., 0.005mm)as the upper bound of clay size is consistent with the so-called Chinese Criteria and geotechnical engineering practice in Taiwan.
Equation (4)and the associated equations are the results of regression analyses using the limit state data searched with an artificial neural network. Figure 6 shows the curve of Eq.(4)along with the searched limit state data points. It should be noted that these data points are not the"real"case histories;rather, they are the searched data points that are believed to locate on the unknown limit state(or boundary curve). Also shown in this figure are the curves of the"best estimate"plus and minus 15%.Thus, Fig. 6 also provides an indication of the uncertainty of the developed CRR model(Eq.(4)).
Equations(4)through(8)are collectively referred to herein as the CRR7-5 model in the proposed method. In this CRR, .S model, the upper bound ofNE and CC are set to be 32 and 15, respectively. Thus, for determination of CRR, .S using this model, if NE>32, it is set to 32, and if CC>15, it is set to 15. Whereas there is no theoretical basis, these upper bounds are supported by the cases analyzed. In fact, they are dictated by the functional forms and results of regression analyses. Use of these upper bounds in the calculation of CRR,.s also results in conservative estimates of liquefaction resistance when these values are above the upper bounds, which is desirable. Finally, they are quite consistent with the concept ofthe limiting value ofN1 ,60.cs(the corrected blow count for an equivalent clean sand)in the SPT-based simplified method recommended by Youd et al.(2001). For convenience of presentation, CSR,.s and CRR,.S
are denoted hereinafter in this paper as CSR and CRR,
when there is no likelihood of confusion.
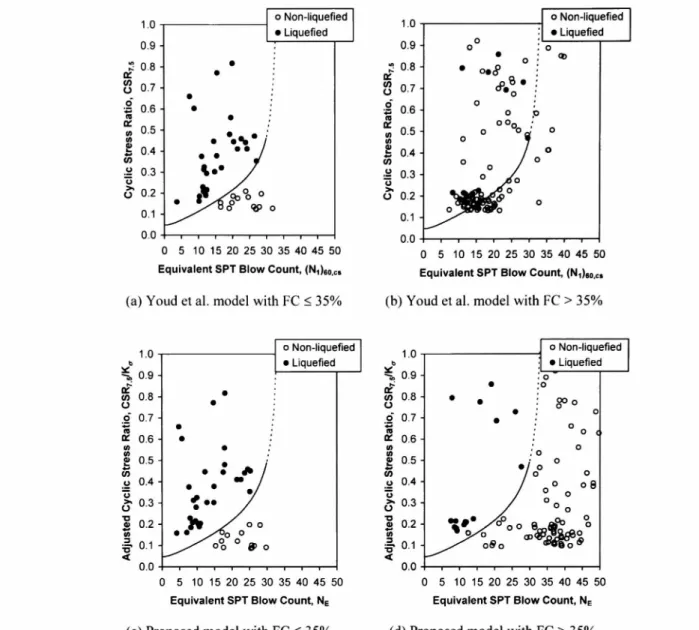
To assess the proposed model, the boundary curve is plotted along with the data points that were used to de-velop the proposed model, as shown in Fig.7. Figure 7(c) shows the cases with FC<35%, and Fig.7(d)shows those cases with FC>35%, along with the boundary curve of the proposed model. It should be noted that in Eq.(4), CRR, which can be thought of as the critical CSR, is a function ofonly two main variables,NE and Ko, and thus, a two-dimensional graph of the boundary curve can be drawn for a fixed Kσ of 1,which occurs when σ'v= 100kPa. To plot the actual data points in Figs. 7(c) and (d),the CSR value for each case has to be adjusted to the conditions of (or Kσ=1) and Mw=7.5. Thus, for each data point, the adjusted cyclic stress ratio,
CSR7.5/Kσ is plotted against the equivalent blow count, NE.
As seen from Figs. 7(c)and(d), the proposed model appears to be able to separate liquefied cases from non-liquefied cases regardless of whether FC>35%. However, this is not the case with the Youd et al.(2001) model. Figures 7(a)and(b)show the same data with the boundary curve recommended by Youd et al.(2001). As seen from Figs. 7(a) and (b), the liquefied cases are correctly"predicted"by the Youd et al.(2001) method
regardless of the FC values, whereas the non-liquefied cases are correctly predicted only when FC≦35%. For
FC>35%, the prediction of non-liquefied cases is not as accurate. This indicates that the Youd et al.(2001) method is conservative, which is expected and desirable; however, it does not fully reflect the effect of fines and plasticity, particularly for FC>35%.
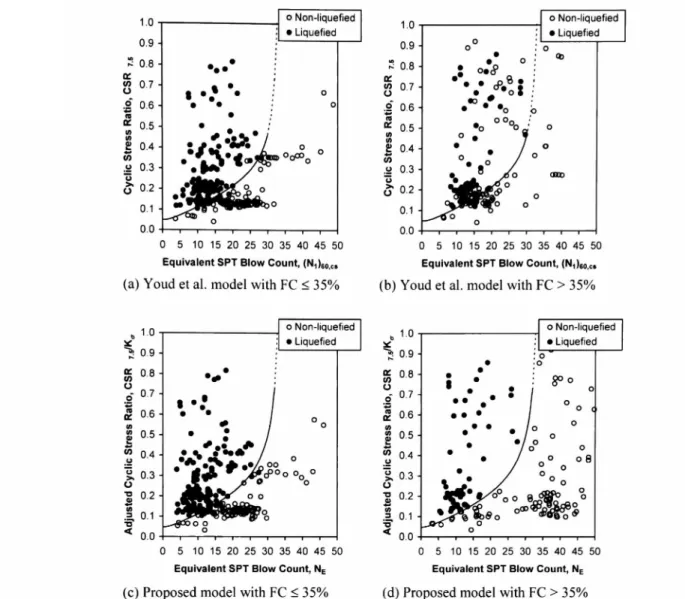
To further compare the two models, additional data from others are also used. Figure 8 is the same as Fig.7 except that additional data(288 cases)by Hwang and Yang(2001)are added. The proposed model is seen to be able to account for the effect of fines and plasticity more correctly, particularly for cases with FC>35%, although both models are found to be able to predict liquefied cases satisfactorily.
In the deterministic approach, CRR and CSR of a soil subjected to an earthquake loading are first calculated, and the factor of safety(FS)defined as FS=CRR/CSR is then determined. A soil is predicted to liquefy if FS<1. On the other hand, no liquefaction is predicted if FS>1. The deterministic method, however, may not be the best choice to judge whether liquefaction occurred in a post-earthquake investigation, because of the model and parameter uncertainties. In general, the first order reliability method(Baecher and Christian,2003)may be used to compute the reliability index and the corre-sponding notional probability of liquefaction (Juang et al.,2004). Alternatively, a mapping function may be developed using Bayes'theorem(Juang et al.,2000b). Following the procedures described by Juang et al. (2000b), the mapping function that relates the probability of liquefaction(PL)with the calculated factor of safety (FS)can be obtained from a calibration process using all the field cases shown in Fig. 8:
Fig. 7. Comparison of the proposed model and the Youd et al. (2001) model with data that were used for development of the proposed model
(9) Figure 9 shows relative frequencies (i.e., discrete distribu-tions) of the calculated Fs values for the groups of liquefied and non-liquefied cases, respectively, and the PL-Fs mapping function (Eq. (9)) derived from the distributions of Fs. For each data point (PL, Fs) shown in Fig. 9(b), the value of Fs is the midpoint value of each class in the histogram, and PL is the probability calcu-lated from the Bayes' theorem using the relative frequen-cies of the liquefied and non-liquefied groups, as outlined in Juang et al. (2000b). The sudden drop of the PL values of the data points (from Fs=1.1 to Fs=1.3) reflects the imperfect nature of "sampling" of case histories. However, the standard error of the curve-fitting (Eq. (9) to the discrete data points) is relatively small, and Eq. (9) is considered a reasonable estimate of the "true" PL-Fs mapping function.
It should be noted that Eq. (9) can provide a reasonable
estimate of the probability of liquefaction in the absence of the knowledge of parameter uncertainties (i.e., the uncertainties of the parameters that are required in Eqs. (1) and (4) and the associated equations for the determination of CSR and CRR). If the parameter uncertainties and the model uncertainty (i.e., the uncertainties of the CRR and CSR models) are known, more accurate estimate of the probability of liquefaction can be obtained by using the first order reliability method (Juang et al., 2004). In general, however, the model uncertainty is unknown and the determination of parameter uncertainties is time consuming and costly, and thus, use of Eq. (9) for estimating the probability of liquefaction is appropriate.
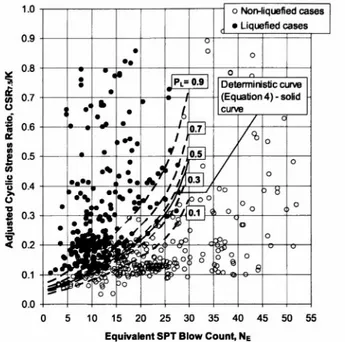
Equations (1) through (9) allow for a simple way of determining the probability of liquefaction given the borehole information and other required soil and seismic data. The probability of liquefaction offers an alternative to the traditional factor of safety approach to examine, and correlate with, field observations. Figure 10 shows a
LIOUEFACTION IN THE CHI-CHI FARTHOUAKE 95
Fig. 8. Comparison of the proposed model and the Youd et al. (2001) model with additional data from Hwang and Yang (2001)
set of probability curves based on Eq.(9)along with the actual case histories. The reader is referred to Juang et al. (2002)for plotting of the probability curves based on a PL-FS mapping function such as Ey.(9)」t should also be noted that Eq.(9)and probability curves in Fig. 10 are valid only for cases that have similar uncertainty charac-teristics as in the proposed CRR model. For other CRR models and data, different mapping functions in the form of Eq.(9)should be created.
Moreover, as a way to interpret the calculated probability of liquefaction, the following interpretation rule proposed by Chen and Juang (2000) are adopted:(a) the likelihood of liquefaction is described as"almost certain to occur" if the probability of liquefaction pL≧0.85,(b)the likelihood is described as"very likely" if 0.65≦PL<0.85,(c)the likelihood is described as"like-ly"if 0.35≦PL<0.65,(d)the likelihood is described as
"unlikely"if 0
.15≦PL<0.35, and(e)the likelihood is described as"almost certain not to occur"if PL<0.15. This interpretation or classification rule is particularly useful for interpreting the results of post-earthquake,
``after-the-fact"back analyses. The concept of PL-FS
mapping function and the rule for interpreting the probability of liquefaction have been applied by other investigators (e.g., Liao et al., 2002).
LIQUEFACTION-INDUCED GROUND FAILURE
ANALYSIS
In the liquefaction analyses presented below, emphasis is placed on the evaluation of liquefaction-induced ground failure such as sand boiling and settlement at the ground surface at each site using the SPT boring log and related index testing. The analyses are carried out on all 22 cases listed in Table 1 using the proposed CPT-based method.
Analyses of Cases with Evidence of Ground Failure YL-S3: This case is located in Dachun, a village to the north of Yuanlin. The SPT was conducted in the area that was identified with scatter sand boils and settlement. The groundwater table was generally within 1 m of the ground surface. The boring log in YL-S3 showed that the site consisted of a layer of loose backfill (about 1.0m
thick), underlain by alternate layers of silty clay and silty sand deposits. The liquefiable layers may be identified with the calculated probability of liquefaction (PL). According to Chen and Juang (2000), the occurrence of
liquefaction is "very likely" if PL>65%, and is "almost certain" if PL>85%. Figure 11 shows the boring log along with profiles of soil parameters and calculated probability of liquefaction. The PL profile suggests a high likelihood of liquefaction in the upper sand layer as well as in the weak and sensitive layer of silt-clay mixture, which agrees quite well with field observations.
Fig. 9. Distributions of Fs values and the derived PL-FS mapping function
As is discussed later, the effect of capping non-liquefied layer may prevent ground failure such as sand boiling and settlement from occurring. Ishihara (1985) proposed a procedure to investigate this effect. In his procedure, two thickness terms are defined: H, as the thickness of the overburden non-liquefied soil layer and H2 as the thick-ness of the liquefied soil layer. A boundary curve of H2 versus H, may be established for a given amax, which can
Fig. 10. Probability curves derived from Eq. (9) and the deterministic model
LIQUEFACTION IN THE CHI-CHI EARTHQUAKE 97
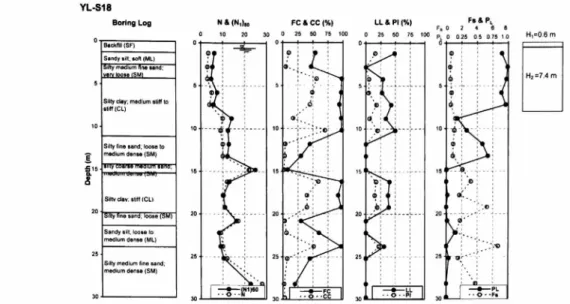
Fig. 12. Boring log and profiles of soil parameters and the probability of liquefaction at YL-S18
then be used to judge whether ground failure will occur. This procedure is adopted in the present study to inves-tigate whether the observed ground performance (with or without surface manifestation) can be explained with H, and H2 that are determined based on the profile of probability of liquefaction. It should be noted that the values of H, and H2 are determined with engineering judgment based on the profile of the probability of liquefaction. While the procedure of determining H, and H2 is not entirely objective, approximate results can be obtained by different persons if proper judgment is exercised using the profile of probability of liquefaction and the underlying interpretation rule by Chen and Juang (2000). The values of H, and H2 for this case are shown in Fig. 11.
YL-S18: This site is located in Mingshengli, a village on the west of Yuanlin. The SPT was conducted at a farmland in the south of that village. The ground water table was shallow, about 0.6 m below the ground surface. The boring log at YL-S18 showed that the site consisted of a layer of loose backfill (about 1.3 m thick), underlain by alternate layers of sandy silt and silty sand deposits. Large-scale sand boiling and settlement near the borehole were observed in the Chi-Chi event. Liquefiable layers near the top of the profile in the Chi-Chi event are identi-fied with the calculated probability of liquefaction, shown in Fig. 12. The field observation is easily account-ed for with the boring log and the calculataccount-ed PL profile.
YL-S28, YL-S29, YL-S30, YL-S35, YL-S43, YL-S44, YL-S45, YL-S46, YL-S47: The sites for these SPTs are located in Lunyali (also known as Lunya District), a village in the middle of Yuanlin. Lunyali experienced a widespread liquefaction-induced ground failure. This liquefied zone was the largest and most damaging in Yuanlin in the Chi-Chi event. In an area of about 1.2 km by 1.5 km, widespread ground failures (sand boiling, settlement, cracks, tilting of buildings) were observed in almost half of the area. The groundwater table varied from 0.5 m to 2.3 m below the ground surface. One
common characteristic in this liquefied zone was that the uppermost liquefiable layer, which consisted of loose to medium dense silty sands with thin inter-bedded silt-clay layers, was generally very thick compared with the over-burden no-liquefaction layer. In all cases except YL-S35, the PL profiles suggest high likelihood of liquefaction and ground failure. It should be noted that in the cases of YL-S29, YL-S44, and YL-46, the calculated probability at some depth within the liquefiable layer might be questionable from the overall "picture" of the informa-tion available. Such data point is discounted from the PL profile if it meets either or both of the following two conditions: a) it occurred in a thin non-liquefiable layer sandwiched by thicker liquefiable layers, and b) it is judged inconsistent with the data points above and below
based on all other information.
In the case of YL-S35, the groundwater table was at 2.3 m, and the loose backfill (0.8 m in thickness) was underlain by an 8.8 m thick silty sand layer. Among the four samples taken from this silty sand layer, only one sample (at the depth of about 6 m) shows extremely high probability of liquefaction. However, when judged together with the boring log and related data, the silty sand layer was considered liquefiable in the Chi-Chi event, although the extent (i.e., thickness) of the liquefia-ble layer is difficult to assess.
YL-S21: This site is located in Zhenxingli, next to Lunyali. Although the liquefaction-induced damage in Zhenxingli was not as severe as that in Lunyali, widespread sand boiling and scattered settlement were also observed in the area adjacent to Lunyali. In Zhenxingli, the groundwater table of YL-S21 was 0.71 m below the ground surface. The boring log showed that there was a backfill layer of 2.3 m, underlain by a silty sand layer with a thickness of 4.5 m. Two SPT samples taken from the silty sand layer contained material of silt-clay mixture that existed within the silty sand layer. The calculated probabilities at these two depths were not as high as the other one in the sand layer where the
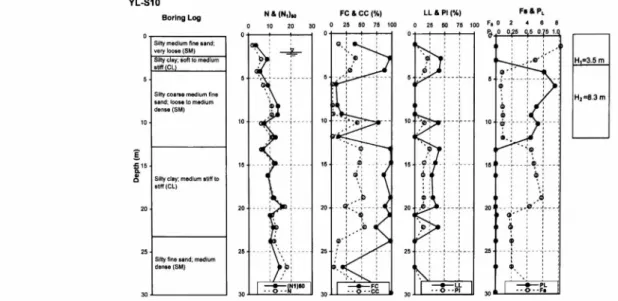
probabil-Fig. 13. Boring log and profiles of soil parameters and the probability of liquefaction at YL-S10
ity of liquefaction was extremely high. The overall infor-mation at this site suggests that the silty sand layer was li-quefiable in the Chi-Chi event.
YL-S25: This site is located in Huilaili, and sur-rounded bymany buildings. The groundwater table was very shallow (at the depth of 0.8m below the ground surface). Although the observed liquefied zone was quite small, both sand boiling and settlement were observed at this site in the Chi-Chi event. Based on the calculated probability of liquefaction, there is a high likelihood of liquefaction between the depths of about 4m to 6m. However, no data from the depth of 0.8m to 2.8m is available, and thus the liquefaction potential of this layer cannot be analyzed. The overall information at this site suggests that the top layers were liquefiable in the Chi-Chi event.
YL-S26: This site is located in Yuanji Road of Daraoli, a village of Yuanlin. Along Yuanji Road, sand boils and tilting of the buildings were observed. The groundwater table was at the depth of 1.0m. Based on the calculated probability, the upper liquefiable layers be-tween the depths of 1.0m and 8.8m are believed to have caused ground failure at this site, which explains the field observation.
Analyses of Cases without Evidences of Ground Failure YL-S10: This site is located on northwest of Yuanlin. This SPT borehole was surrounded bymany buildings. The groundwater table was at the depth of 2.0m below the ground surface. No surfacemanifestation of liquefac-tion was found in this district in the Chi-Chi event. Based on the calculated probability of liquefaction (Fig. 13), a liquefiable layer is identified at the depths of between
about 4m and 12m. The surfacemanifestation of
liquefaction was not observed probably because of the capping non-liquefiable layers. Thismight be explained with the procedure suggested by Ishihara (1985), and the issue is discussed later.
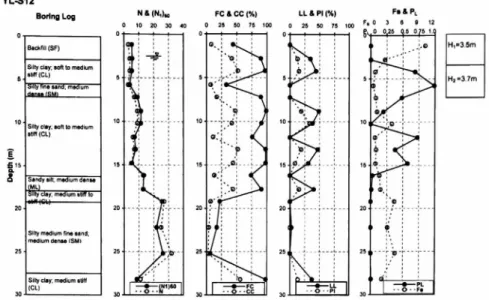
YL-S12: This site is located in Fuzhenli, a village near
the center of Yuanlin. There were some scatteredminor liquefaction zones in this village, but no surface manifestation of liquefaction was observed at this site in the Chi-Chi event. The groundwater table was at the depth of 2.5m below the ground surface. The liquefiable layers and the capping non-liquefiable layers are identi-fied with the calculated probability of liquefaction (Fig. 14). The reason for no surfacemanifestation of liquefaction is believed to be the same as in the case of YL-S10, that is, due to the capping non-liquefied layers.
YL-S14: This site is located on the northeast of Zhenxingli, a village near the center of Yuanlin. There were liquefaction-induced ground failures observed on the south of the village, but no surfacemanifestation found within proximity of this SPT borehole. The groundwater table was 1.6m below ground surface. The liquefiable layer and the capping non-liquefiable layer are identified with the calculated probability of liquefaction. Again, the reason for no surfacemanifestation of liquefaction is believed to be the same as in the case of YL-S 10.
YL-S15: This site is located in Shantiaoli, a village on northwest of the center of Yuanlin. No surface manifestation of liquefaction was found in this village. The groundwater table was 0.85m below ground surface. The capping non-liquefiable layer was underlain by a liquefiable layer, as reflected in the profiles of the calculated probability of liquefaction. The reason for no surfacemanifestation of liquefaction is believed to be the same as in the case of YL-S 10.
YL-S17: This site is located in Zhongshanli, a village on northwest of Yuanlin. No liquefaction-induced ground failure was observed in this village. The ground-water table was 2.2m below ground surface. Based on the calculated probability of liquefaction, there was a thin liquefiable layer capped by thicker non-liquefied lay-ers. The reason for no surfacemanifestation of liquefaction is believed to be the same as in the case of YL-S 10.
LIQUEFACTION IN THE CHI-CHI EARTHQUAKE 99
Fig. 14. Boring log and profiles of soil parameters and the probability of liquefaction at YL-S12
YL-S31: This site is located to the west of Gouzaoli, a village on the southwest of Yuanlin.
Liquefaction-induced ground failures were found on the north of this village but no liquefaction evidence on the ground sur-face was observed within 200m of this site. The ground-water table was 4.2m below the ground surface. Based on the calculated probability of liquefaction, the liquefia-ble layer is identified (at the depths of between 5m and 11m). The reason for no surfacemanifestation of liquefaction at this site is believed to be the same as in the case of YL-S 10.
YL-S32: This site is located in Zhongyangli, a village on the southwest of Yuanlin. No liquefaction evidence was found in this village in the Chi-Chi event. The ground-water table was 2.0m below the ground surface. A thin liquefiable layer was capped by a thick non-liquefiable layer, as shown in the profile of the calculated probability of liquefaction. The reason for no surfacemanifestation of liquefaction is believed to be the same as in the case of YL-S 10.
YL-S41: This site is located in Fuzhenli. There were no severe liquefaction-induced ground failures except someminor settlement in the Chi-Chi event, and this SPT borehole was far away from the settlement area. The groundwater table was at the depth of 0.9m. The boring log showed that the first layer was a silty clay layer, underlain by a sandy silt layer. Based on the calculated probability of liquefaction, the liquefiable layer and the capping non-liquefiable layer are identified. The reason for no surfacemanifestation of liquefaction at this site is believed to be the same as in the case of YL-S10. Effect of Capping Non-Liquefiable Layer
The analyses presented previously showed that there exist liquefiable layers at sites with surfacemanifestation of liquefaction as well as at sites without surface manifestation. It appears that the capping, overburden non-liquefiable layersmight have prevented ground failure such as sand boiling and settlement from
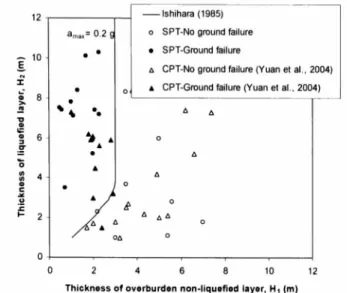
occur-ring in the Chi-Chi event. To this end, the procedure by Ishihara (1985) is utilized to investigate the effect of capping non-liquefied layer. Asmentioned previously, Ishihara defined two thickness terms: H, as the thickness of the overburden non-liquefied soil layer and H2 as the thickness of the liquefied soil layer. According to Ishihara, the occurrence of sand boiling depends on the relation of H, to H2 and amax. A boundary curve of H2 versus H1may be plotted for a given amax•EFigure 15 shows such a boundary curve for amax=0.2g. Since this amax is approximately equal to the peak horizontal ground acceleration of 0.19g used in the analyses, this boundary curvemay be used to examine the cases presented previously. Table 1 summarizes the assessed H, and H2 for 20 of the 22 cases analyzed (note: it is difficult to assess H1 and H2 in two cases, YL-S35 and YL-S25, as noted in Table 1). The (H1, H2) data points for these 20 cases are shown in Fig. 15. All source data are available upon request from the first author.
Fig. 15. Ishihara's boundary curve for evaluating the effect of capping non-liquefied layer (with 20 SPT-based case histories from the 1999 Chi-Chi event)
Fig. 16. Ishihara's boundary curve for evaluating the effect of capping non-liquefied layer (with 20 SPT-based cases and 24 CPT-based
cases from the 1999 Chi-Chi event)
Some observations follow from Fig. 15. Ishihara's boundary curve for evaluating ground failure, particu-larly the occurrence of sand boils, is found to agree quite well with the cases from the Chi-Chi event. In many cases, the capping, overburden non-liquefiable layers are thick enough to prevent sand boiling and/or severe settlement from occurring. Figure 16 shows additional data obtained by Yuan et al. (2004) based on their analyses of the Chi-Chi cases using cone penetration test (CPT). These additional data further confirm the applicability of the Ishihara's procedure in assessing the effect of capping non-liquefied layers. Thus, the effect of capping clay layers must be considered in order to correctly account for the presence or lack of surface manifestation of liquefaction. In a post-earthquake investigation where existing methods are often re-assessed for their accuracy and applicability, it is im-portant to pay close attention to the effect of capping non-liquefiable layers.
CONCLUSIONS
1. In this paper, field observations of ground ance in the Yuanlin area during the 1999 Chi-Chi event, along with detailed geologic and SPT borehole data, are documented. In short, 22 quality based liquefaction case histories are cataloged. 2. Analyses of liquefaction potential and ground
performance are carried out using the SPT borehole and associated laboratory data at each of the 22 sites. These analyses produce a profile of liquefaction
probability at each site. The obtained profile of liquefaction probability provides a means for ing liquefaction-induced ground failure potential. The post-Chi-Chi-earthquake assessment of ground performance at the sites studied generally agreed well with the field observations. This indicates that the
SPT-based simplified method(Eqs.(1)through(9))
presented in this paper is an effective method for assessing liquefaction potential.
3. The occurrence of liquefaction does not necessarily
cause ground failure according to limited cases
examined in this study. At some sites where thick capping clayey layers existed, ground failure, like sand boils, was not observed even though liquefiable layers were identified. Thus, the effect of capping non-liquefiable layers must be considered in the analysis in order to correctly account for the presence or lack ofsurface manifestation of liquefaction. This
is evidenced from the post-Chi-Chi-earthquake
vestigation of soil liquefaction in the Yuanlin area. 4.Analysis of the case histories of ground performance in the Chi-Chi event shows that Ishihara's procedure is quite effective for assessing the potential of ground failure at a level ground. The results confirm the findings by previous researchers.
ACKNOWLEDGMENTS
The study on which this paper is based was sponsored by the National Science Foundation(NSF)through Grant Nos. CMS-0085143 and CMS-0218365. The financial support by the NSF is greatly appreciated. The opinions presented in this paper, however, do not necessarily reflect those of the NSF. Dr. Richard Hwang and Mr. Ting-Chiun Su of Moh and Associates, Inc. are thanked for their assistance in providing data related to the Chi-Chi earthquake and for their helpful discussions of these
data. The anonymous reviewers and the Editor of the
Journal are thanked for their constructive comments that have helped sharpen this paper.
REFERENCES
1)Baecher, G. B. and Christian, J.T.(2003): Reliability and Statistics in Geotechnicai Engineering, Jon Wiley&Sons, Ltd.,West Sussex, England.
2)Chen, C.J.and Juang, C.H.(2000): Calibration of SPT-and CPT-based liquefaction evaluation methods, Innovations and Applications in Geotechnical Site Characterization, Geotechnical Special Publication No.97(eds. by Mayne, P. W. and Hryciw, R.) ASCE,49-64.
3)Hwang, J. H. and Yang, C.W.(2001): Verification of critical cyclic strength curve by Taiwan Chi-Chi earthquake data, Soil Dynamics and Earthquake Engineering,21,237-257.
4)Ishihara, K.(1985): Stability of natural deposits during quakes, Proc.11th ICSMFE, San Francisco, CA,1,321-376.
5)Iwasaki, T.,Arakawa, T. and Tokida, K.(1982): Simplified dures for assessing soil liquefaction during earthquakes, Proc. Soil Dynamics and Earthquake Engineering Conf., Southampton, UK, 925-939.
6)Japan Road Association(1990): Specifications for Highway Bridge, Part V, Maruzen, Tokyo(in Japanese).
7)Juang, C. H., Chen, C. J., Tang, W. H.and Rosowsky, D. V. (2000a): CPT-based liquefaction analysis, Part 1: Determination of limit state function, Geotechnique,50(5),583-592.
8)Juang, C. H., Chen, C. J., Rosowsky, D. V. and Tang, W. H. (2000b): CPT-based liquefaction analysis, Part 2:Reliability for design, Geotechnique,50(5),593-599.
LIQUEFACTION IN THE CHI-CHI EARTHQUAKE 101 Characterization of the uncertainty of the Robertson and Wride
model for liquefaction potential, Soil Dynamics and Earthquake Engineering, 24(9-10), 771-780.
10) Liao, S. S. C., Veneziano, D. and Whitman, R. V. (1988): sion models for evaluating liquefaction probability, J. Geotech. Engrg., ASCE, 114(4), 389-410.
11) Liao, T., Mayne, P. W., Tuttle, M. P., Schweig, E. S. and Van Arsdale, R. B. (2002): CPT site characterization for seismic hazards in the New Madrid seismic zone, Soil Dynamics and Earthquake Engineering, 22, 943-950.
12) Moh and Associates (2000): Soil Liquefaction Assessment and Remediation Study, Phase I (Yuanlin, Dachun, and Shetou), Summary Report and Appendices, Taipei, Taiwan (in Chinese). 13) National Center for Research on Earthquake Engineering (1999): Reconnaissance Report of the Geotechnical Hazards Caused by
Chi-Chi Earthquake, Taipei, Taiwan (in Chinese).
14) Seed, H. B. and Idriss, I. M. (1971): Simplified procedure for evaluating soil liquefaction potential, J. SMFD, ASCE, 97(9),
1249-1273.
15) Seed, H. B. and Idriss, I. M. (1982): Ground Motions and Soil Liquefaction during Earthquakes, Earthquake Engineering Research Center Monograph, EERI, Berkeley, CA, 1982.
16) Seed, H. B., Tokimatsu, K., Harder, L. F. and Chung, R. (1985): Influence of SPT procedures in soil liquefaction resistance evaluations, J. Geotech. Engrg., ASCE, 111(12), 1425-1445. 17) Stewart, J. P., Chu, D. B., Seed, R. B., Ju, J. W., Perkins, W. J., Boulanger, R. W., Chen, Y. C., Ou, C. Y., Sun, J. and Yu, M. S.
(2000): Incidents of soil liquefaction from the 921 Chi-Chi (Taiwan) earthquake, Proc. Int. Workshop Annu. Commemoration of Chi Earthquake, Vol. III-Geotechnical Aspect (eds. by Loh, C.
H. and Liao, W. I.), National Center for Research on Earthquake Engineering, Taipei, Taiwan, 119-130.
18) Tokimatsu, K. and Yoshimi, Y. (1983): Empirical correlation of soil liquefaction based on SPT N-value and fines content, Soils and Foundations, 23(4), 56-74.
19) Ueng, T. S., Chen, M. H. and Li, I. Y. (2000): Preliminary study of soil properties in Yuen-Lin liquefaction areas, Proc. Int. Workshop Annu. Commemoration of Chi-Chi Earthquake, Vol.
III- Geo technical Aspect (eds. by Loh, C. H. and Liao, W. l.), National Center for Research on Earthquake Engineering, Taipei,
Taiwan, 131-139.
20) Wang, G. Q., Zhou, X. Y., Zhang, P. Z. and lgel, H. (2002): Characteristics of amplitude and duration for near fault strong ground motion from the 1999 Chi-Chi, Taiwan earthquake, Soil Dynamics and Earthquake Engineering, 22, 73-96.
21) Youd, T. L. and Garris C. T. (1995): Liquefaction-induced ground surface disruption, J. Geotech. Engrg., ASCE, 121(11), 805-809. 22) Youd, T. L., Idriss, I. M., Andrus, R. D., Arango, I., Castro, G., Christian, J. T., Dobry, R., Liam Finn, W. D., Harder, Jr. L. F., Hynes, M. E., Ishihara, K., Koester, J. P., Laio, S. S. C., Marcuson III, W. F., Martin, G. R., Mitchell, J. K., Moriwaki, Y., Power, M. S., Robertson, P. K., Seed, R. B. and Stokoe II., K. H. (2001): Liquefaction resistance of soils: summary report from the 1996 NCEER and 1998 NCEER/NSF workshops on evaluation of liquefaction resistance of soils, J. Geotech. Geoenviron. Engrg., 127(10), 817-833.
23) Yuan, H., Yang, S. H., Andrus, R. D. and Juang, C. H. (2004): Liquefaction induced ground failure: A study of the Chi-Chi