Reliabilityand
Validity
of aTaskrbased
VVritingPerformance
Assessment
for
Japanese
Learners
ofEnglish
Yoshihito
SUGITA}'inmanashiPrefbcturalUhiversity
Abstract
Thisarticle examines
the
main dataofa task-basedwriting perfbrmancetestsin
whichthe five
junior
highschool teachers panicipatedas novice raters. The purpose ofthis
research istoimplementa task-basedwriting test(TBWT)
which was developedon thebasisof construct-based processingapproach totesting,and to examine the
degree
of reliability and validity of the assessment tasks and rating scales. Accuracy and communicability were definedas constructs, and thetestdevelopmentproceededaccording to such threestages asdesigning
and characterizing writing tasks,reviewing existingscoring proceduresand draftingrating scates. Each of the fortyscripts collected from twenty undergraduate students was scored by
five
new raters, and theanalyses weredone
using FACETS. The resultsindicated
thatallnovice ratersdisplayedacceptablelevels
ofselficonsistency,and
that
therewas no significantlydifTerent
scoring on thetwo tasksand overall impression,which providedreasonable fittotheRasch model. Themodified scales associated with thefiverating categories and theirspecific written samples were shown tobe
mostly cemprehensible and usable byraters, anddemonstrated
thatthestudents' ability was effectively measured using these tasksand ratingscales. However,futher
research is necessary fbrconsidering elimination ofinter-raterdifferences.
Key Words: writing perfbrmance,task-based assessment, FACETS, reliability, validity
1.
IntrodllctionInJapan,Englishlanguagehasbeentraditionallytaughtwith a fbcuson accuracy, and
indirectmeasurement iswidelyused inthe fieldofassessment.
There
seems tohavebeenaparadigmshift
frorn
accuracy-oriented to fiuency-orientedwriting instruction,but
no significant ehanges hayeoccurredin
an assessment of writing. Judgingfromthepresent state ofteaching and assessing writingin
Japan,itwould bemeaningfu1 todevelopscoringprocedures
for
writingperfbrrriance
assessment inplaceof traditionalindirecttestsof writing. The main purposeof thisstudy is 1) to implementadeveloped
wr:itingperfbrmanceassessment, and 2) exarnine the degreeof reliability and validity of the assessment tasksand rating scales. Itismotivated bysuch an urgent need
fbr
an improved assessment of writing, which isconducted inorder todevelop
a task-basedwriting testfor2.
Developmentofatask-basedwritingtest(TBwr) 2.1Construct-basedprocessing
approach totestingAs Bachman and Palmermentioned
(1996),
theprimarypurposeof a languagetestis
tomake
inferences
about lariguageability. The al)ilitythatwe want totestisdefinedas aconstruct, and describingthe constmct isone of themost
fundamental
concemsin
testdevelopment.When assessing writing, itisthereforenecessary to address theissueof
definingtheconstruct ofgood writing orwriting ability of our students.
Skehan
(1998)
claimed thattheprocessingperspectiveis
relevant tohow we directly explain underlying ahilitiestoperformance,as well as how we conceive of models oflanguageability. Inthisview, hedefines"ability for
use" as a construct, which rationalizes
theuse of tasks as a centralunit
within
atestingcontext and indevelopinga perfbrTnance test.According toSkehan,such a task-basedapproach totestingwould be`fto assume thatthereisa scale of dithcultyand thatstudents withgreaterIevelsof underlying abilitywill
thenbeal)letomore successfu11y complete taskswhich come higheron such a scale of
diMculty"
tp.174).
lnthisassumption, we findthattaskdithcultyisa majordeteminant
oftestperfbrrriance.Task-basedapproaches, therefore,need tofbcuson task
dithculty
as apreconditionforusing tasks-as-tests,and methods of evaluating task-basedperfbrmance.
Baclman
(2002),
however,claimed thattaskdithcultycanbe
fbund
with
the
various components ina perfbrrriancetaskand withtheinteractionsamongthem,
and thustaskdiMculty
isnot a separate factorand isno longerassumed tobe
amajordeterminant
oftestperfbrmance.Therefbre,heemphasized thatthetask-basedapproach has toconsider not only perfbrmanceson tasks,btrtalso abilities tQ
be
assessed. Inthisway.Bachrr)an
arguesthatthenotion ofconstruct-based approach totestingisalsonecessary fortestdevelopment, and mentions thatthemost importantthing
is
tointegrate
tasksand constmctin
thedesign and developmentofa particularassessment.Here,we notice thatthereisconsiderable validity inthe
integration
ofconstruct-basedtaskdevelopmentand taskimplementation
based
onthe
operation ofthe processingfactors and the infiuencesofthe
processingconditions. In other words, when we develop assessmerrt tasks,it
is
reasonable tosuppose thatwe should designthetaskon thebasisof construct definitionand processingperspectives.Thus,the so-called construct-basedprocessiilgapproach to testingresults in a comprehensive framework
for
our testdevelopment.The characteristic featuresof thisappreach are: 1)
it
must considerboth
constructs and tasksin developingperfbmiance assessment(Bachman,
2002);2)
procedures
fbr
design,
development
and use of languagetestsrnust incorporatebotha specification ofthe assessrnent tasks to be includedand definitionsof theabilitiestobe
assessed
(Alderson
etal.,
1995;
Ba(
hnian& Palmer,1996;Brown,1996);3)tasksshouldbe conceptualized as sets of characteristics
(Bachrnan,
2002),and taskcharacteristics should bedesigned
toconsider perfbrmanceon tasksinterms of the operation ef theprocessingfactorsand theinfluencesof theprocessingconditions
(Skehan,
1998);and 4) the processingfactorsthat
affect perfbrmancesuch as commmicative stress should be utilized inorder tocontrol processingconditions inwhich itinvolvesthe interactionof test-takerattributes.2.2
Construct
definition
The
constructs of our task-basedwriting testdevelopedfbr
thisstudy are assumed tobe
accuracy and communicability. Both constructs are derivedfromthe Bachman andPalmerframework
(1996)
and Skehan'sprocessingperspectiveon testing(1998).
Therule-based system
' Accuracy - Complexity
Organizationalknowledge ' Grammaticalknowledge ・ Textualknowledge
]Fligure
1.
Theconstruct structureofaccuracyAs shown inFigure
1,
accuracy shares therule-based system intermsofprocessingperspectives,and hasa deepconnection with organizational knowledgewhich consists of
grammaticaland textual
knowledge.
Grammaticalknowledge"is involvedinproducingor comprehending fbrmallyaccurate utterances or sentences," and textualknowledge"isinvolvedinproducingor comprehending textsthatconsists of two ormere utterances or sentences"
(Baciman
& Palmer, 1996,p.68),Based on these two areas of organizatienalknowledge,
it
is
proposedherethattheconstruct accuracty specialized fbrwriting would be comprised oforganlzational skillsand linguisticaccuracy. Specifically,organizational skills can bedefinedasthe
ability toorganize a logicalstructurewhich enables thecontent tobe accurately acquired, and linguisticaccuracy concerns errors of vocal]urary, spelling,punctuationorgrammar
(Sugita,
2009).Jilgure2,Theconstructstmctureofcommunicability
Figure2 indicatesthe construct structure of communicability. We realize thatthe construct shares
the
exemplar-based system interms of processingperspectives,and itsbasisispragrnaticknowledge,which consists of functionaland sociolinguistic knowledge.
Functionalknowledge"enables
us tointerpretrelationships betweenutterances or sentences and textsand the
intentions
of Ianguageusers"(Bachinan
& Palmer,1996, p.69).Socielinguisticknowledgeenables us tocreate orinterpretlanguagethat
is
appropriate toaparticularlanguageuse setting
(p.70),
Based on thesedefinitionsand theprocessingperspectives,the termcommunicability
is
defined
asfluency
specializedfor
writing, whichiscomprised of communicative qualityand effect Communicativequalityrefers tothe ability tocommunicate without causing
the
reader any dienculty,and cemmunicative effect concerns thequantityofideas
necessary todeveloptheresponse as well as therelevance ofthecontent tothe proposedtask
(Sugita,
2009). 2.3ProceduresfordeyelopingtheTBwr
Utilizinga construct-based processingapproach, the test
development
proceeded according tothefbllowingthreestages:Stage1:Designingand characterizing writing tasks
With regard to processingperspectives
(Skehan,
1998),content-based support andform-focused
stakes are necessary foraccuracy tasks.An elicitationtask(writing
a letter)was chosen, and specific topicsof selfiintroduction were given inthetask.A situation is supposed inwhich thestudent isgoingtostay with a
host
family
inBritain,and isadvisedto write a
letter,
so thatstudents can focuson writing accuracy,On
the other hand, cornmunicability tasks need form-orientedsupport and meaning-focused stakes inorder to write withafbcus
on meaning. A discussiontask was designedbecause
itencourages students to write theiropinions or ideasabout the topic,andit
lays
emphasis on a meaning-fbcused response(see
thespecifications inAppendix A).Accordingto Bachman and Palmer
(1996),
characteristics of theinput
arid the expected response ina testtask are ciosely concerned with the operation of theprocessingfactorsand influencesof
the
processingconditions fortaskimplementation.Inview of the construct-based processingapproach totesting,theTBWT needs todevelop
such task characteristicsinorder to adjust students toperforrnanceconditions inwhich theyallocatetheirattention inappropriate ways. Specifically,thecharacteristics of our accuracy task require students towrite a 1OO-120 word letterinadequate time inorder thatthe rule-based system can be accessed. and the characteristics of our communicability taskencourage students towrite as many answers toa discussiontopicaspossibleina very limitedtime in
order thatan exemplar-based system might
be
appropriate,Stage2:Reviewing existing scoring proceduresforassessing writing
In
theconstruction ofratingscalesespecially when resources arelimitedas isthecase of this study,it
seems meaningfu1 to selectively use well-developed and well-researched scales outside Japanas a reference. For thispurpose,existing scoring proceduresfor
assessing writing were considered inorder to explore what typesof proceduresare more suitable to construct rating scales. We examined and collected the descriptorsofthe
TOEFL Test of Written English
(TWE),
CambridgeFirstCertificateinEnglish(FCE),
ESL
CompositionProfile,NAEPScoring
Guide and Michigan WritingAssessmentaccording to thetargetcontext inwhich theTBWT isadministered. As a consequence,
the
TBWT
is
as construct-relevant as multiple traitscoring, and itsprocedureissimilar tocombined procedure,thetwo assessment tasksand
their
criteriaexistindependently,
andthusraters are required tomake only one decisionforevery script inthesame way they conduct
in
holisticscoring.Stage3:Draftingrating scales
The underlying competences served as a usefu1 basiswhen
developing
rating scalesfbraccuracy and communicability, The
descriptors
ofthernarking categories ineach scale were collected from existing writing assessments such as the TOEFL Testof WrittenEnglish
(TWE)
and CambridgeFirstCertificateinEnglish(FCE).
By conforming oneconstruct closely tothe definitionofits rating scale, itisfairtosay thatraters would use the scale appr6priately and consistently, ensuring the reliability and validity of thewriting assessment. AccordingtoAlderson et aL
(1995),
raters should understand theprinciplesbehindtheparticularrating scales
they
must workwith,
andbe
able tointerprettheirdescriptorsconsistently.Therefore,therating scales are comprised ofclearer descriptionsof each constmct and of5-pointLikertscales
(Appendix
B).Thedescriptors
ofeach category are alsoprovidedwith theselected witten samples as an explanatory partof the scale in orderthat
busy
school teacherswith limitedtraininginwriting perfbrmanceassessment could understand thedescriptorsand workwith
them
consistently.3
TheStudy3.1Purposes and research questions
Inorder to examine the degreeof reliabilityand validity of thetask-based writing
performancetest,the fbllowingare fbcusedon raters severity, biasinteractionsbetween writer abilityand task
difficulty,
thereliability ofelicitation tasksand rating scales and the measure'svalidity.Thespecificresearch questionsare as fbllows:
1
)
Isstudent abilityeffectivelymeasured?2)Areteacher-ratersequally severe?
3)How much dotasksthataredesignedto
be
equivalent actually differindithculty?4)How well doscales conform to expectations about theiruse? Do raters use al1partsof
them,and use them consistently?
5)Do individualraters show harshor lenientbiastowardsparticulargroupsof writers? If so,what are thesub-patterns of ratings interms of rater-student biasinteraction
for
each rater?6)Do theraters score one tasksmore harshlyor more lenientlythantheother? Ifso, what are thesub-patterns of ratings interrnsofrater-task biasinteractionfbreach rater?
7)To what extent, statistically, isthetask-based writing testa reliable and valid measure?
32 Procedure
The
data
fbrthisstudy were 40scripts(20
scripts foreach oftwo tasks)collected fromtwenty undergraduate students inthe firstsemester of2008. Eachofthe scripts was scored
by fiveraters, who were all experienced Japanese
junior
high
school teachersofEnglish.
qualificationsoften ormore yearsofteaching experience. The TBWI' scoring guidewas edited
fbr
thistesting.Thefirst
sectionis
thebackground
ofthe TBWT. The second sectionistheexplanation of assessment tasks.Thethirdsection
is
theimplementation
method ofthe testing.TIhe
fburth
sectionis
comprised ofthe
rating scales and written samples accompanied bydetailedcommentary on each sample at fivelevels,1-5.Bothscriptsand thescoring guidewere giventotheraters byrnail atthebegimingofAugust, 2008.Each
ofthefiveraters rated theentire set of fortyscripts and sent thembackbytheend of Augusg
2008.They were
instructed
torate the20
scriptsofTask
1 firstand thentorate the20scripts of Task 2.Finally,
they
were asked to rate each of the participants'writingproficiencybasedon theiroverall impressionat
five
levels,
1-5.A questionnaireabout the scoring guidewasalso
enclosed and sent backwith thematerials.33 Dataanalysis
Table1,2and 3show thedescriptivestatistics
for
thescores ofthe
two testtasksandtheoveral1 impression.Table4 summarizes theinter-ratercorrelation coethcients fbrthe
differentscoring. Sincetheaverage of
the
coeMcientsfor
each scoring isrelativelyhigh(O.78,
O.77,O.79),thefive
ratersappear tobe
ofacceptable reliability.Table1Descriptivestatistics forTaskl
Raterl Rater2 Rater3 Rater4 Rater5
MeanSDMinimum
Maximum
3.20O.922.05.03.35l.102.e5.03.001.14l.O5.03.00O.702.04.03,25O.882.05.0
Table2Descriptivestatistics
for
Task2Rater1 Rater2 Rater3 Rater4 Rater5
MeanSDMmimum
Maximum
3251.081.05aO3.20O.922.05.02.801.241.05.03.201.161.05.03.55O.972.05.0
Table
3
Descriptive
statisticsfbr
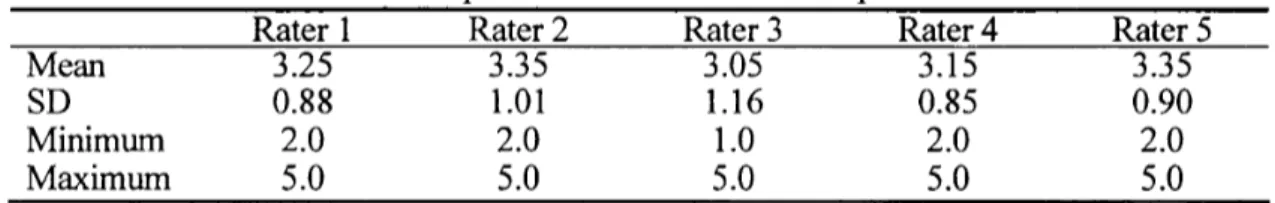
overallimpression
Rater1 Rater2 Rater3 Rater4 Rater5
MeanSDMinimum
Maximum
3.25O.882.05.03.351.012.05.03.051.161.05.0
3.15O.852aO5.0
3.35O.902.05.0Table4Inter-ratercorrelation coefficients
between
pairsofraters 12 1!3IM 1/52/32!42153!43154!5Av.Tl .75.85.68.78,87.76.82,8019.71.78
T2 .84.91.66.86.81.70.70,71,83,74.77
OI .79.8].67.88,92.80,78,80,78,64.79
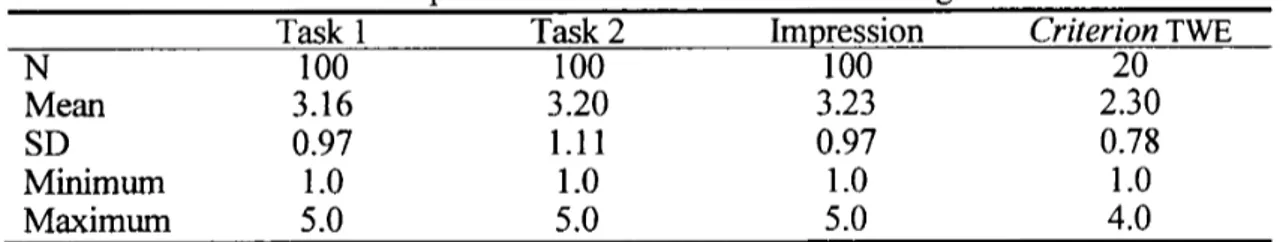
Table
5
reports resultsfbr
each testtask,theoverall impressionand thescores ofC7iterion,
including
its
meaii and standarddeviation.
In
thetesting,twenty students were requested tosubmit an essay using aiterionin
order todiscuss
thecriterion-related validitybyexamining theirscores and those
with
ahigh
reliability proyidedby
Criterion.
Themean scores forthetesttasksand theoveral1 impressionare very close, ranging from3.16to3.23.The alpha coethcients fbrthethree variables were calculated.
Using
Davies'
cut-off(.90)
asan acceptablelevel
ofintemalconsistency on a high-stakestest,each Cronbach'sct would meet thepoint:.9434,.9432 and .9480 forTask 1,Task2and overallimpression,
respectively.Table5Descriptivestatisticsofthe differentscoring
Task1 Task2 Im ression eiterionTWE
NMeanSDMinimum
Maximum
IOO3.16O.971.05.0
1OO3.201.ll1.05.01OO3.23O.971.05.0202.30O.781.04,OTable6Pearson¢orrelation coethcients
Taskl Task2 lm ression
Task2Impression oriterion
.797**.924**.710**
.884**.678**
.734** IVbte.**all correlations significant atO.Ol]evel
As seen inTable6,
the
correlation coethcientsbetween
each taskand theoveral1impressionfallina range of .797 to.924,which are al1significant at theO.Ollevel.The correlatien
between
thetwo testtasks(.797)
is,however,slightly lowerthantheestablished estimate ofreliability(,80).
Table
6
also shows thatthetwo tasksand overall impression correlate positivelywith the scores of C7iterion(p<.Ol).
Such correlation givesa criterion-related validity evidence as tothe threescores of each raterand the eiterionscore.
The
highestcorrelation isforaiterioniswith Impression(r=.734),
followed
by
Task 1
(r=.710)
andfinally,
Task2(rT.678).
Sincetheindicatorsofeffect size are morethanO.5,
indicating
largeefTect(Cohen,
l988),thetesttasksaredeterminedtobe
valid.
Test
data
are influencedby errors of measurement resulting fromvariationin
raterharshnessand testtasks,as well as bythenature ofthe ratingscaleused and bythe range of ability ofthe students who are beingassessed. Therefbre,
it
was necessaiy touse statistical models which takeintoaccount allof thefactorsthatmight affect a student's finalscore.The
analyses fbrthepresentstudy were doneusing FACETS, version3.63
(Linacre,
2008).To examine
the
measurement characteristics of thistesting,the datawere specified ashavingthree
facets,
namely, theabilityofstudents, thedithcultyoftasks and theseverity of raters. The partial-creditmodel was chosenbecause
thescoring criteria fortherating scales were qualitativelydifferent.Thisanalysis also ofTersa kindof analysis thatdetectsbiasedcertain
types
ofstudents or tasks,theresults ofa biasanalysiswi11
be
presented. 4Results4.1
FACETS
summaryIMeasurel-Ratersl+Studentsl+Tasks
lS,1IS,21S,3l +1+ 7+ +9 +1
f
6+ + 5+ +l+l+l+[l1+ +1+1+ +1+1+ 4+ 3+ 2 1 o +1+1' -1+1-2 +1-3 +l-4 + -5 -6 +L+ -1 + 34125 +1 ,,+ +1+l+]+'* + +1+I,i+1+ + 612 147131921 101715s3 20 16 5 411 +1+ +t+ +1+1* Aecuracv + +E+1+1+l+ + Communicabilitylmpression + (5)+ (5)+ (5)+l"--
.--I ++++11
+4+L+1+1+1,* + + +1+ +l+ +--+ +l+1+1+1*+41 + --- + 4 +,1, * +-'-i .1
+1,
+2+t--.+ + +l+1+ +r+ + +1+E+l+1* ,"-l +1
+1
+2+l+ + (1)+ (1)+ (t)+ IMea$urel-Ratersi+Studentsl+Tasks [S,1lS.2iS.31 FVgurel FACETSsunmiaryFigure
1
shows a sumrnary of allfacets
andtheir
elements. They arepositioned
on a commonlogit
scale,which appears as "measure" inthefirstcolumn. The second column shows theseverity variation among raters.The most severe rater(ID:
3)
isat thetop,andthe
least
severe rater(ID:
5)isatthebottom.The thirdeolumn shows the ability variationamong the20 students. The student isranked withhighability at the top
(ID:
9)
andlow
ability atthe bottom(ID:
11).'Iliefourthcolumn shows equivalence of the dificulty yariation among tasks.The lastthreecolumns graphicallydescribethethreeratingscales.Themost likelyscale score fbreach ability tevelisshown. Forexample, the student whose ability estimate is+1.0 logiton thelogitscale
(ID:
19)islikelytoget3
pointson each task and the overaIl impressionwhen thestudent isassessed byan average-severity rater.4.2FACETS analysis
l,}
lsstudent abiiityofectively
measured2As shown
in
Figure1,student ability estimates range firorna highof6.96 logitsto alowof -6.27 logits,indicatinga spread of 13logitsinterrnsof students' ability.
Student
separation value was 6.54,rneaning thatpopulationsIikethesestudents inthisstudy can be spread intoabout seven levels.The reliability indexwas .98,whichdemonstrates
the
possibiiitytoachieve reliableabilityscores.
ZJ
Areteacher-ratens equally severe .2Table
7
FACETS
analysis ofrater characteristicsFair-Mavera
e
Severity
loits Error Infits uare
(mean
Rater1Rater
2Rater
3Rater 4Rater 5 3,173252.903.063.34-1,07-1.35 .09 -.59-l.70 .27,2726.2627 ,63 .90 .911.25 .96 MeanSD 3.14 ,15 -,92.62 .26.oo .93.20]Vbte.Reliabilityofseparation index=.82;fixed(al]sarne)chi-square: 27.8,df:4;significance: p=.OO
Table 7 providesinformationon the characteristics of raters. From the left,each column shows rater IDs,fairaverage scores, rater severity, error and fitmean square value.
The second column indicatesthat the severity span betweenthemost severe rater and the most lenientrater was l.79and thedifflrence, basedon falraverage scores inthefirst celumn, isO,44of one grade inthescale. The reliability of theseparation index
(which
indicatesthe likelihoodof which raters consistently difTerfrom one another inoverall severity) was high
(.82).
The chi-square of 27.8with 4 dfwas significant atp<.OO and, therefore,thenull hypothesisthatallraters were equally severe must berejected, Therewas a significant diflerenceinseverity among raters. On theother hand,thelnfitMean Square column indicatesthatno raters were identifiedas misfitting: fitvalues foral1raters were within therange oftwo standard deviationsaround themean(O.93
±[O.20
×2]).Inother words, allraters behavedconsistently inthescoring,sp
Hbw much dotcxsksthatare designedtobe
equivalent actually cb;0Zirindy/77culty2
Table8Descriptivestatistics on thedifferentscoring
DiMculty
(logits)
ErrorInfit(meansquare) DiscriminationEstimateofTask1Task 2Impression MeanSD -.08-.07 .16 .oo.11 .21.1921.21.Ol.961.04,77.92.121.041.00124
IVbte,Reliabilityofseparation index=.OO;fixed
(all
same) chi-square: O.9,dft2;significance: p=,65[[heanalysis of the two testtasksand overall impressioninTable8 shews thatno sigriificant variation
in
dithcultyexists among them. Ratersare considered tobe
self:-consistent
in
scoring andthe
tasksdo
not appear to separate thestudents toa sigriificant degree,meaning thatthe
diMculty
ofthe
twotasksandthe
over impressionare equivalent.An
estimate of the itemdiscrirninationwas computed according tothe
"Generalized PartialCreditModel"
approach.
1.0
is
the
expected value, butdiscriminationsin
the
rangeO.5
to1.5provide
areasonablefit
tothe
Raschmodel(Linacre,
2oo7:132).D
How
well doscales conjbrm toexpectations abouttheir
use2Do
ratens use allpartsof
them,ancitase
them
consistently2Table9Ratingscale statisdcs
for
AccuracyCategory
score
Average
Measure Oudit(means uarestepDifficul 12345 -626-324 583.766.16 .4.91.1.81.6 -7.07-1.422.286.22 -9.0ll -6.0 -3.0 o.o 3.0 6.0 9.0 ++---+---+---+---+---+---++ 111Plrlobabi1ityl 2 22 o 11 22 1 2 12 *21 22 11 222 11 22 11 222222 11 3333.*11 22 333 22 33 223 .332 3 2 33 2' 2 444 3333 2 33 24444224 3 44 222 3443434344 4444 44 33 3 33 5*S55555 4 5 4 5 3333 45 5 4 *54 5 4 5 4 5 4 5 4 5 4 555 444 5 4 ++---+---+---+---+---+---++ -9.0 -6.0 -3.0 O.O 3.0 6.0 9.0 ]Fifgne2
ProbabilityCurvesforAccuracy
1"**************##*****-l***#*****i****-*l*"********"*****#*#**
Linacre
(2002)
has
proposed
guidelinesfora rating scale:(1)
average category measures should advancemonotonicallyby
category,(2)
oudit mean-spuaresshould
be
less
than
2.0,
and(3)
thestep difficultyofeach seale should advanceby
atleast
1.4
logits
andby
no morethan
5.0logits.Tal)le9
sbowsthe
rating scale statisticsfor
accuracy.The
average category measures risemonotonically as expected by category. All outfit mean-equares are lessthan2.0,meaning thateach ef thefivecategorieshas
expected randomnessin
choosing categories. However,the
increase
in
step difficultiesbetween2 and 3 is5.56,which doesnot meet(3).
Figure2
presents
the
scale structure probal)ility curves, whichvisually
demonstrate
thefrequencysigrialsof each observed scale. Inthishilltopsare observed. Accordingto
Tyndall
and Kenyon(1995),
theobvious peaksand thedivision
between
thescales indicatethatthescales work asintended.
Thedivisionbetweenthescales isclear,
but
theprobabilityand therange ofscale 2indicate
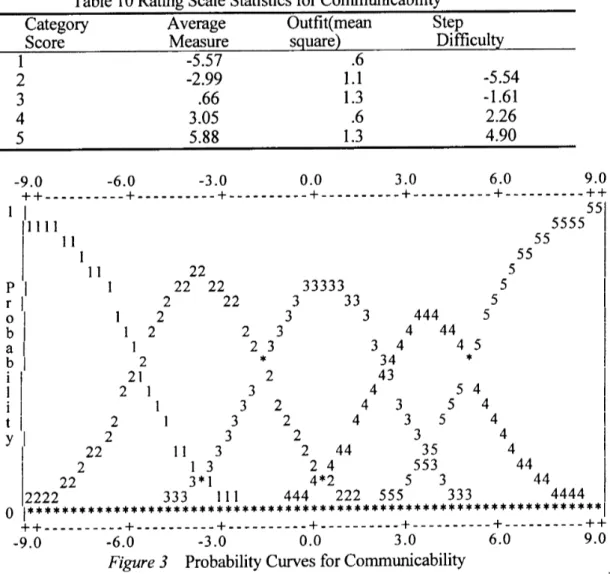
that thescale does not work as intended.Table1ORatingScaleStatisticsforCornmunicability Category
Score
AverageMeasureOutfit(mean
s uareStepDirncul 12345 -5.57-2.99 .663.055.88 .61.11.3.61.3 -5.54-1.612.264.90 -9.011
Plll
Probabi1ity -6.0 -3.0 o.o 3.0 6.0 9.0 ++---+---+---+---+---+---++l]
l'11l11
1
ll 22 1 2 11 22 11 22 121 22121 2 1 2 1 2222 22 11133*13 22 33 2 3 23 3 *2 3 2 3 2 3 2 33333 2244*2 33 444 3 4 34 434433 4 3 5 444 3 35553 44 5 3 5 45 * 54 5 4 5 4 5 4 5 4 55 44 55 44 5555551
l
2222 333 111 444 222 555 333 4444oe.**..*.*i*-*i*-*-'.*-*i*i*.*-:rt;*-*-r*"trrri*.*rrr.*fi*f-*i.*r-*i*.*-*-*-*.t*.*.*H*x*.*.r*.rr.**.1 -9.0 -6.0 -3.0 O,O 3.0 6.0 9.0 ]FVgtire3 ProbabilityCurvesfbrCommunicability
Table
1O
shows therating scale statisticsforcommunicability. Alloutfit mean-squares arelessthan
2.0,which meet(2).
Allstepdiencultyincreasesfal1
within 1.4and 5.0,whichdoesmeet
(3).
In
Figure3,thestepdithculties
increasemonotonically withratingscale numbers and obvious hi11topsareobserved.
Table
11RatingScaleStatisticsfbrOveral1ImpressionCategory
Score Average Measure Outfit(mean s uareStepDithcul
12345 -6.02-3.57 .763.656.61 .4.6.6.91,O -6.81-l.66223623-9.0 -6.0 -3,O O.O 3.0 6.0 9.0 ++---"+r"--"---+---++---H--h-+----"-rr-r+---ff---++ IL Probabiilty
E[1
]l
111112l
11 22 1 2 l1 22 1 2 12 *21 22 11 2 l 22 l 222222 11ll33 22 33 333111 3 22 33 2 3 23 *32 3 2 33 22 333 33 2 444244*24 33 44 222 3 4 34 4 *3 4 3 4 3 4 3 4444 44 33 S555 44 5 5 5 5** 3333 4 5 45 *54 5 4 5 4 5 4 5 4 5 551551
444441
ttl]
o1*******************************************************************
++----"-H-"-+-"---J----+F-fi-+---+---+---"n+-"---M-++ -9.0 -6.0 -3.0 O.O 3.0 6.0 9,O jF}gure4 ProbabilityCurvesforOverallImpressionTal)le11 shows
the
rating scale statisticsfor
impression.
Averagemeasures rise monotonically with each category. Alloutfitmean-squares are lessthan 2.0.Allstepdithculty
increases
fallwithin1.4and 5.0,whichdoes
meet(3).
InFigure4,thestepdienculties
increase
monotonically with rating scale numbers, and obvious hi11tops are observed. Whilethecategory 2of theaccuracy sealewas slightly 1argerthanexpected,the
rating scalesfor
commmieability and overall impressionconfbrmed toexpectationsal)out
itsuse. Insum, thesemodified 5-pointscales could be a reliable toolfornovice raters
in
determining
the
estimate ofstudents' writing ability.sp
Do individualraters show harshorlenient
bias
towards particulargroupsofwriters2
Zf
so,what are thesub-patternsofratings
intermsofrateJ"-student
biasinteractionforeach rater2Sincetherater-student
interactions
where z-score values fallbelow-2.0or abeve2.0 means a significantbias,therewere a totalof ninesigriificarrtlybiased
interactions
among ailraters. Tables12-16show theresults of thebiasanalysis intermsofintera
¢tionbetvveenraterseverity and student ability.In column 9,the
infit
mean square value shows how eonsistent thebiaspattern
is
for
the
rater toevaluate thestudent's abilityacross all the scoring. Inthiscase, themean ofthe
infit
mean square value was O.4and itsstandarddeviationwas O.5.Thus
fit
values above1.4
logits
suggest misfit(O.4+[O.5
×2]).As shownin
Table
13,one(student
10 × Rater2)wasidentified
as misfitting(its
infitmean squarevalue was above 1.4logits).The mean-square fitstatistics report on
how
much misfitthere
is
in
the
dataafter thebiasisremeved(Linacre,
2002).[Fherefbre,itwould beTable12Biascalibration report: rater-student
interaction
forRater1StudentAbility(logits)Observed score
Expected Obs-Exp Bias
score Average (togits)Errorz-scoreInfitMeans
uare
1 O.18 12 9.7
O.78
2,71 1.12 2.41 o.oTable
13
Bias
calibration report: rater-student interactionfor
Rater2
StudentAbility(logits)Observed
score
Expected Obs-Exp Bias
score Average
(]ogits)Errorz-scofeInfitMeans
uare
17 -O.07 12 9.7 O.77 2.68 1.12 2.39 o,o
10 O.18 12 9.9 0.70 2.43 1.12 2.l6 3,O*
12
3.75
ll 12.9 -O.63 -2.321.05-221 O.8Nbte.'= misfitting
Table14Biascalibration report: rater-studentinteractionfbrRater3 StudentAbility(]ogits)Observed
score
Expected Obs-Exp Bias
score Average (]ogits)Errorz-scoreInfitMeans uare
6 4.00 14 12.0 O.68 2,65 124 2.14 O.8
Table15 Biascalibration report: rater-studentinteractionfbrRater4
StudentAbility(legits)Observed score
Expected Obs-Exp Bias
score Average (togits)Errorz-scoreInfitMeans
uare
97
6.962,28
139 14.5ILI -O.51-e.69-2.32-2.521.121.20 -2.06-2.10O.4o.o1 O.18
6
93 -1.10 -4.68 1.45 -3.23 o,oTable16Biasca]ibration report: rater-student interactionforRater5 StudenttAbMty(logits)Observed
score
Expected Obs-Exp Bias
score Average
(]ogits)Errorz-scoreInfitMeans
uare
11 -627 7 5.7 O.44 2.36 1.15 2.05 1.0
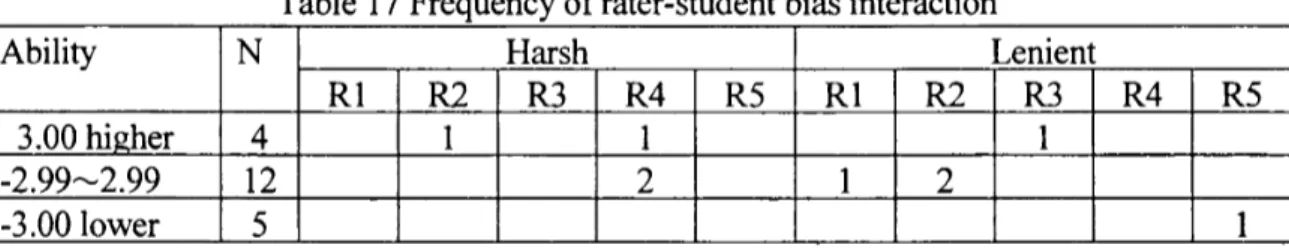
Table17 summarizes the frequenciesof rater-student interactionsthatdisplayeda sigriificant
bias
foreach rater at various levelsof the ability range. Thefirst
colunm showstheability estimate range, and
the
second column shows thenumber ofstudents withintheparticularrange of abilityestimate. Intherange of3.00 or
higher,
therewere fourstudents.Rater2and 4 harshlyscored one student fbreach, and Rater3lenientlyscored one student.
The
totalnumber of rater-studentbias
interaction
was three,which was 759t6of thetota1 number ofstudents within thisrange(3!4=O.75).
Therewere twelvestudents whose ability estirnatewasbetween
-2.99and 2.99.Rater4harshly
scored two students. Rater1leniently scored one student, and 2lenientlyscored two students.Thetotalnumber of rater-studentbiasinteractionswas five,which was 42% of thetota1number ofstudents withinthisrange
scored ene student.
This
is
theonly one-rater-studentbias
interaction,
which was 20% ofthe
totalnumber ofstudentswithin
this
range(1!5=O.20>.
Table17Frequencyofrater-student biasinteraction
Ability N Harsh Lenient
RlurR3R4R5Rlm asR4R5
3.00hier4 1 1 1
-2.99--2.99 12 2 1 2
-3,OOIower 5 1
Tables12-16alsoindicatethateach rater hadthefbllowingunique rater-student
bias
pattern.'Rater
1:Therewas a more lenientlyscored student than expected fbrRater 1.The lenientlyscored student was ofmiddle range ability
(between
-2.99and 2.99).' Rater2:Therewere bothmore harshlyand lenientlyscored students than expected
fbr
Rater2.The harshlyscored student was a highability student
(3.00
or higher)and thelenientlyscored students were ofmiddle range ability.
'Rater3:As inthecase of Rater1,therewas a more lenientlyscored student thanexpected
fbrRater3.UnlikeRater1,thelenientlyscored student was one with highability.
'Rater4:Therewere more harshlyscored students than expected forRater4.Theharshly
scored students includedone student withhighability and two students with middle
range ability.
' Rater5:As inthecase ofRater
1
and Rater3,therewas a more lenientlyscored studentthan expected forRater5.
Unlike
the
two raters,the lenientlyscored student hadlowability.
6)
Do theraters score one tasksmore hat:shlyor more lenientlythan the other.7ifso.
what are thesub-patternsofratings
intermsofrater-task
biasinteractionforeach rater2Table18 Biascalibrationreport:rater-task interaction RaterTasks Observed Expected Obs-Exp Bias Error
score score Ayerage (logits)
z-score Infit Mean s uare 524332ll4I55423Communicability AccuracyCoTnmunicabMty AccuracyImpressionImpressionCorTununieability AccuracyImpressionImpressionIrnpressienAccuracyAecuraeyCorrmiunicability Communicab"i
71676460616765646365676560645668.065.162.258.559.966.464.763.863.065.268.066.661.766.258.6O.15O.10O.09O.07O.05O.03O.OlO.Olo.oo-O.Ol-O,05-O.08-O.08-O.11-O.13O.57O.43O.34O.32O.23O.13O.05O.04-O.Ol-O.04-022-O.36-O.36-O.41-O.49O.44O.47O.43O.47O.47O.47O.44O.47O.47O.47O.47O.47O.47O.43O.441.31O.92O.79O.68O.49027O.12O.08-O.Ol-O.09-O.46-O.76-O.78-O.95-1.12O.91.31.7*O.7O.9O.6O.6O.71.0O.6O.81.1O.8O.71.0
Table
18
showsthe
results ofthe
bias
analysisin
terrnsofthe
interaction
between
ratersand tasks.Itlistsal1rater-taskinteractions
(5
raters×3tasks).Incolumn 8,thereis neither a z-scorebelow
-2.0 nor greaterthan
+2.0 suggestingthat
no rater shows significantly biasedrater-task interactions.Incolumn 9,thernean ef theinfitmean square value wasO.9,
andits
standarddeviation
was O.3.Thus,fit
values above 1.5logits
suggestmisfit
(e.9+[O.3
X2]).TIhevalue byRater4on `communicability'was l.7,which indicates
that
Rater
4did
not consistentlyevaluate thetaskin
the
identified
patternsofbias
acrossal1
students.
D
7b
what exten4 stotisticalZJ4isthe
task-basedwriting testareliableand validmeasure ,?(1)
Reliabilityin the firstanalysis・
(Tal)te
7)the dataset was -analyzedusing FACETS. [Ihetableprovidedinfbrmationon
the
characteristicsof raters(seyerity
and consistency). Allratersdisplayedacceptable levelsof selficonsistency. This can be seen from the InfitMean
Square
column,by
adding two standarddeviatiens
tothemean. Ratersfalling
within
theseparametersintheirreported
Infit
Mean
Square
illdices
are considered tohave
behayed
consistently. On theother hand,theseparation and reliability figuresindicatethatthere were significani differencesameng raters interms of severity. However,thedifference,based
onfair
average scores,is
O.44of one gradeinthescale,suggesting thattherewouldbeno impacton scores awarded inan operational setting.Theanalysis of thetwo tasksand
the
overallimpression
in
Table8 show thatno significant differenceoccurs betweenthetasksand theimpression.'lheadjacent scale levelon thetwo tasksmay indicatethatthe
tasks
do
not appear toseparate thestudents toasignificantdegree.(2)
ValiditylnTable8,an estimate of theitemdiscriminationwas computed according tothe
"Generalized PartialCreditModel"
approach. I.O
is
theexpected value,butdiscriminations
intherange of O.5to 1.5providea reasonal)le fitto theRaschmodel
(Linacre,
2007,p.132).Ailtheestimates
fall
in
this
range(1.04,
1.00,1.24),whichindicates
thatthe randomness inthreesets ofdata
fit
the
Rasch model. The two tasksandthe
overal1impressionwere, therefbre,of relevance to
dependent
dataacquisition.There
is
also a criterion-related validity evidence as tothe
three
scores of each raterand the&iterion score. Table19 shows theresulting correlation coecacients fortherelationshipbetween
each of threeraters' scores and theCV'iterionscore,and theywere statisticallysignlficantCp<.O1)
forTask1,Task2and overall irnpression.The substantial correlations demonstratethatthetask-basedwTiting perfbrrnanceisrelated tolearnerperfbrmanceon
(>-iterion,
a widely-used writing instructionaltools,and thusresult insupporting itsvalidity.Table
l9
Inter-rater
correlationcoethcientsbetween
raters'scoresandtheeiterion
scoreRater1
Rater2 Rater3 Rater4 Rater5Av .Tl.67 .74 .78 .72 .68 .72
T2.79 .67 .67 .64 .70 .70
OI.68 .75 .81 .68 .76 .74
5Discussion
5.1Summary ofthe analyses
The five
junier
highschool teachersinthisstudy were all novice raters inthis task-based writing assessment. Theinterratercorrelationcoethcients betweenpairsofraters were relativelyhigh,
and thefive
raters appeared to be of acceptable reliability.TheFACETS arialysisshowed thattheratersdisplayedacceptable levelsof selficonsistency,
Therewere, hewever,significant differencesbetweenraters interms of severity, Thebias analyses indicatedthat
al1
raterswere significantlybiased
towards certaintypesofstudents, and theirbiaspatternswere unique. Moreover, itmust be said that one rater-studentinteractionand one rater-task interactionwere identifiedas misfitting,so theseraterswere not consistent intheidentifiedpatternsof biasacross the students or tasks.The FACETS
analysis alsoshowed thattherewas no sigr)ificantly differentscoring among
the
two tasksand theoverall impression.The adjacent scale
level
on thetwo tasksmayindicate
thatthe testtasksdidnot separate thestudents to a sigriificantdegree
and thusthetesttasksare roughiy equivalent indiMcultywhenlearner
responses tothetwo taskswere scored based on the accuracy and commmicability scales.Since
the 5-pointscalesdernonstrated
acceptable fit,the five¢ategories and theirspecific written samp]es were mostly comprehensible and usable byraters. Therefore,itisquitelikelythatthe assessment tasksand rating scaleswere reliableindeterminingan estimate ofstudents' writing ability.
52 Implications
The findingsofthis study suggest thattheTBWT scoring guidemay
have
eflectivelygivennovice ratersashared understanding ofthe construct ofwriting ability
defined
bythe testwriter and may havecontributed totheconsistency inscoring aridthereduction inthebiasedinteractionswith tasks.Itis,therefore,reasonable tosuppose thattheTBWT scoring
guidemay possiblyreduce thedifferencesor biasescaused byvariation among raters. In order toconfirrri this,a questionnairewas also administered tothefiveteacher-ratersinthis study bymail. Itwas designedtobecompleted inashorttime.Most of thequestionswere of themultiple choice variety. The lastquestioninvitedcomments and opinions on the whole guidebook.
Question
lthrough3
were answered on a 3-pointscale from1(No,
not usefu1) to 3(Yes,
very usefu1).Questions
4 through 9were answered on 4-pointscale from1
(Strongly
disagree)to4(Strongly
agree).As shown inTables20 and 21,the results of thequestionnaireshow thatthefive
teacher-ratersfeltthattheTBWT scoring guidewas fairlyusefu1. Accordingto the
FACETS analysis,thecategory 2ofthe accuracy scale was slightlyiargerthanexpected. In other words, with increasingmeasure, the category 2 ismost
likely
to beobserved for accuracy scoring among thefivenovice raters.Thismay beinagreement withtheresultthatnovice raters tendto
become
mere severe than experienced raters as some previous studieshave
shown(Ruth
and Murphy,1998;Weigle,1994,1998).Whereas thereseems tobe an admission of improvementinthescale,thequestioimairesurvey
indicated
thatthefivecategories and theirspecific written samples were mostly comprehensible and usable
guidelinesare supposed to leadthe raters to selgconsistency and reduction of biased
interactions
with tasks.Therefore,itisquitelikelythattheTBWT scoimg guidehaye
effectively
given
novice raters a shared understanding ofthe construct ofwriting ability andhave contributed totheconsistency indeteminingan estimate ofstudents' writing ability
Table20Resultsofscaling in
Questionnaire
(Q.
1-3)Questions
Veryuseful usefijtl Notusefu11.Istheintroductionuseful? 2400/e 36oe/, o
2.Isthetaskexlanationuseful? 5looo/, o o
3.Isthescorinrocedureusefu1? slooo/,
o
o
Table21Resultsofscaiing in
Questionnaire
(Q.
4-9)uestlons StronglyeeAgree DisagreeStronglydisee
4.Thedefinitionofaccuracyis understandable 2(4oof.)3(6oo/,)o o 5.IIheaccuracyscaleiseasytoevaluate.1(200/e)3(6oo/,)1(200/e)o
6.Thesamplesforaccuracyareuseful.3(60e/e)2(4oo/.)o
o 7.Thedefinitionofcomunicabilityis understandable. 2(400/e)2(4oo/,)1(2oe/,)o 8.Thecommunicabilityscaleiseasyto evaluate. 1(2oo/,)4(soe/.)e o 9.Thesarnplesforcomunicabilityare uefu1. 2(4oo/,)3(6oo/,)o oThispresentstudy, however,indicatesthat there were significant
biased
interactions
with students' abilityarnong al1fiveraters. Each rater wasfound
tebe
selfLconsistentin scoring 20 studenis' writing performances,butall of the raters hada uniquebias
pattemtoward a certain typeofstudent. [IIhesefindingssuggest thattheTBWT scoring guidemay
have
contributed tothe
reduction of biasedinteractions,buttrainingforcertain raters withhislherunique
bias
patternsmight stillbe required. On thispoint,Schaefer(2008),
for
example, states that therating processisso complex and error-prone that intentionalandprogrammatictraining
ibr
ratingis
necessary.Moreover,one rater-student interactionand one rater-task interactionwere identified as misfitting, so
these
raterswere not consistent intheidentifiedpatternsofbias across the students or tasks.Asfbr
the
rater-studentinteraction,Rater2 commented thatitwas not easy fbrhertounderstand thediffbrences
between
"fewerrors" and "occasienal errors" in
thedescriptorofaccuracy scale.For.therater-task interaction,Rater4 commented on the
introductionofthe scoring gujde
that
theconfbmity betweenthetask and itsunderlying constructisi
not easy teunderstand, and a detailedexplanation isnecessary.In
association with thi$.cgmment, she disagrgedin
the questionnairethat
thedefinition
of communicability is understandable, and describedthat she rated the task'for
communicability mostly depe.ndingon gralp.ipar and vocabulary. Althoughsuch a unique response patternseems to reflect
individual
rater idiosyncrasies,thesefindings
would bebeneficialinimprovingour understanding of raterbehaviorand inprovidingmore focused
directioninrater training.As Eckes
(2008)
points
out, theconsistency with which each rater uses particularscoring criteria should beexamined more precisely.Forthispurpose, research viewed froma rater cognition perspectiveduringevaluation of written samples mustbe
conductedhereafter.
6Conclusion
The resultsof thefivenovice ratersinthisstudy indicatedthatal1ratersdisplayed acceptable levelsofselfconsistency, and
that
thestudents' abilitywas effectivelymeasured using these tasksand rating scales. Ihe FACETS analysis showed thattherewas no significantlydifferentscoring on thetwo tasksand overal1impression,
which provided reasonable fittotheRaschmodel. The questionnairesurvey also indicatedthatthefive categories and theirspecific written samples were mostly comprehensible and usable by raters, and the5-pointscales demonstratedacceptabSe fit.Thisisbecausethe TBwr scoring guidehasgivennovice raters a shared understanding of theconstruct of writing ability, and hascontributed tetheconsistency inscoring. Therefore,itisquitelikelythatthe assessment tasksand rating scales were reliable indeterrniningan estimate of students' writing ability.
There
were,however,
relatively smal1but
significantdifferences
betweenraters interrnsofseverity. Eachrater was
fbund
tobe
selgconsistentin
scoring,but
the
bias
analyses of thisstudy alsoindicated
al1
ofthe
five
raterswere significantlybiasedtowards certain types of students. These findingssuggest that theTBwr scoring guidemay have contributed tothe reduction ofbiasedinteractions,
but
trainingforcertain raters with hislhermique biaspatternsmight stillbe required. Moreover, the consistency withwhich each rater uses particuiarscoring criteria should
be
examined rnore precisely.Forthispurpose, research viewed froma rater cognition perspectiveduring
evaluation of written samples must beconducted. Theseissueswi11beexamined ina subsequent study.Acknowledgement
The presentresearch was supported inpartbya Grant-in-Aidfbr
Scientific
Research
for
201O-2012(No.
22520572)fromtheJapanSocietyforthePrornotionof Science.Iamgratefu1toanonymous JLTA reviewers forsuggestions inrevising thearticle.
References
Alderson,J.C.,Clapham, C. and Wal1,D.
(1995).
Language test construction andevaluation. Carnbridge:CambridgeUniversityPress.
Bachinan,L.F.and Palmer,A.S.
(1996).
Language testing inpractice:clesigning anddevelopingusefiil languagetests.Oxford:Oxford
University
Press.
BachJnan,L.F.
(2002).
Some reflections on task-basedlanguage
perfbrmanceassessment.Language7;7sting19,453-76.
Brown,J.D.
(1996).
7lestinginlanguageprograms.UpperSaddleRiver,NJ:PrenticeHallCohen,J.
(1988).
Slatisticalpower
anaL)nsisfor the behavioralscience.(2"d
ed.),Hillasdale, NL: LawrenceErlbaumAssociates.Davies,
A.(1990).
A Principlesoflanguage
testing.BasilBlackwelJ.Eckes,T.
(2008).
Rater
types in writing perfbrmanceassessments: A classificationapproach toratervariability.Langunge71esting25,155-85.
Linacre,J.
(2002).
Guidelinesfbrrating scales. Mesa ResearchNote 2(Online).
AvaiIableathttp:llwww.rasch.orgtrn2.htm
(accessed
18March2008).Linacre,J.
(2007).
Ab(ser
'sguidetoE4CE7S: Rasch-modelcomputerprogram .
Chicago,
IL:MESA Press.
Linacre,J.
(2008).
Ibcets,version no. 3.63.Computerprogram.Chicago,IL:MESA Press.Ruth,
L.,& Murphy, S.(1988).
Designingwriting tasksfor
the assessmentof
writing.Norwood,NJ:Ablex
Publishing
Corp.Schaefer,E.
(2008).
Raterbiaspattemin
anEFL
writing assessment of writing. Language7;esting,25,465-93.
Skehan,P.
(1998).
A cognitive approachtolanguagelearning.
OxfbrdUniversityPress.Sugita
Y.
(2009).
Thedevelopmentand implementationoftask-based writing perfbrrnanceassessment fbrJapanese
learners
of English.JburnalofPan-Pacijic
Associationof
Applied
Linguistics13(2),77-103.Tyndall,B.,
&
Kenyon,
D.M.(1995).
Validationofa newholistic
rating scale using Raschmultifaceted analysis. InA.
Curnming
& Berwick(Eds.),
Ubliclationinlanguqgetesting
(pp.
39-57),
Clevedon,
England:MultilingualMatters.Weigle,
S.
(1994).
Effectsof trainingon raters of ESL compositions. Latzguage7lesting11, 197-223.Weigle,S.
(l998).
UsingFACETS to model rater trainingeffects. Language 7lesting15,263-87.
Appendix A:Assessmenttasksfortesting
1. Task1(aecuracy)
' Rubric:This
is
a testof yourability to write a coherent and grammaticallyparagraph.You wi11have20minutes tocornplete thetest.
' Prompt:You are goingtostay with theParlcerFamily
in
Britainthissummer.
100-120
word letterintroducingyourselftoyourhostfamily.Beforewriting,the fbllowingtopics: m Yournarne and age
- Yourjoband major inschool
-Your farnilyand pet
-Your interestsand hobbies
-Your favorite
places,
fbods
and activities-Your experience travelingabroad
- Some things youwant to
do
while youare inBritaincorrect
Writea
thinkof
2. Task2(communicability)
without causing the reader any dienculties.You will have1Ominutes tocomplete the
test.'
Prompt:You are goingto discussthefo11owingtopic withyourclassmates, "Why do
youstudy English?"Inorder to
prepare
forthediscussion,thinkof as many answers aspossibletothequestionand write them as t`To travelabroad."
Appendix B:Rating scales