Theory of a Flowchart Approach to Industrial
Cluster Policy
著者
Kuchiki Akifumi
権利
Copyrights 日本貿易振興機構(ジェトロ)アジア
経済研究所 / Institute of Developing
Economies, Japan External Trade Organization
(IDE-JETRO) http://www.ide.go.jp
journal or
publication title
IDE Discussion Paper
volume
36
year
2005-09-01
INSTITUTE OF DEVELOPING ECONOMIES
Discussion Papers are preliminary materials circulated to stimulate discussions and critical comments
Keywords: flowchart approach, industrial cluster policy, sufficient conditions, regional
economic growth, quasi-public goods, increasing returns to scale, scale economies.
JEL classification: O14, R12, R58.
DISCUSSION PAPER No. 36
Theory of a Flowchart Approach to
Industrial Cluster Policy
Akifumi KUCHIKI*
September 2005
Abstract
A flowchart approach to industrial cluster policy emphasizes the importance of the ordering of policy measures. The flow of policy implementation is to establish an industrial zone, to invite an anchor company, and to promote its related companies to invest in the industrial zone. This article delineated “a flowchart approach to industrial cluster policy” by proposing sufficient conditions for forming industrial clusters typical in the manufacturing industry in Asia to enhance regional economic growth. The typical industrial cluster policy was theorized by defining an industrial zone as ”quasi-public goods”, and it was shown that the policy enhances economic growth under a production function of ”increasing returns to scale” of an anchor company. Critical amounts of the production of ”scale economies” that are used by the related companies to decide whether or not to invest in clusters were also shown.
The Institute of Developing Economies (IDE) is a semigovernmental, nonpartisan, nonprofit research institute, founded in 1958. The Institute merged with the Japan External Trade Organization (JETRO) on July 1, 1998. The Institute conducts basic and comprehensive studies on economic and related affairs in all developing countries and regions, including Asia, Middle East, Africa, Latin America, Oceania, and East Europe.
The views expressed in this publication are those of the author(s). Publication does not imply endorsement by the Institute of Developing Economies of any of the views expressed.
INSTITUTE OF DEVELOPING ECONOMIES (IDE), JETRO 3-2-2, WAKABA,MIHAMA-KU,CHIBA-SHI
CHIBA 261-8545, JAPAN
1. Introduction
A policy for forming an industrial cluster, or an industrial cluster policy, plays an important role in developing a region in European Union countries. A cluster is a geographic concentration within a nation or region of interconnected companies, specialized suppliers, service providers, and associated institutions in a particular field. One case is that of Western Scotland. There are a number of examples that show the practical application of industrial cluster models and policy measures in East Asia. Ministry of Economy , Trade, and Industry (METI) in Japan approved 19 industrial cluster plans (see Mitsui, 2003). Malaysia’s Second Industrial Master Plan of 1996-2005 includes policies to promote development of competitive clusters in the electronics industry. The Industrial Estate Authority of Thailand (IEAT) is a state enterprise under the jurisdiction of the Ministry of Industry. It was established in 1972 to carry out the country's industrial development policy. Thailand’s National Economics and Social Development Board (NESDB) plans, and Industrial Estate Authority of Thailand (IEAT) implements regional development policy by forming industrial clusters. In June 2004, the NESDB announced that within three years, it intends to form eight clusters as the core of the automobile and electronics industries in four regions. The IEAT plans to establish industrial zones specifically for industrial clusters such as that of the automobile cluster of the Eastern Sea Board Industrial Zone.
Porter (1990) recommended what he termed a diamond approach. Four points of the diamond represent factor conditions, demand conditions, related industries, and firm strategy/rivalry. The four points of the diamond thus represent the four basic attributes that affect regional productivity and innovation. Each of the four attributes is self-reinforcing. Each also has a unique and important role to play in a region’s business environment, and they all operate together as a system. But the diamond approach is not really industrial cluster policy, because the four factors do not make the role of government clear.
Markusen (1996) classified four types of industrial agglomeration, but these types do not provide direct explanation for common patterns of Asian experiences in regional development. Kuchiki (2003) found that conditions for forming new clusters in northern Vietnam included: (a) industrial zones, (b) capacity building of physical infrastructure along with institutional reforms in investment procedures, (c) anchor firms in the manufacturing industry, and (d) related firms. We showed that industrial zones, together with a combination of infrastructure and institutions, played crucial roles in development of industrial agglomerations. However, no one thus far has discussed theoretical aspects of sufficient conditions necessary for success in industrial cluster policy.
In this article, a “flowchart approach to industrial cluster policy” is developed by proposing sufficient conditions for forming industrial clusters typical in the manufacturing industry in Asia, and by theoretically explaining the sufficiency of these conditions for enhancement of regional economic growth. The typical pattern of forming industrial clusters in East Asia is theorized by defining ”quasi-public goods.” It is then demonstrated that industrial cluster policy enhances economic growth under a production function of ”increasing returns to scale”, and further that critical amounts of production of ”scale economies” for firms to decide to invest in clusters can be determined. Concepts of “quasi-public goods”, “increasing returns to scale”, and “scale economies” are crucial to this theoretical development. Sufficient conditions include establishment of industrial zones, building of capacity, and invitation of anchor firms together with their related firms. First, industrial zones as quasi-public goods are provided by both organizations in the quasi-public sector and by firms in the private sector. Second, industrial cluster policy can enhance regional economic growth in cases where an anchor firm operates under “increasing returns to scale”. Markets for sales in Asia are large enough for anchor firms to attain “increasing returns to scale”. Third, the fixed capital of companies related to the anchor company determines the minimum optimal size of car production of “scale economies”. A flowchart approach to industrial
cluster policy emphasizes the importance of ordering and timing of policy measures. The flow of policy implementation establishes an industrial zone, invites an anchor company, and promotes that anchor company’s related companies to invest in the industrial zone.
It should be noted that industrial cluster policy is different from industrial policy. Industrial policy is a national policy for intervening in markets to foster specified industries as picked winners. Industrial cluster policy is a part of regional development policy. It is important to make the roles of local governments clear in relation to industrial cluster policy and the formation of industrial clusters. Though Kuchiki (2003, 2004) illustrated successful cases of the flowchart approach to industrial cluster policy in industrial clusters of northern Vietnam and Tianjin in China, more examples are needed to provide reduction to a prototypical model of the flowchart approach in East Asia. The flowchart approach may be applied to other cases in Asia.
Section 2 defines “quasi-public goods” and applies this definition to industrial zones and capacity building. Section 3 demonstrates that industrial cluster policy in East Asia can enhance regional economic growth in cases where anchor firms operate under a production function of “increasing returns to scale”. Section 4 explains how markets in China are large enough for firms related to anchor firms to be able to attain “scale economies”. Section 5 includes discussion of conclusions.
2.1 The Role of Quasi-Public Goods of Industrial Zones on Industrial Cluster Policy
This section includes a definition of quasi-public goods and clarifies the role of local government in implementing industrial cluster policy. Both private and quasi-public sectors can optimally provide quasi-public goods for industrial cluster policy.
Samuelson (1954) made a bi-polar distinction between pure public and pure private goods in the real world, and between these extremes fall quasi-public (non-pure) goods.
There are some goods that seem to have characteristics of both pure public and pure private goods. Samuelson (1958) conceded that many goods, which are commonly defined as public goods, do not fit his definition, and many articles have been published which allow further closing of the gap between pure private and pure public goods.
This section attempts to make clear the confusion that has arisen in discussing public goods by revealing the implicit assumptions of Samuelson’s model. For that purpose three criteria are defined that characterize goods. A taxonomy of these articles may be developed by utilizing these criteria.
Attention will be placed on the criteria of non-excludability or excludability, non-rivalness or rivalness, and non-optionality or optionality. Each characteristic may be formulated mathematically, and a model may be built that involves public goods and covers quasi-public goods as well. Arguments for optimal conditions of goods in terms of the three characteristics may then be made.
Some propositions and implications will then be advanced. Even if a good has rivalness, market failures may still occur if that good is non-excludable and non-optional. Vertically added demand curves may also be considered. Even though a good is non-excludable and non-rival, all of the individual marginal rate of substitution need not be added vertically if that good is optional. There may also be a clue to aid in solving the dispute between Samuelson (1964) and Minasian (1964) that has been seen on television. An important point is that the property of non-optionality is crucial in optimality conditions.
“Quasi-public optional goods” may be defined as non-excludable or non-rival, and optional. From the point of inequality, it may be concluded that quasi-public optional goods should be decentralized according to peoples’ preferences. It is often said that a mixed economy consists of the public and private sectors. However, it seems that the importance of quasi-public sector, which belongs to neither the public nor private sector, has recently been magnified. The concept of quasi-public optional goods is useful to make clear the role of the quasi-public sector. This section illustrates the most desirable quasi-public goods that may be supplied by both the quasi-public and the private sector.
Section 2.2 presents four criteria for classifying goods. In section 2.3, a model is built that includes some kinds of quasi-public goods. Section 2.4 contains optimality conditions. Finally, section 2.5 shows that industrial zones with tax incentives and one-stop services have the properties of quasi-public goods.
2.2 Criteria for Classifying Goods
This section includes definitions of non-excludability, non-rivalness, non-optionality, and non-indivisibility.
[NE] Non-excludability, [E] Excludability:
A non-excludable good is one in which the supplier is not free to exclude individuals from using it at small or zero costs once the good is produced. Suppose that a good (X) is produced in x units, and that the available ratio of an individual (i) is ki ( o
≦ ki ≦ 1). Then the available level of X to the individual is xki. A non-excludable
good is one in which ki is determined at the same time that the good X is produced. It is
given to the supplier, and the supplier cannot change ki. An excludable good is one in
which ki can be changed by the supplier at nearly zero cost if that supplier wishes to.
Thus, ki is not constant but variable relative to suppliers.
[NO] Non-optional, [O] Optional:
A non-optional good is one in which a demander i cannot change consumption level (xi) freely once an available consumption level is determined as xki. A constraint of a
demander i is that the demander must consume all available levels of X in the case of a non-optional good. The available level is xki. So xi = xki. In the case of an optional good,
the maximum available level is also xki, but demanders can change levels of
consumption. The demander can choose a value of ki from zero to one (0 ≦ ki ≦ 1).
everyone, and no one can be precluded from enjoying them whether he contributed to their provision or not.” In other words, ”A non-optional good is one for which some positive consumption level is exogenously imposed, and any attempt to deviate, either upward or downward, requires additional expenditures.
[NR] Non-rivalness and [R] Rivalness:
A non-rival good is one in ”which all enjoy in common in the sense that each individual’s consumption of such a good leads to no reduction from any other individual’s consumption of that good” (Samuelson, 1954). In general, non-rivalness does not mean that the same precise product quality is available to each demander. For example, demander 1 who lives close to the police station is considered to have better protection than the demander 2 who lives far away from it. That is,
k1>k2.
It may therefore be deduced that in the case of a rival good, the following must hold:
{
∑
≤ ≤ ≤}
= i i 1, 0 i 1
r k k k
k
In the case of a non-rival good, on the other hand, the possibility is kn =
{
ki∑
ki >1 or∑
ki ≤1, 0≤ki ≤1}
.[ID]Indivisibility, [D]Divisibility
Goods are in the form of discrete units, some of them quite large or “lumpy”. Usually, an indivisible commodity is defined as an “integer” (see Gomory and Baumo, 1960; Frank, 1969; and others).
Figure 1 depicts the process from production to consumption and explains which process relates to each characteristic. Non-excludability or excludability relate to the process of supply, and non-optionality or optionality to the process of demand. Using these characteristics, articles in the theory of quasi-public goods may be reviewed. For
example, Holtermann (1972) corresponds to [D] [NE] [R] [O] [ID], and Davis and Whinston (1967) to [ID] [NE] [R] [O]. Samuelson’s pure collective goods are [NE], [NO], and [NR], ki=1 for all i. Theoretical studies of indivisible goods appear in print
with increasing frequency because these are more relevant for solving real world problems. It is necessary to analyze cases that remain untouched. Hereafter, attention will be given to [NE] or [E], [NR] or [R], and [NO] or [O] (see Appendices 1 and 2).
2.3. The Model
Consider the following cases and examples corresponding to each:
V: [NE] [NR] [NO] ---national defense, national security (self-sufficiency of food) W: [NE] [NR] [O] ---television broadcasting, radio waves
X: [NE] [R] [O] ---oxygen in a limited space
Y: [NE] [R] [O] ---outdoor circuses, green utilities (agriculture) T: [NE][NR][O]---research
Z: [E] [R] [O] ---bread
Proposition 1: If a good is excludable, each ki is a variable for the demander i. Each
demander must determine the optimal value of ki; otherwise, ki remains indeterminable.
Therefore, it cannot be non-optional.
The economy has six kinds of goods including two kinds of pure public and private goods
(V,Z), and four kinds of non-pure goods (W, X, Y, T). Here, (V1,---Vj;
W1,---,Wk ;
following equations, superscripts refer to persons and subscripts to goods.
When properties of goods are considered, the constraints of these goods are as follows: a i a i a V V =v (1) where 0≤ i a v ≤1, i a
v are constants, and
∑
i i a
v >1is possible for all i, a=1, ---, j.
i Wb≤ i b w Wb, (2) where i b w correspond to i a v in (1).
∑
i i Ze≤Ze, e=1, ---, n (3)Constraint (2) indicates that no more goods can be consumed than is allowed by the quantity of goods available to the individual i. Here i
a v , i b w , i c x and i d y corresponding to ki are used in section 2.2.
Proposition 2: The optimality condition of T, in which non-rivalness plays a crucial role, is the same as that of W. In the case of T, however, it is always necessary that i
f
t corresponding to kibe equal to unity for all i (see Appendix 3).
Proposition 3: Whether a good is rival or non-rival will not result in essential differences in the optimality condition between W and Y. The result is similar to the relationship between V and X (see Appendix 3).
It may be assumed that the production possibilities for the economy are described by a well-behaved transformation locus
F (V, W, Z) ≤0.
Here V represents pure public goods, W represents non-excludable, non-rival and optional goods, and Z refers to pure private goods. Hereafter, T is omitted because of
Proposition 2. Attention is also placed on V and W because of Proposition 3.
Each individual’s utility function (ui) and the social welfare function (U) may be assumed to be the same as that of Samuelson (1964). The maximization problem is written in Appendix 4.
2.4. Optimality Conditions
The results of V and Z are well known. That is, if pure private goods Z are chosen, then an individual should consume an amount that equals his weighted marginal utility to the price of the good. The multipliers can be interpreted as shadow prices. For each pure public good V, the sum of the marginal rate is equal to the inverse of that private good in the consumption of the pure one. The distinction between public goods and private goods has been held to lie in the non-rivalness of public goods (Musgrave, 1969). However, the crucial characteristics are not that of non-rivalness, but rather those of non-optionality and non-excludability (Appendix 4). Musgrave (1969) says,
Due to the nonrivalness of consumption, individual demand curves are added vertically rather than horizontally as in the case of private goods.
This statement is not always true in terms of definitions given in this article.
Proposition 4: If a good is optional, then even if it is non-excludable and non-rival, the optimality condition does not require
MRT,
MRS =
∑
iwhere MRS and MRT denote marginal rate of substitution and marginal rate of transformation, respectively.
Consider the extreme
MRT,MRSi = for i∈M
It is possible that the “benefit principle” holds in the case of optional goods W. Probably, the way of charging tolls succeeds from the viewpoint of optimal allocation of resources, for users cannot choose but to reveal their true preferences. A similar argument also applies to non-excludable, rival, and optional goods Y.
Proof: The Kuhn-Tucker conditions with respect to W are: A= ( ∂U / ∂ui )(∂ui / ∂ ⅰ b W )- i b β ≤0、A・ ⅰ b W =0、 ⅰ b W ≥0、 i=1, ---, s, b=1, ---, T. (4) B=
∑
i i b β -α・ ⅰ b W ・∂F/ ∂ w ≤0、B・b W =0、b W ≥0 (5) b C= -( ⅰ b W - ⅰ b w W )≥0、C・b i b β =0、 i b β ≥0 (6) Consider the following definitions:b M = {i│ ⅰ b W / ⅰ b w =max (W1 b/ 1 wb、---、 s b W / s b w )} t M = {1, ---s} b N = M -t Mb
The Sets Mb cannot be empty, since the constraint (6) must be binding for some
persons in order to have a rational allocation of resources. Thus, the multipliers i b
β (for i ∈Mb) become positive. The strict inequalities,
-( ⅰ
b
W - ⅰ
b
w Wb)<0, for i ∈Nb,
must be held in (6). Therefore, from (6), , 0 = i b β for i ∈Nb.
Notice that whether the individual belongs to M or b Nbalso depends on 1
wb. In this
process, w1
bplay an important role. Suppose that some set M consists of a single b
element. That is, consider the extreme case where the maximum is only one person. The strict inequality must hold in (6) except for the person. Then,
∂U / ∂ui ・∂ui / ∂ ⅰ b
W =α・ ⅰ
b
It is possible to suppose that such situations will occur. In general, however, the sets
b
M will consist of more than one person. Attention may be placed on the sets
b
M alone. Here it is very important that in the process of getting optimality conditions, those who belong to the setsNb can be neglected. In general, they do not want to
consume goods W.
This proposition has some implications. First, Samuelson (1955) argues: “A point on the efficiency frontier requires equality between the vertically-added marginal rates of substitution of all men for the public and private goods.”
However, it is possible that in the case of W([NE][NR][O]) or Y([NE][R][O]) different individuals’ MRS need not be added vertically. It is possible to leave those who do not belong to the setsM out of consideration. b
2.5. Industrial Zones as Quasi-Public Goods
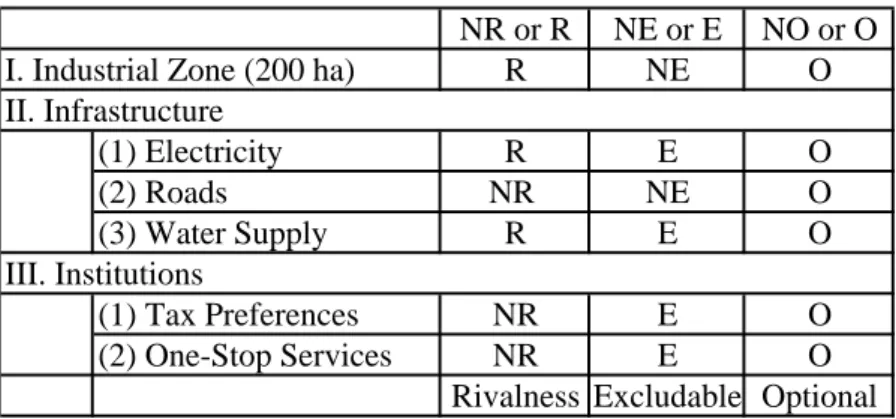
Consider an export-processing zone with one-stop services and tax reductions with exemptions to promote exports. The zone, which is constructed as a single unit within a 300-hectare plot, has a town equipped with infrastructures. A town of the zone consisting of factories, housing, and amusement facilities is indivisible, but it is also excludable and optional to each company. An office at the zone provides services and procedures for companies to establish their plants. One-stop services are rival and optional. Taxes such as income and import tariffs of companies are reduced or exempted. Tax incentives in an export-processing zone are “non-rival” and non-optional. In the next section, G denotes the total government investment in an export-processing zone.
The Asian experience of economic growth shares common characteristics. The economic sector is separated into the private sector and the public sector. Further, goods are categorized into those subject to “market competition” and those that generate “market failures.” The private sector bears the responsibility for market competition (Arrow D in Figure 2), and the public sector bears the responsibility for market failures
(Arrow B in Figure 2). Intervention in the private sector by the public sector is the active industrial policy of Arrow C in Figure 2. This is a textbook approach in economics.
Figure 2 shows the role of the public sector in market failures, for the most part sufficiently analyzed by economics. Experiences in Asia, however, show that private-sector corporations cover market failure losses as Arrow A in Figure 2. Arrow A is a new activity under globalization. For example, multinational corporations (IPP’s or Independent Power Producers) supply electrical power to Asian countries. BOT (Build- Operate- Transfer) is a system by which the private sector supplies infrastructures. Certain infrastructures are categorized as public goods and thus represent one type of market failure. Japanese trading corporations supply infrastructures using this system in Asia.
As shown in Figure 3, the role in economic growth played by the quasi-public sector may be clarified. This sector is positioned midway between the private and public sectors. Arrow F in Figure 3 shows roles of the quasi-public sector in providing quasi-public goods. In the quasi-public sector, the Industrial Estate Authority of Thailand played an important role during the construction of industrial zones in Thailand in the latter half of the 1980’s. These industrial zones effectively functioned to introduce foreign investment to Thailand. The point that requires emphasis here is that quasi-public goods supplied by the quasi-public sector played a leading role in the early stages of economic development. Note that Arrow A shows roles of the private sector in providing quasi-public goods. Multinational corporations establish export-processing zones.
Regarding another common characteristic of the Asian experience of economic growth, the quasi-public sector plays an important role in the process of economic development, as shown in Figure 3. One typical example of a market failure is a pure public good. A pure public good is non-exclusive, non-competitive, and indivisible, as explained in Section 2.2. Numerous quasi-public goods, such as export processing zones, exist. However, they may not possess all three properties but one or two. Roles of
the quasi-public sector must be distinguished from those of the private sector by taking into account the property of quasi-public goods when the government takes an industrial cluster policy.
In some cases, it is desirable that quasi-public goods be supplied by economic agents in the quasi-public sector. So far, there has been perhaps too much discussion about the roles of the state or government without sufficient analysis of the “quasi-public goods” that should be supplied by economic agents in the quasi-public sector.
3.1. A Regional Growth Model: Increasing Returns to Scale in Anchor Firms
Asian experiences in the 1980’s showed that industrial zones or export processing zones (EPZ’s) in East Asia contributed to the generation of employment opportunities. EPZ’s limit job opportunities to people around the sites of EPZ’s. An interesting question is whether or not EPZ’s as quasi-public goods can enhance the aggregate growth of a region by forming industrial clusters.
In a pioneer work, Hamada (1974) analyzed EPZ’s. Grossman and Helpman (1991) built a model which takes into considerations both innovators and imitators of new technology. The purpose of this section is to determine conditions under which EPZ’s can enhance aggregate growth and to examine whether or not reduction in foreign investors’ tax rates is effective in enhancing aggregate growth. To that end, this section includes the application of a model of Grossman and Helpman to EPZ’s.
Based on experiences in East Asia, an EPZ model can be built that explains a growth mechanism in East Asia in which industrial zones or export processing zones link multinational companies pursuing cost reduction with governments of recipient countries implementing deregulation and preferential tax treatment. Specific focus is placed on the role of the EPZ’s in East Asia. ,A behavioral theory relative to multinationals that invest in EPZ’s is also applied.
In constructing a macroeconomic growth model to analyze effectiveness of EPZ’s in enhancing aggregate growth of a nation, it can be concluded that national income can be increased by reducing profit taxes if production functions of final goods of multinational companies in EPZ’s have increasing returns to scale. Further, governments should invite multinationals to EPZ’s if costs of invitation are much cheaper than those of imitation, or if the number of intermediate goods of multinationals is larger.
Section 3.2 contains the development of a growth model of an industrial cluster with industrial zones, and also includes examination of a case where multinationals of country 1 are innovators, and local firms of country 2 imitate innovations of the multinationals by paying the fee for imitation. Section 3.3 includes analysis of a case where, in addition to section 2, multinationals of country 1 make a decision about whether or not they will invest in EPZ’s of country 2. Conclusions are presented in Section 3.4.
3.2. The Case of a Country Imitating Innovations of Multinational Companies
In this section, a model of an industrial cluster with industrial zones is constructed, and it is shown that a region can grow at high rates by adopting a preferential tax policy( )t .
Two cases are considered:
Case 1: Multinational companies of country 1 are innovators, and local firms of country 2 imitate the innovations of these multinationals at the cost of imitation,ν.
Case 2: In addition to Case 1, multinational companies of country 1 make a decision about whether or not they will invest in EPZ’s of country 2 by themselves.
In Case 1, it can be assumed that innovative products are intermediate inputs into the production of a single final good. Households can consume the final good Y . The technology for producing final output requires intermediate goods and input of labor.
Intermediate goods are produced by labor alone, and labor also is the sole input into research and development.
Following Romer (1990), the production function of the firms in industrial zones in Guangzhou to imitate firms in country 1 may be written as
Y A L X j j n 2 2 2 1 2 1 1 = − =
∑
α α ,where 0< <α 1, n1 is the number of varieties of intermediate goods, A2 is a
productivity parameter, L2 is labor input, and X2j is the employment of the j th type
of intermediate good. The government is assumed to run a balanced budget financed by a proportional tax at a rate of t. Here, an innovator in country 1 is an intermediate
goods producer. An imitator in country 2 is a final goods producer. The profit of the producer of final goods in country 2 (π2F) is
π2 2 2 2 1 1 F j j j n Y wL P X = − − =
∑
,where w is the wage rate, and Pj is the price of the intermediate good j.
The condition to maximize the profit is X2j =L A2 2 Pj 1 1
−
( α/ )/( α) . (7)
Next, monopolistic competitions in intermediate goods may be assumed. The profit of producers in country 2 of intermediate good is
πM2j = P Xj( 2j)⋅X2j − X2j . (8)
The solution for the monopoly price is
Pj = 1/α . (9)
Hence, if (7) and (9) into (8) are used for substitution into Pj and X2j, then
{
}
π α α αα α M2j L A2 2 1 1 2 1 1 = ( − ) / / (− ) / (− ) . (10)It may be assumed that the business is free to imitate the j th intermediate good. Thus, anyone can pay the imitation cost ν to secure (in the unit of Y ) the net present value V(T) at time T. This can be obtained by time γ from T to infinity:
Vj(T) =
∫
∞T πM 2j e
-r(γ-T)dγ , (11)
where r is the interest rate and is constant. The free-entry condition requires that
Vj(T)=ν. (12)
Equations (11) and (12) give πM2j /Vj = , r
that is,
{
}
r=(L2 / ) (ν 1−α α) / A21 1/ ( −α)α2 1/( −α) . (13)
It may be assumed that households maximize utility over an infinite horizon:
{
− −}
⋅ =∫
∞ − 0 1 1)/(1 ) (c δ δ U e-ργdγwhere ρ is the constant rate of time preference, δ is the coefficient of risk aversion, γ is time, and c is consumption (Here, the rate of population growth is assumed to be 0).
The growth rate of consumption is & / ( / ) ( )
c c= 1 δ ⋅ −r ρ . (14)
Balanced growth may be assumed, so Equations (13) and (14) yield the growth rate of country 2 as follows:
{
}
[
( / ) (1 )/]
. ) / 1 ( , / / ) 1 /( 2 ) 1 /( 1 2 2 0 ρ α α α ν δ − α α − = = = − − A L Y Y c c g & & (15)3.3. The Case of Multinational Companies Investing in Export Processing Zones
In Case 2, firms from country 1 decide to invest in an export-processing zone (EPZ) in country 2.
Let G represent the total of government investment in an export-processing zone as explained in Barro and Sarai-i-Martin (1995). The production function of a final good
Y A L X j G j n 1 2 1 1 1 1 = =
∑
γ ( α) βwhere L1 is labor input, and X1j is the employment of the j th type of intermediate
good. The profit for the firms in the EPZ of the final good before taxation is
π2 θ 1 1 2 1 1 1 F j j j n Y wL P X = − − =
∑
,where w is the wage rate, and θ is country risk in the EPZ for firms of country 1.
This was explained in the previous section and is different from the productivity parameter A2.
Whether multinationals make a decision to invest in the EPZ depends on whether or not the country risk θ is lower than the threshold rate. The value of this threshold is determined by the key variable of tax rate t , and this depends on the government of country 2. The lower the tax rate made by the government of country 2, the more easily the firms of country 1 may invest in the EPZ of country 2. The importance of the role of government in providing quasi-public goods is emphasized below.
Here, the case of foreign investment of firms from country 1 in the EPZ is considered. In terms of the currency of country 2 before taxation, the profit of firms from country 1 relative to an intermediate good is
{
}
π α α θ αα α M j1 A2 L 1 1 2 1 1 1 = ( − ) / ( )/ (− ) / (− ) .Then, the tax revenue for the government of country 2 is
tπM j1 . (16)
The total flow of monopoly profit to country 2 from the imitation of a new product of country 1, and the invitation to the EPZ in country 2, is the sum of the flows shown in the Equations (10), (15) and (16):
{
}
{
}
j j j A L t X X R2 (1 )/ 21/(1 ) 2/(1 ) 2 (1 )/ 1 2 1 α γ α α α α α α α + − + − = − − ,where the second term is profit tax revenue, and the third term is labor income per industry.
It is assumed that the government of country 2 has spent cost λ to invite firms from country 1 to the EPZ. So, the total cost of country 2 is
ν λ+ .
The rate of return to country 2 is ) ( /
2j ν +λ
R .
Then, the growth rate of country 2 is
{
ν λ ρ}
δ + − =(1/ ) 2 /( ) 1 R j g . (17) Setting g1 – go = K – 1, where{
}
1 ) 1 ( ) 1 ( ) ( 1 2 1 1 1 ) 1 )( 1 ( 2 ) 1 )( 1 ( 2 − ⎭ ⎬ ⎫ ⎩ ⎨ ⎧ − + × − − ⋅ = − − − − − − − − − − −α−β β β α γ β α β α β α β α β α αβ α α γ γ α θ α λ ν t t L L n A K ,it can be seen that the sign of g1− depends of the sign of K. The larger areg0 ν
λ , and n, the more probable the sign of g1− will be positive. In other words, governments g0
should invite FDI to EPZ’s if the cost of invitation is much cheaper than that of imitation, or if the number of intermediate goods is larger.
It may be supposed that a government runs a balanced budget financed by a proportional tax at rate t. That is,
tπ2F = , G
The conditions for the maximization of the firm in country 2 in the EPZ’s is
wL1/n1 =γ θ( A L X2 1γ 1jαGβ), (18)
and
Pj =αθA L X j G γ α β
2 1 1 , (19)
Using equation (9), (18), and (19), the following wage revenue of jth industry is obtained:
wL1/n=γX1j /α2. (20)
be higher in order to enhance aggregate growth rate by inviting multinational companies and reducing the profit tax. The partial derivative of K with respect to t is
∂ ∂ βγ α α α α β K t H t t a = ⋅ ⋅ + − ⎧ ⎨ ⎩ ⎫ ⎬ ⎭⋅ − − − −1 2 1 1 1 ( ) , where H L
{
}
L A n = 11− − − − − − − − − − − − 2 2 1 1 2 1 1 1 1 γ α β α βαβ α α ββ α β α β ν λα( )( ) (θ )( )( ) ( α γ) . The sign of ∂ ∂ Kt is negative in the case of 1− − <α β 0 and α < 1 (the
production function of this case has increasing returns to scale).
Suppose that the production function of a final good Y of the firms from country 1 in the EPZ has increasing returns to scale, that is, 1 <α β+ . Then, national income is increased by the reduction of the profit tax. The lower the tax rate, the higher the growth rate.
3.4. Conclusions
Two conclusions may be advanced: (1) National income is increased by reducing the profit tax if the production functions of final goods of multinationals in EPZ’s of a developing country have increasing returns to scale. (2) A government of a developing country should invite multinationals to its EPZ’s if costs of invitation are much cheaper than costs of imitation, or if the number of intermediate goods of multinational companies is larger.
In the Hamada (1974) model, the welfare effects of an EPZ depend on the factor intensity of protected sectors in the domestic economy. Results in this article show that these effects depend on whether or not the multinational company’s industry has increasing returns to scale or not. If the industry is the case, a government has a crucial role in inviting multinationals to their EPZ and enhancing aggregate growth by reducing tax rates.
4. Sufficient Condition for Establishing a New Plant in a Cluster
This section describes a case of increasing returns to scale with fixed capital. Suppose that firms use indivisible fixed capital. Fixed costs are costs needed at a level of very little production. Average costs decrease when fixed costs are large, and marginal variable costs are small. The average cost function may have a U-shaped curve when fixed costs exist; that is, average costs initially decrease and then increase. There exists an optimal size of production where the marginal costs are equal to the average costs.
An anchor company of car assembly cars has a group of component companies, since a standard car is assembled from more than 25 thousand components. This fact may be applied not only to Japanese companies, but also to the Korean company Hyundai and to the American company General Motors. Clusters in the automobile industry are forming in Guangzhou in southern China, Shanghai in central China, and Tianjin and Beijing in northern China. Distances from Shanghai to Tianjin and from Shanghai to Guangzhou are respectively 12 hundred and 20 hundred kilometers. Thus, component companies must locate near anchor companies when anchor companies exceed certain levels of production. For example, related companies of Toyota belong to a group called Kyohokai. Together with Toyota Motor Corporation and its member companies, the objective of Kyohokai is to produce cars to sell to people near their plants.
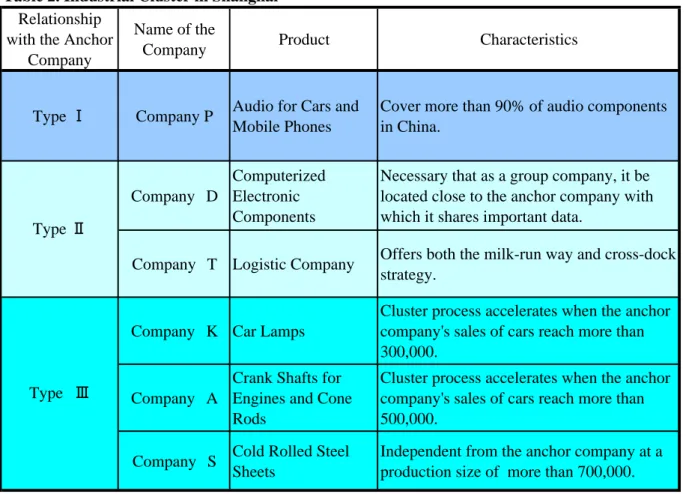
In both Shanghai and Guangzhou, Japanese firms were interviewed on the subject of their optimal sizes. Three different types of component companies were found: (1) Component companies of Type I do not locate near their anchor companies since their products produce a variety of products and are not specific to their anchor company. (2) Component companies of Type II belong to the group of an anchor company and must locate their plant near that anchor company regardless the production size of their own anchor companies. (3) Component companies of Type III locate their plants near their anchor company only if they can attain their minimal average costs at their minimal
optimal size of production. Interview results showed that minimal optimal sizes ranged from 100,000 to 700,000.
In discussing whether or not the related firms of an anchor firm will invest in a cluster, economies of scale of the anchor firm must be taken into consideration.
Hypothesis: The development of an industrial cluster depends on market demand, or the quantity of production of an anchor firm. If an anchor firm expands its production size because of expected expansion of sales, then its related firms will establish new plants in the cluster.
In the following, independent variables of transportation costs are distance, cross-dock logistics, and modularity.
t = f (distance, cross dock logistics, modularity).
It is assumed that an increase in transportation costs caused by technological progress of modularity depends on management and technology:
m = g (management, technology).
It is well known that external economies depend on a number of related firms in a cluster.
In equations below, the following notation is used: t: transportation costs per unit,
m: increase in transportation costs per unit caused by technological progress of modularity,
e: external economies,
s: movement costs for a related firm to establish a new plant, and q: quantities of production.
It is assumed that the technology of modularity does not change, that movement costs are fixed, and that the number of related firms is also fixed. It can then be concluded that quantities of production determine whether or not related firms shift their plants to a place near their anchor firm locations. A related firm’s decision depends on the quantities of production of an anchor firm. That is, a related firm compares its total transport costs (tq) with its movement costs (s) as follows:
s < tq, or s/t < q.
The difference between transportation and movement costs reduces the profits of a firm. An increase in transportation costs due to new modularity technology is crucial in deciding whether or not the related firm will establish a new plant at a cluster as follows:
s < mq, or s/m < q.
Expected gains from external economies (e) can be deducted from movement costs (s). Total costs not to establish a new plant are the transportation costs (tq plus mq). Thus, the related firm compares the expected gains with the total costs,
s - e < tq + mq.
One of the sufficient conditions for the related firm to establish a new plant in its anchor firm’s cluster is:
(s - e) / (t + m) < q.
An illustration of how quantities of production are crucial to determining whether or not related firms will establish new plants may be seen in the following examples:
(1) Firms in Shanghai Type I: Company P:
Company P, established in 1995 in China, produces four kinds of components including speakers for car audio and mobile phones. In 2001, Company P’s research and development produced designs of die-casting for its products in Shanghai. Company P has the means to prevent its designs of die-casting from being stolen. It procures more than 90% of necessary components in China and sells about 8% of its products to Toyota in Tianjin, Honda in Guangzhou, and GM in Shanghai, China. Kamigumi, a Japanese logistics company, collects Company P’s products for Toyota in what can be termed a “milk-run way” such as how Japanese milk companies distribute milk bottles to homes in the morning. Company C is not inclined to outsource its components. It sells its car audio to car companies and also sells its speakers for mobile phones to Motorola in Tianjin. Thus, it has no plan to invest in Guangzhou in near future.
Type II: Company D:
Company D produces computerized electronic components. Being an electronic component producer, it has a close relationship with its anchor company. Company D shares important confidential data with the anchor company, including customer data. Company D joins in the development of the design of new cars with its anchor company from the early stages of the research and development. There are few large worldwide companies such as Denso of Japan, Bosch of Germany, and Delphi of the US. These companies have no other choice but to locate near their anchor companies.
Type II: Company T:
Company T is a logistics company of a Japanese automobile anchor company and adopts the aforementioned milk-run way and a cross-dock strategy. The milk-run way allows component companies to prepare their products to be shipped by a time specified by their anchor company. Company T goes round to collect these products. The cross-dock strategy is a method to package the collected components by a “just-in-time” system in order to provide components efficiently to the anchor assembly company. Company T has 5 routes of the milk-run way. One point of collection covers components for 200 cars. Efficient logistics weaken incentives of component companies in Shanghai to invest in Guangzhou and Tianjin. However, Company T must locate its anchor company where its components can be provided just in time. This is much like a Keiretsu company, a Japanese term for a set of companies with interlocking business relationships and shareholders. It is expected that sales of automobiles in China in 2010 will reach more than 10 million.
Type III: Company K:
Company K produces lamps for automobiles. Its transportation costs from Shanghai to Guangzhou are more than 10% of total costs since these products need a lot of space. The minimal optimal size of production is 300,000. The company cannot invest in Guangzhou if it is profitable for the company to transport products to Guangzhou, and Toyota in Guangzhou exceeds its products by 300,000. This is because the company
cannot convince its shareholders to establish a plant in Guangzhou if the plant is losing money.
Type III: Company A:
Company A produces crankshafts for engines and cone rods. As these components are used mainly for the central part of engines, material must be easy to process and cut as well as be strong. Company A is so capital-intensive that the investment amount reaches ten million dollars. The optimal size of production of one line at a plant is 500,000. There are only three large Japanese companies in this industry. Company C has no plan to invest in Guangzhou since it is located in Shanghai and transports its products all over China.
Type III: Company S:
Company S is a forging company. Cold rolled steel sheets used in the automobile industry are not produced in China, and this type of sheet requires the high technology of “deep-drawing”. Anshan Iron & Steel Group Corporation has formed a joint venture company with Tessen of Germany, and Benxi Iron & Steel Group has formed a joint venture company with Posco (Pohang Iron & Steel) of Korea. Chinese companies will be able to adopt new technology through these joint ventures. Although the construction cost of the Nippon Steel Corporation plant in Kitakyushu is estimated to reach approximately 2 trillion yen, the cost will be minimized to one quarter of that if construction takes place in China. This can be interpreted to mean that Nippon Steel Company has been forced to invest in China for the growing “demand capacity” of the Chinese market. Nippon Steel Company will begin to produce material through a joint venture with Shanghai Baosteel. The competition within the Chinese steel industry has intensified since 1997 when the Chinese government left its steel industrial policy and allowed production to increase until it was out of control.
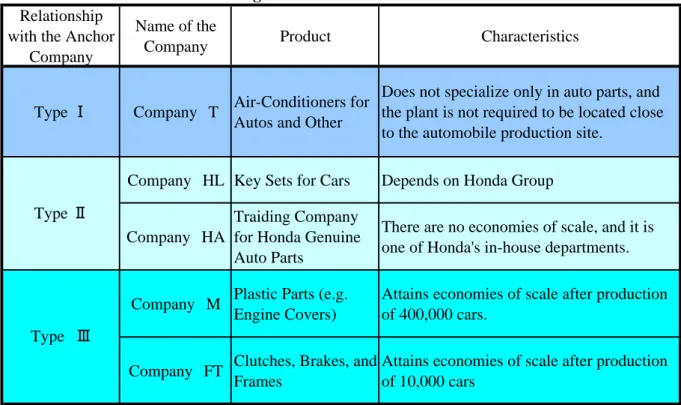
(2) Firms in Guangzhou Type I: Company T:
Company T started its business in China with the production of air-conditioner parts, an area not related to automobile production. In China, local companies have been catching up with the technological level of Japanese companies in a relatively short term by introducing CAD (Computer-aided Design) / CAM (Computer-Aided Manufacturing) to metal-molding production. Company T’s products are required to achieve Japanese quality levels and Chinese price levels at the same time. A large number of machines at a price level between 50 billion and 20 billion yen are needed for equipment investment. In 2003, Company T started to produce auto-parts as well as electronic equipment parts. As the company does not specialize only in auto-parts, the plant is not required to be located close to the automobile production site.
Type I: Company HL:
Company HL produces key sets for four-wheeled and two-wheeled vehicles. Magnesium and zinc are key materials for production. Plastic die-casting also plays an important role in the process of production. HL intends to sell its auto parts products to Nissan and Toyota, even though the firm is dependent upon the Honda group in what may be called Keiretsu. The minimum production level required to attain economies of scale is not clear since HL produces a variety of auto-parts besides key sets.
Type II: Company HA:
Company HA is one of Honda’s in-house departments that trade Honda’s genuine auto-parts. Though it is a trading company, HA does not possess fixed assets except office installations. For this reason, the company can enter Honda’s Investment markets. HA has no economies of scale.
Type III: Company M:
Company M produces plastic parts and components such as engine covers for Honda. Production processes include die-casting, painting, and assembly. The company must increase its production for Honda’s new investment in Wuhan City and start Honda’s new plant operation in Guangzhou. Company M purchases plastic materials from two companies, including Mitsui Chemical, to keep its prices competitive. The company uses large-scale machines, and these enable the firm to attain economies of scale after
approximately 400,000 Honda automobiles. Type III: Company FT:
Company FT produces clutches, brakes and frames. Production processes include metal stamping, welding, painting, and assembly. Maintenance of mold and a method of three-dimensional measuring that guarantee precision, are key factors for production. The minimum production level of automobiles required to attain economies of scale is 100,000.
5. Conclusions and Summary
This article delineated “a flowchart approach to industrial cluster policy” by proposing sufficient conditions for forming industrial clusters typical in the manufacturing industry in Asia and providing theoretical support for the sufficiency of these conditions to enhance regional economic growth. The typical pattern of forming industrial clusters in East Asia was theorized by defining ”quasi-public goods”, and it was shown that industrial cluster policy enhances economic growth under a production function of ”increasing returns to scale”. Critical amounts of the production of ”scale economies” that are used by firms to decide whether or not to invest in clusters were also shown. Concepts of quasi-public goods, increasing returns to scale, and economies of scale are crucial to theoretical development presented here. Sufficient conditions are to establish industrial zones, to build capacity, and to invite anchor firms together with their related firms. First, industrial zones, capacity such as in physical infrastructure, institutions, and human resources as quasi-public goods are provided by both organizations in the quasi-public sector and firms in the private sector. Second, industrial cluster policy to provide industrial zones and capacity as quasi-public goods can enhance regional economic growth in cases where an anchor firm operates under increasing returns to scale. Markets for sales in China are at an early stage of development and large enough for anchor companies to attain increasing returns to scale. Third, the minimum optimal size of car production of economies of scale depends on the size of fixed capital of the related companies of anchor companies.
A flowchart approach to industrial cluster policy emphasizes the importance of the ordering and timing of policy measures. The flow of policy implementation is to establish an industrial zone, to invite an anchor company, and to promote its related companies to invest in the industrial zone. Further, the recipient country’s government reduces its role in order to promote competition. It thereby transfers greater authority to local governments and makes more use of the quasi-public sector (public corporations and state enterprises). As a result, the quasi-public sector is likely to supply quasi-public goods (see Table 2). The improvement and expansion of network formation in Asia by both multinational corporations and the quasi-public sector are thus prerequisites to the upgrading of Asia’s industrial structures.
* The author is greatly indebted to M. Fujita, R. Kada, H. Kim, J. W. Longworth, C. Nakajima, Y. Maruyama, K. Suzumura, and M. Tsuji for helpful suggestions and constructive comments on an earlier draft. Responsibility for errors, of course, remains with the author.
Appendix 1: Practical Considerations
There have been some requests for decentralization. Some economists criticize the high degree of centralization in governmental power. Friedman (1962) indicates that national public goods often serve the benefit of a particular group or result in an economic waste contrary to the intention of the central government.
Sugioka (1976) advocates “Regionalism”. This means that governmental power should be decentralized; this is one of the most important topics in Japan.
Little concrete consideration has been given to the question of what kinds of goods and services should be supplied by: (1) local governmental units or (2) the sector that
belongs to neither the public nor private sectors.
The importance of sector seems to have been increasing recently. In order to make the part of the sector clear, the concept of quasi-public optional goods is useful. W, Y and T are defined as quasi-public optional goods in terms of the above analysis. Here, the concept of quasi-public goods is used.
The setsMb, which represent peoples’ needs or the structures of their optionality, are
used below.
(1) Quasi-public goods that are demanded by most local citizens in a city. Sets Mb,
consist of such citizen demands (e.g. parks in the cities). From the viewpoint of equity, local government units should supply such goods.
(2 Organizations in the sector that belongs to neither the public nor private sector supply quasi-public goods. These cases have recently become important but do not seem to be analyzed sufficiently. Suppose that farmers in a country need many kinds of quasi-public goods. Quasi-public optional goods cannot be neglected. It is not appropriate for the local governmental unit to supply them because of inequality. In general, private firms will not give priority to quasi-public goods in terms of profitability. For example, agricultural cooperatives may be considered as economic units that supply quasi-public goods. Examples are as follows:
T: Establishment and management of water facilities T: Wire broadcasting
T: Research on special products (e.g. flowers) T: Information about markets
Y: Roads for agricultural use
The sector may supply some kinds of quasi-public optional goods as “local private collective (production or consumption) goods”. Of course, further analysis on the sector will be needed to make the roles of cooperatives clear.
Appendix 2
Millerton (1972) defined this characteristic, and this is similar to Buchanan’s (1965) statement: “The interesting cases are those goods and services, the consumption of which involves some “publicness”, where the optimal sharing group is more than one person or family but smaller than an infinitely large number. The range of “publicness” is finite.”
Appendix 3
Proof: Non-rivalness requires 0≤ i f t≤1, then i f t Tf≤Tf. Define Ti f= i f t Tf
The constraints of T will be Ti
f≤Tf,
and these are the same as those of W.
Appendix 4
Proof: When the constraints with respect to W and Y are interpreted, only the differences between i
b
w and i
d
y which are constant may be considered. If the possibilities are
∑
i i b w >1,then the constraints correspond to W. If the following must hold
∑
ii
b
w ≤1,
then they correspond to Y. Both are the same in the process of calculating optimality conditions. The way of interpretation may only be changed according to i
b
the relationship between X and V can be discussed. Attention is thus concentrated on V and W. Appendix 5 Max U [u1(V;W1;Z1), ---, us(V;Ws;Zs)] (1) Subject to F (V,W,Z)≤0 (2) i b W ≤wbi W ,b=1,---,k, b i =1,----,s, (3)
∑
i i Ze≤Ze, e=1, ---,n, (4) V, i W ,W, Zi, Z ≥0 (5) Let α, ⅰ bβ , γe represent the multipliers associated with constraints (2), (3) and (4),
References
Barro, R. and Sala-i-Martin (1995), Xavier, Economic Growth, New York, McGraw-Hill, Inc. Buchanan, J. M. (1965), “An Economic Theory of Clubs, “Economica, Vol.32.
Davis, O.A and A. B. Winston (1967), “On the Distinction Between public and Private Goods,” American
Economic Review, Vol.57.
Dorfman, R. (1969), “General Equilibrium with Public Goods,” Margolis, J. and H. Guitton, eds., Public
Economics, Macmillan.
Frank, Jr., C. K. (1969), Production Theory and Indivisible Commodities, Princeton University Press, Princeton, New Jersey.
Friedman, M. (1962), Capitalism and Freedom, the University of Chicago Press, Chicago.
Gomory, R. E. and W.J. Baumol (1960), “Integer Programming and Pricing, “ Econometrica, Vol. 28.
Grossman, G.E. and Helpman, E. (1991), Innovation and Growth in the Global Economy, Cambridge: MIT Press.
Hamada, K. (1974), “An Economic Analysis of the Duty-Free Zone, “Journal of International Economics, No. 4, pp. 225-241.
Hayami, Y. and S.Yamada (1975), ”Agricultural Research Organization in Economic Development, “ Reynolds, L. G., ed., Agriculture in Development Theory, New Haven, Yale University Press.
Holtermann, S. E. (1972), “Externalities and public goods, “ Economica, Vol.39. James, E., “Joint Products, Collective Goods, and External Effects:
Comment, “ Journal of Political Economy, Vol. 77, 1969.
Markusen, A., (1996) “Sticky Places in Slippery Space: A Typology of Industrial Districts,” Economic
Geography, Vol. 72, pp. 293-313.
Milleron,J.C. (1972), “Theory of Value with Public Goods: A Survey Article, “ Journal of Economic Theory, Vol.4.
Minasian, J.R. (1964), “Television Pricing and the Theory of public Goods, “ Journal of Law and Economics, Vol. 7.
Mitsui, I. (2003), “Industrial Cluster Policy and Regional Development in the Age of Globalization,” 30th
International Small Business Congress in Singapore.
---(1969), “Provision for Social Goods, “ Margolis, J. and H. Guitton, eds., Public Economics, Macmillan.
Ng, Yew-Kwang (1973), “The Economic Theory of Clubs: Pareto Optimality Conditions, “ Economica, Vol. 40.
Porter, M. E. (1990), The Competitive Advantage of Nations, New York: The Free Press.
Romer, P. M.(1990), “Endogenous Technological Change,” Journal of Political Economy, Vol. 98, No. 5, pp.
S71-S102.
Samuelson, P. A. (1954), “The Pure theory of Public Expenditure, “ Review of Economics and Statistics, Vol.36.
--- (1955), “Diagrammatic Exposition of Theory of Public Expenditure, “ Review of Economics and
Statistics, Vol. 37.
--- (1958), “Aspects of Public Expenditure Theories,” Review of Economics and Statistics, Vol. 40. --- (1964), “Public Goods and Subscription TV: Correction of the Record, “ Journal of Law and
Economics, Vol. 7.
Figure1.Definition of Goods
[NR] or [R]
[NE] or [E] [NO] or [O]
X
k
2xk
1xk
sxx
1 *x
2 *x
3 * 1 2s
The Process of SupplyProduction
Available Amount of Consumption
The Process of Demand Amount Consumed by Consumers
Figure 2. The Role of the Private Sector in Market Failures
(Importance of Economic Agents)
Public Sector Active Industrial Policy Private Sector
C D
B Market Mechanism A
Risk
Information
Market Failures Economies of Scale
Figure 3. Importance of Quasi-Public Goods
Public Goods Quasi-Public Goods Private Goods
(Note)
B F A D
Public Sector Quasi-Public Sector Private Sector
Note: These include excludable vs. nonexcludable, rival vs. nonrival, and divisible vs. indivisible. Source: Kuchiki (1998)
Figure 4. An Industrial Cluster Formed by an Anchor Firm
Domestic Export
Industrial Zone
(a) Industrial Zone Export Processing Zone
1. Quasi-Public Goods (b) 1.Infrastructure 2.Institutions 3.Human Resources 4.Living conditions 1. Quasi-Public Goods Market (c) Anchor Firm
2. Increasing Returns to Scale
(Production Function) Fixed Capital (d) Related Firms 3. Economies of Scale (Cost Function) Industrial Cluster
Regional Economic Growth
Source: The Author
Market with Saucers
Table 1. Export Processing Zones as Quasi-Public Goods
NR or R NE or E NO or O
I. Industrial Zone (200 ha) R NE O
II. Infrastructure (1) Electricity R E O (2) Roads NR NE O (3) Water Supply R E O III. Institutions (1) Tax Preferences NR E O (2) One-Stop Services NR E O
Rivalness Excludable Optional Note: NR, R, IND, D, NE, E, NO, and O denote non-rival, rival,
non-excludable, excludable, non-optional, and optional, respectively. Source: The Author
Relationship with the Anchor
Company
Name of the
Company Product Characteristics
Type Ⅰ Company P Audio for Cars and Mobile Phones
Cover more than 90% of audio components in China.
Company D
Computerized Electronic Components
Necessary that as a group company, it be located close to the anchor company with which it shares important data.
Company T Logistic Company Offers both the milk-run way and cross-dock strategy.
Company K Car Lamps
Cluster process accelerates when the anchor company's sales of cars reach more than 300,000.
Company A
Crank Shafts for Engines and Cone Rods
Cluster process accelerates when the anchor company's sales of cars reach more than 500,000.
Company S Cold Rolled Steel Sheets
Independent from the anchor company at a production size of more than 700,000. Type Ⅱ
Type Ⅲ
Relationship with the Anchor
Company
Name of the
Company Product Characteristics
Type Ⅰ Company T Air-Conditioners for Autos and Other
Does not specialize only in auto parts, and the plant is not required to be located close to the automobile production site.
Company HL Key Sets for Cars Depends on Honda Group
Company HA
Traiding Company for Honda Genuine Auto Parts
There are no economies of scale, and it is one of Honda's in-house departments.
Company M Plastic Parts (e.g. Engine Covers)
Attains economies of scale after production of 400,000 cars.
Company FT Clutches, Brakes, and Frames
Attains economies of scale after production of 10,000 cars
Type Ⅱ
Type Ⅲ