for analyses of global value chains
権利
Copyright World Trade Organization
journal or
publication title
Global value chain development report 2019 :
technological innovation, supply chain trade,
and workers in a globalized world
page range
155-177
year
2019
章番号
Chapter 8
155
CHAPTER
8
Improving the accounting frameworks
for analyses of global value chains
Nadim Ahmad (OECD)
ABSTRACT
The use of global input-output tables, and the creation of Trade in Value-Added (TiVA) statistics, has greatly improved our understanding of the fragmentation of global production through value chains. However, their application requires a number of assumptions that, in practice, typically understate the degree of interconnectedness. TiVA estimates implicitly assume identical production functions across firms within an industry, when in reality production functions differ consid-erably. Typically, larger (and foreign-owned) firms tend to be more trade oriented than smaller (and domestically-owned) firms. As a result, TiVA statistics underestimate the import
content of exports for the economy as a whole, a key indica-tor characterizing global production. Moreover, TiVA analyses are based on basic price concepts, which provide an appro-priate view of production through value chains, but are less well equipped to analyse consumption, particularly as they exclude significant distribution margins (in particular retail and wholesale activities, often including marketing activities and brands), which add value at the end of the chain. This can distort analyses using “smile curves”, which show the distance from final demand of different sectors within value chains, and in turn understate the scale of jobs supported by trade.
• Trade in Value-Added (TiVA) statistics have greatly improved our understanding of GVCs, but they
use assumptions that generate typically downward biases in measures of GVC integration, and
they give little information regarding the investment strand of GVCs.
• Efforts to mainstream key characteristics of different types of firms in the production of tomorrow’s
TiVA models, through extended supply-use tables, should be prioritized, to improve not only their
relevance, but also their quality.
• Efforts to complement TiVA estimates currently based on basic prices with estimates based on
market prices should also be initiated, not only to ease interpretability, but also to highlight the
significant role played by distributors and to better understand the role played by intellectual
property. Market-based approaches, for example, reveal that 9 million jobs are sustained in the
United States through sales of imports.
1. Introduction
T
he proliferation and development of global input-out-put tables in recent years has significantly transformed our ability to interpret global production. But import-ant though such initiatives have been, it is importimport-ant to recall that they are analytical tools, requiring implicit and explicit assumptions on the detailed interactions of consumers and pro-ducers, and indeed, in their current form are silent on many driv-ers of globalization, such as the role of multinationals, and on impacts, for example with respect to “inclusive globalization”.Trade in Value-Added (TiVA) estimates, derived through the construction of a global input-output table, implicitly assume that all firms within a given sector have the same production function (input-output technical coefficients), import intensity and export intensity.
This of course has never been true. We know for example that larger firms will typically have different production functions to smaller firms, because of economies of scale, and also higher labor productivity. And these firms will also typically be more export- and, indeed, import-orientated than their smaller coun-terparts (reflecting in part the disproportionate costs of trade faced by smaller firms compared to larger firms). The same gen-eralizations hold true for foreign-owned enterprises, or enter-prises with affiliates abroad, compared to purely domestic firms; for example, the foreign content of exports by foreign-owned firms in the other transport equipment sector in the United States is twice that of domestically-owned firms.
That is not, of course, to say that the underlying conceptual basis for TiVA is incorrect. If, for example, global input-output tables were compiled at the firm level, with appropriate break-downs to reflect the specific products and the (often differential) prices paid by consumers (as well as differences in transportation costs), then the corresponding results would accurately reflect the underlying reality they seek to measure. But, for many prac-tical reasons1, this is some way off what happens in practice. Fur-ther, the inability to capture this heterogeneity in current TiVA measures is increasingly compounded by additional complexi-ties, notably the increased scope for multi-nationals (MNEs) to maximize global profits by recording intra-firm transactions in knowledge-based services in a way that is most advantageous to the firm. In practice this means that these types of intrafirm trans-actions can be recorded explicitly as cross-border trade or (and so outside of the TiVA system) as primary income flows.
But this is not the only area where there are challenges with the use of current TiVA statistics. Because inter-country input-output tables value transactions at basic, and not market, prices, many of the related TiVA analyses reveal only part of the story. For example the US domestic value-added content of its exports of textiles and clothing, in free-on-board (F.O.B.) prices, was around 20% in 2016 using market prices, compared to 3% using the pure basic prices approach. The basic price approach also limits the scope to reveal additional dependencies related to globalization, for example jobs sustained in retailers through sales of imports.
This chapter highlights the importance of developing exten-sions to current TiVA frameworks (Section 2) that are better able to capture firm heterogeneity, and, in turn, better high-light the importance of multinational enterprises (MNEs) within GVCs. It also explores the development of a complementary accounting framework in “market” prices and tries to illustrate the insights that can be gained through such an approach (Section 3). In the United States the sale of imports generated an additional 840 billion USD of US value-added in 2016, sup-porting 9.0 million jobs.
2. Accounting frameworks for global value
chains: extended supply-use tables
2.1 Overview
The increasing international fragmentation of production that has occurred in recent decades driven by technological progress, reductions in trade costs, improved access to resources and mar-kets, trade policy reforms, and indeed cost factors in emerging economies, has challenged our conventional wisdom on how we look at and interpret globalization. For example, traditional mea-sures of trade record gross flows of goods and services each and every time they cross borders, leading to what many describe as a “multiple” counting of trade, which may lead to misguided policy measures in a wide range of policy areas. In response to this, the international statistics community has begun to develop new measures of trade on a value added basis, for example the OECD-WTO TiVA database, WIOD, APEC-TIVA and the Euro-pean FIGARO initiative.
But important though such initiatives are, they are only able to respond to one aspect of the globalization debate. Significant attention, for example, is focused on the role of multinationals in this new landscape, and, on this, with the exception of recent exploratory initiatives2, current available, and in particular offi-cial, statistics that follow the TiVA approach are silent. Of particu-lar relevance in this context is the ability of multinationals to shift intellectual property products, such as software and R&D, from one economic territory to another, raising broader questions on the ability of GDP to accurately describe “meaningful” economic activity, with concomitant impacts on other macro-economic sta-tistics, including TiVA. For example, TiVA measures purport to show how (in which industries) and where (in which territories) value is generated in the production of a good or service. The simple relocation of an intellectual property product from one economic territory to another3 can radically alter that view.
In addition, the policy debate in recent years has increasingly focused on what has become referred to as “inclusive ization”, i.e. the growing realization that the benefits of global-ization may not have accrued to all members of society equally, even if only as a process of transition. The challenges of inclusive globalization require that the impacts on people (in other words, workers) are also captured in our statistics. This requires infor-mation on skills, occupations, and compensation paid to these categories of workers.
2.2 Improved accounting frameworks for GVC analyses
More fundamentally, there is a growing appreciation that the sta-tistical compilation tools and accounting frameworks designed and developed over the last 60 years in various manifestations of the System of National Accounts (SNA), despite their significant advances, may reflect a world that no longer exists.
In the early days of the SNA, the rest of the world was recorded as a separate institutional sector to and from which goods were sold and bought; and such a view was largely suf-ficient. But over the years as global production chains and inter-connectedness grew, there was a growing realization that addi-tional information was needed to properly navigate around the economic landscape, which resulted in the development of new areas of statistics, such as foreign direct investment measures and data collections focusing on inward and outward activities of foreign affiliates statistics (FATS). More recently new data col-lections, or rather compilations, have focused on linking trade and business registers to provide insights on which firms in which sectors engage in imports and exports (referred to as Trade by Enterprise Characteristics).
These more recent innovations have significantly improved our collective understanding of trade, and indeed investment, but they are still to a large extent only a partial solution to the statistical challenges presented by globalization.
The development of TiVA type statistics is certainly a step forward in this area, but these too suffer from the stove-pipe approach. TiVA estimates, derived through the construction of a global input-output table, implicitly assume that all firms within a given sector have the same production function (input-out-put technical coefficients), import intensity and export intensity.
This of course has never been true. We know for example that larger firms will typically have different production functions than smaller firms (because of economies of scale) as well as higher labor productivity. And these firms will also typically be more export- and, indeed, import-orientated than their smaller coun-terparts (reflecting in part the disproportionate costs of trade faced by smaller firms compared to larger firms).
The same generalizations hold true for foreign-owned enter-prises, or enterprises with affiliates abroad, compared to purely domestic firms; indeed in many countries MNEs account for the lion’s share of overall trade (Figure 8.1). But TiVA estimates, rely-ing as they do on national Supply-Use and Input-Output tables, cannot reflect these heterogeneities; meaning that key mea-sures, such as the import content of exports are typically down-ward biased.
Moreover, the very process of globalization has increased the scale of these heterogeneities, driving coach and horses through the assumption of homogeneity within sectors. As firms within sectors increasingly specialize in specific tasks in the production process, they also suck in greater imports from the upstream part of the value chain and have greater export orientation. In addition globalization has itself led to an increased prevalence of (once rare) categories of firms such as Factoryless Producers and
Processers, where recent changes in the accounting system
fur-ther weaken the case for assumptions of homogeneity in techni-cal coefficients. For example, all other things being equal, a pro-cessing firm in one sector will have significantly less (recorded) imports than a non-processing firm producing the same final product. Similarly, a Factoryless Producer will be allocated to the distribution sector (with limited intermediate consumption of
FIGURE 8.1 Foreign-owned firms across economies (2011)
0% 10% 20% 30% 40% 50% 60% 70% 80% 90% Austria Czech Republic
Estonia Finland France
Germany Hungary Italy
Luxembourg Poland Portugal Slovak Republic
Sweden United Kingdom
Foreign controlled as % of firms
% exports
% imports
Note: Foreign-owned firms are defined according to FATS/AMNE 50% thresholds. Source: OECD Trade by Enterprise Characteristics.
goods) but the same firm that chooses to buy the material goods used by the processing firms will be allocated to the manufactur-ing sector (with significant intermediate consumption of goods).
The ability of national (and international) Supply-Use and Input-Output tables, based on industrial groupings alone, to describe how demand and supply relationships are related has therefore become more difficult. Typically, in confronting the problem of heterogeneity, the conventional approach has been to provide more detail by aggregating firms at lower levels of the industrial classification system, for example 3 or 4 digit group-ings as opposed to two digit groupgroup-ings, subject to confidenti-ality restrictions being preserved. But this approach may not be optimal, neither in terms of reducing heterogeneity within aggre-gations (and in a way that best responds to the policy drivers) nor necessarily in terms of processing burdens.
That is not to say that industrial classification systems are completely obsolete. It would serve little purpose for example to devise an optimal system that did not retain some means of classifying firms on the basis of their activity, (e.g. manufacturing versus services) if only because these remain the key prisms that users look through when analyzing production. But it does serve to highlight that other approaches to tackling heterogeneity can, and should, be considered.
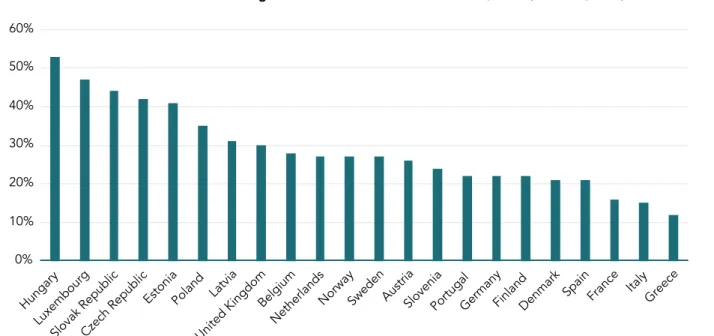
Arguably a more radical approach is needed. Such an approach requires that the role of foreign affiliates in the economic territory, which is significant in many economies, Figure 8.2, and affiliates abroad are captured explicitly (and visibly) in the core accounts and in the development of GVC-related (i.e. TiVA) indicators. It also requires improved information on the trade relationships of categories of firms (for example exporter and non-exporter). Equally important is the need to fully articulate income flows in
and out of the economy and, in particular, from which category of firms (e.g. industrial sector) these arise.
In this sense it is important to note that value added essen-tially reflects two main components4 – (i) operating surplus (including mixed income), or compensation for capital, and (ii) compensation for employment. While the latter component largely reflects the direct benefits that accrue and “stick” within the economy through production5 the case is not so clear for the former, where foreign affiliates are concerned.
In perfect markets the operating surplus generated by foreign affiliates is equivalent to the return on produced “tangible” and “intangible” capital and also non-produced assets used in pro-duction6. While the National Accounts of countries attribute the ownership of this capital to the affiliated enterprise, the ultimate beneficiary of the operating surplus is not necessarily the affili-ate but its parent. This has raised questions – often in emerging economies but also in developed economies – about the actual benefits of foreign MNEs to the host economy. Indeed, more recently it has begun to raise questions about the meaningful-ness of GDP itself as a tool for macro-ecomomic policy making.
Particularly important in this regard are transactions in intan-gible assets: those recognised as produced in the SNA (such as research and development, software, etc.), non-produced (such as brands) and also other knowledge-based capital (such as organizational capital, e.g. management competencies). Often, in international trade in services statistics, payments for the use of these produced and non-produced assets are recorded as purchases (intermediate consumption) by one affiliated enter-prise from another. But often they are not, and instead they are implicitly recorded under primary income payments (such as investment income, or reinvested earnings in the Balance of
FIGURE 8.2 Value Added at Factor Cost of Foreign Affiliates – share of national total, 2014 (ISIC B-N, ex K)
0% 10% 20% 30% 40% 50% 60% Hungary Luxembourg
Slovak RepublicCzech Republic
EstoniaPoland Latvia United Kingdom
Belgium
NetherlandsNorwaySweden AustriaSloveniaPortugalGermanyFinlandDenmark
Spain France ItalyGreece
Payments). In the former case, the value added of the affiliate using the assets is lower, as the value added generated through ownership of the asset appears on the accounts of the affiliate that owns it. In the latter case, however, the value added of the affiliate using the asset is higher (as there is no intermediate consumption) with the “ultimate” beneficiary (the owning affiliate) recording no value added but instead recieving primary income from the using affiliate. In both cases, however, the ultimate “income” generated by the asset ends up on the books of the owner (at least in theory, as even the very notion of the ultimate onwer is a complex issue).
Furthermore, the distinction between the two scenarios above is often clouded by (a) the ability of the statistical information system to record the flows and (b) transfer pricing and tax incen-tives of MNEs. Indeed, in some countries where foreign affiliates generate significant value added and repatriate significant prof-its back to parent companies the policy focus has switched from GDP to GNI, and indeed in some countries, such as Ireland, to new accounting concepts7.
This is not however an issue singularly related to knowl-edge-based assets. Transfer pricing is also prevalent in trans-actions related to goods. Moreover, notwithstanding these issues, significant income flows generated by an affiliate can be repatriated to parents via other means, for example as interest payments.
The tool advocated in the SNA for ensuring coherence across various data sources to assure alignment of GDP estimates cre-ated by the income, expenditure and production approach is supply-use tables, the same underlying core statistical input required for TiVA estimates. As shown in this chapter, through (in principle) simple extensions to conventional supply-use tables,
Extended Supply-Use Tables (ESUT) provide the ideal basis for
bringing together these various domains into a single, integrated economic accounting framework that puts the measurement of the “global” at the heart of the “national”.
2.3 National examples of extended supply-use tables
It is important to stress that the recognition that greater hetero-geneity (disaggregation of firms) within national supply-use and input-output tables is not of course new. It stands to reason that more detailed tables will produce better results. Indeed Chap-ter 14 of the 2008 SNA provides a presentation of Supply-Use tables that differentiate production on the basis of market output, non-market output and production for own-final use. Historically and certainly prior to the explosion in GVCs, capturing hetero-geneity was typically achieved through more detailed splits of industries. What has changed in recent years is the greater appre-ciation that a focus on the industries of firms is not necessarily best nor indeed optimal. Indeed, in 2011, even before the OECD-WTO released their first TiVA database in January 2013, it had become clear that a new approach to heterogeneity was needed, in particular one that focused on the role of MNEs.8
These earlier discussions, and indeed the first release of TiVA, highlighted the importance of looking anew at national statistics compilation systems, with the OECD moving, in 2014, to create a new expert group of countries that would begin to develop what have become known as ESUTs; in other words accounting tools for a coherent view of trade, investment, income and production (for a detailed exposition of the accounting framework of ESUTs see Ahmad 2018). What follows below are national examples9 illustrat-ing the potential (and indeed actual for China and Mexico, whose extended tables are already integrated into the OECD-WTO TiVA database) impact of improved heterogeneity on TiVA estimates. Results for China
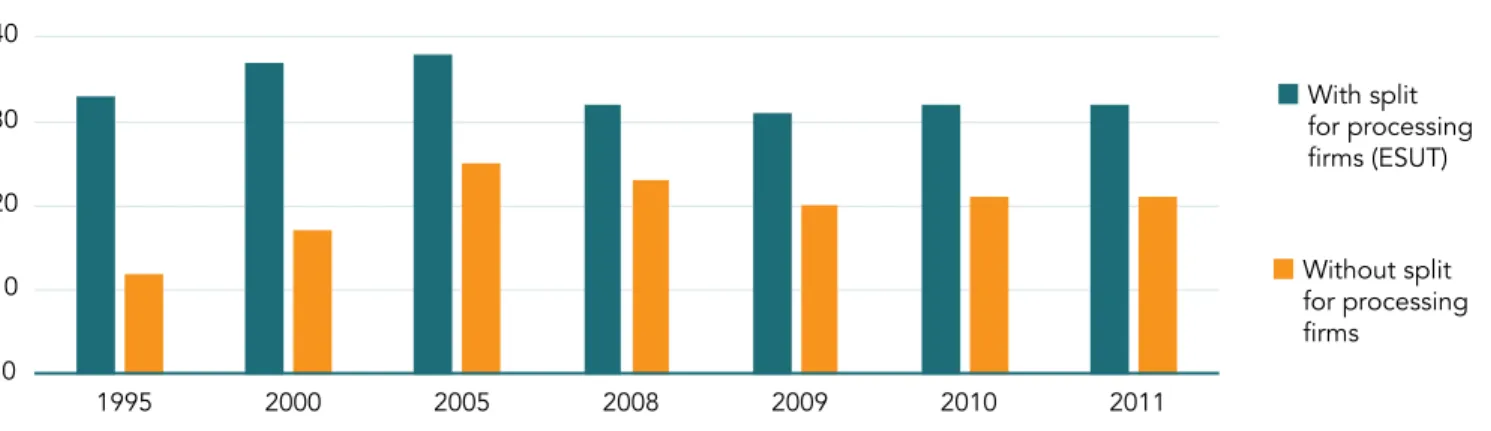
China has worked to develop extended supply-use tables that differentiate between three categories of firms – exporters oper-ating within the Customs Processing regime, other exporters, and non-exporters. Figure 8.3 below reveals significantly dif-ferent movements in the trend of the foreign content of China’s
FIGURE 8.3 Foreign value-added content of China’s exports
0 10 20 30 40 1995 2000 2005 2008 2009 2010 2011 With split for processing firms (ESUT) Without split for processing firms
exports over the last two decades when comparing esti-mates based on extended SUTs (referred to as ICIO) and pure national tables without a breakdown (referred to as national). Results for Mexico
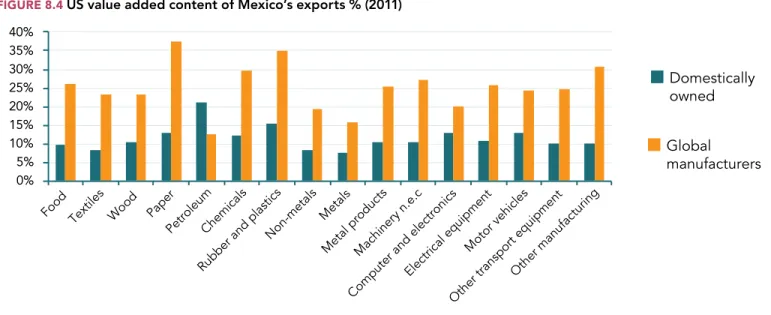
Mexico (Instituto Nacional de Estadística y Geografía – INEGI) have produced a categorization of firms referred to as global manufacturers10 that: a) import the majority of their purchases (imports account for at least 2/3 of their export value); b) produce only for exports; and c) are controlled by a foreign owner. These global firms were responsible for 55% of total
imported intermediate consumption and for 71% of gross exports of the Mexican manufacturing sector in 2008. Almost by definition the import content of Mexico’s global manufac-turing (GM) firms is significantly higher than comparable firms in the same sector. This can have a significant difference on highly policy relevant indicators, for example, on measures of the US content of Mexico’s exports (Figure 8.4), where one-quarter of the exports by GM firms in the motor vehicle sector reflect upstream US contributions, compared to around half that amount for non-GM firms; this relationship is seen across most activities.
FIGURE 8.5 Foreign content of US exports, % (2011) (selected industries)
0 5 10 15 20 25 30 Computer,electronic
and optical products machineryElectrical Motor vehicles Other transportequipment Total economy
Non-MNE
Domestic MNE
Foreign MNE
Source: Based on the US Extended SUT.
FIGURE 8.4 US value added content of Mexico’s exports % (2011)
Domestically
owned
Global
manufacturers
0% 5% 10% 15% 20% 25% 30% 35% 40%Food Textiles Wood Paper
PetroleumChemicals Rubber and plastics
Non-metals Metals
Metal productsMachinery n.e.c Computer and electronics
Electrical equipment Motor vehicles Other transport equipment
Other manufacturing
Results for the United States
The United States (Bureau of Economic Analysis) has developed Extended SUTs with a three-way classification of firms reflecting ownership structures, that differentiate between foreign-owned affiliates operating in the US, domestically-owned MNEs, and domestically-owned firms with no affiliates abroad.11 Results for the United States also reveal significant differences between the foreign content of exports across categories of firms defined by ownership structure. At the whole economy level the foreign con-tent of US exports by foreign-owned firms is almost twice that of domestically-owned non-MNEs. This partly reflects compositional effects, but the foreign content is higher across nearly all activities (Figure 8.5)
Results for Costa Rica
A similar picture of strong heterogeneity emerges for Costa Rica, whose ESUT differentiates between firms operating from free trade zones (referred to as RE in Figure 8.6) and firms operating outside of foreign trade zones (FTZs) (referred to as RD). The results show that RE firms have a higher import content of exports than RD firms across a range of important export activities.
Results for Canada
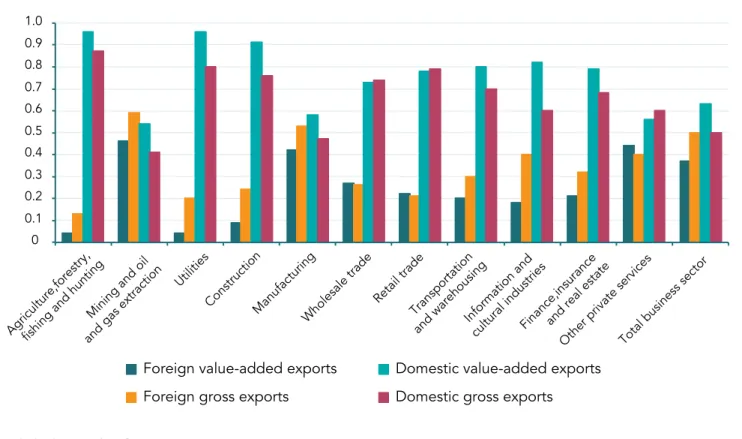
Results from a recent collaboration between the OECD and Statistics Canada reveal that the impact of compiling ESUT esti-mates for the business sector, accounting for either ownership or trading status, was an increase in the overall foreign value added content of Canada’s exports of 4 percentage points. Figure 8.7, which shows that foreign-owned firms are responsible for a lower share of exports in value-added terms than in gross terms, high-lights this higher propensity to import by foreign-owned firms, and, of course, the importance of capturing improved firm het-erogeneity in national SUTs.
Results for Nordic countries
In a recent collaboration between 5 Nordic countries (Denmark, Finland, Iceland, Norway and Sweden) and the OECD, the OECD developed extended SUTs with three variants of firm breakdown: • By size class: micro, small, medium and large, further broken down by whether the micro, small and medium firms were independent or part of a larger enterprise group.
• By trading status: non-traders, two-way traders, importers and exporters
FIGURE 8.6 Foreign content of Costa Rica’s exports, % (2012)
Total
RE
RD
0% 10% 20% 30% 40% 50% 60% 70% Agriculture Mining Food productsTextiles and apparelWood and paper Chemicals and minerals
Metals and metal products Machinery
Electrical equipmentTransport equipment
Wholesale, retail, hotels & restaurants
Transport and telecomsFinance and insurance Business services
Financial managementOffice support activities Other services
FIGURE 8.7 Share of gross and value-added exports by ownership status, % (2010), Canada
Agriculture,forestry, fishing and huntingand gas extractionMining and oil Utilities
ConstructionManufacturingWholesale trade Retail tradeTransportation
and warehousingInformation and cultural industriesFinance,insurance and real estate
Other private servicesTotal business sector 0.1 0 0.2 0.3 0.4 0.5 0.6 0.7 0.8 0.9 1.0
Foreign value-added exports
Foreign gross exports
Domestic value-added exports
Domestic gross exports
Source: OECD/Statistics Canada.
FIGURE 8.8 Exports in gross and value-added terms, % (2013), by ownership structure
0% 10% 20% 30% 40% 50% 60% 70% 80% 90% 100%
Gross exports Value added
of exports Gross exports Value added of exports Gross exports Value added of exports Gross exports Value added of exports
Denmark Finland Norway Sweden
Non-MNEs Non-MNEs, direct exports
Non-MNEs, indirect exports via other non-MNEs Non-MNEs, indirect exports via domestic MNEs Non-MNEs, indirect exports via foreign-owned MNEs Domestic MNEs
Foreign-owned MNEs
• By ownership status: non-MNEs, domestic MNEs and foreign MNEs.
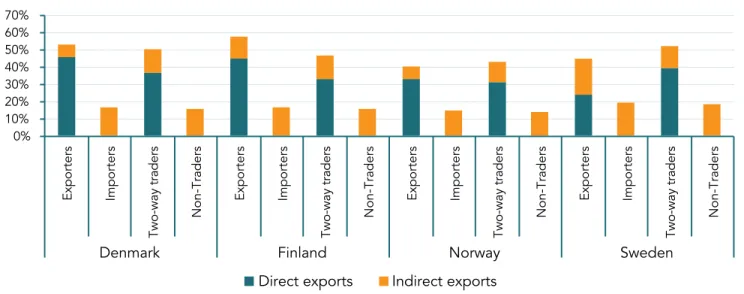
Highlights from this collaboration are presented below as Fig-ures 8.8-10. Figure 8.8 reveals the significant upstream integration of non-MNEs across all countries, compared to integration seen looking purely at gross trade relationships. Of particular note is the fact that in all countries bar Sweden this integration is primarily channeled via domestic MNEs; in Sweden the main link is through
foreign-owned MNEs, in large part reflecting scale. Figure 8.9 presents a similar picture showing the higher integration of smaller firms in GVCs when seen in value-added terms, through their upstream integration as suppliers to larger exporting firms. Figure 8.10 presents information on jobs sustained through inte-gration in GVCs. A significant insight from this presentation is the fact that even within firms that have no direct exports, around one in six of all jobs in these firms are dependent on foreign markets.
FIGURE 8.9 Exports in gross and value-added terms, % (2013), by size class
Gross exports Value added
of exports Gross exports Value added of exports Gross exports Value added of exports Gross exports Value added of exports
Independent - Micro Dependent - Small
Independent - Small Dependent - Medium
Independent - Medium Large
Dependent - Micro 0% 10% 20% 30% 40% 50% 60% 70% 80% 90% 100%
Denmark Finland Norway Sweden
Source: Nordic Countries in global value chains, 2017.
FIGURE 8.10 Jobs embodied in exports, % of total (2013), by trading status
0% 10% 20% 30% 40% 50% 60% 70% Exporters Importers Two-way traders Non-Traders Exporters Importers Two-way traders Non-Traders Exporters Importers Two-way traders Non-Traders Exporters Importers Two-way traders Non-Traders
Denmark
Finland
Norway
Sweden
Direct exports
Indirect exports
2.4 Concluding comments
The statistical challenges of globalization are profound, and it has become increasingly clear in recent years that conventional approaches used to understand how economies work can no longer rely solely on national statistics. Increasingly, in order to understand how economies work and how to target and create industrial policies focusing on competitiveness, it is necessary to see the whole. National statistics build pictures based on interrelationships between producers and consumers and the rest of the world. But these relationships, particularly those with the rest of the world, have become increasingly more complex, and, as such, there is an increasing need to consider global production within a global accounting framework. This implies a departure from the traditional role of international organi-zations as compilers of internationally comparable national statistics, such as national input-output or supply-use tables. Instead, it requires that they bring together these national tables to create a global table.
Although TiVA estimates have been able to shed important light on our understanding of international trade and its rela-tion to activity and competitiveness, in particular the impor-tance of recognizing the imporimpor-tance of imports to exports, and, so, the hitherto hidden costs of protectionism as well as the benefits of trade liberalization, particularly in services, they do not reveal the full picture. With significant shares of exports being driven by foreign affiliates, TiVA estimates have also revealed the importance of going beyond just value added towards income, in order to capture flows outside of conven-tional internaconven-tional trade statistics, such as the repatriation of profits related to the use of non-produced knowledge-based assets (e.g. brands) and, indeed, the repatriation of profits related to the use of produced knowledge-based assets (e.g. software) that are (often incorrectly) not recorded as receipts from exports of services.
The emergence of global value chains therefore also raises arguably profound questions about the way national statistics are currently compiled. In the same way that international orga-nizations increasingly need to think “national” in the way they present and compile their statistics, where “national” reflects the single economic territory comprising the “world” or large parts of it, national statistics institutions need to think global.
In other words, in the construction of national statistics greater emphasis is needed on the role of the rest of the world, both as a source of demand and supplier of demand but also with regards to the role of multinationals. This requires a rethink of the way that firms are currently aggregated within statistical information systems, to move beyond the classic aggregation based almost exclusively on industrial classification systems towards more meaningful aggregations that better reflect today’s “global factory”.
Such considerations are also essential not only to better understand the way that global production is today organized but also to better understand how investment drives global value chains, and in particular how that very same investment can lead to difficulties in interpreting trade flows as well as GDP.
Extended Supply-Use tables provide an effective tool to respond to these developments and growing needs. Increas-ing globalization of production raises challengIncreas-ing questions for national statistics. And fundamental and long-standing axioms regarding the nature of production and the way that statistics are necessarily compiled warrant a rethink. Certainly the evidence suggests that long-standing assumptions concerning homoge-neity of firms within industry classifications should be reviewed. The evidence also suggests, particularly for those countries with FATS and TEC data, that an optimal level of aggregation may be achievable without any significant increase in compilation or reporting burden. But, of course, such reconsiderations need also take into account constraints such as burdens and confidentiality.
Supply-Use tables have become the conventional route with which coherent estimates of the national accounts, trade and production are now systematically compiled in many countries and lend themselves as being the ideal way in which to resolve these issues. Extended Supply-Use tables can play a similar role in responding to questions on globalization.
Three final comments, providing a broader perspective, are worth making in this respect. The first concerns the quality of national supply-use tables. In many (most) countries, such tables are derived using a series of assumptions at least in some years, reflecting in part the often different periodic nature of the large number of datasets needed to construct SUTs. Many of these assumptions are based on some underlying view of stability and homogeneity in production functions. As shown, globalization is increasingly undermining the strength of these assumptions. Looking again how the homogeneity is likely to manifest itself across firms and creating SUTs based around these categori-zations of firms can greatly help to mitigate these effects and strengthen these assumptions, which will remain necessary, per-haps indefinitely, across most countries. As such, one important benefit of extended SUTs that should not be overlooked is their ability to improve the quality of the core accounts, and indeed GDP. In the same way they are also ideally placed to be able to significantly improve the interpretability of the accounts, in par-ticular, when the accounts are affected by phenomena related to globalization, such as relocations.
The second comment concerns the potential momentum extended SUTs could provide to the development and improve-ment of statistical business surveys. The evidence shows that significant heterogeneity exists across all categories of firms, and that the conventional stratification variables used in survey sampling (typically activity and size) may be sub-optimal. It may for example be necessary to include additional, but readily avail-able, stratification variables, pertaining for example to ownership (e.g. part of a foreign MNE, domestic MNE, an enterprise group, exporter, non-exporter) in designing tomorrow’s surveys.
The third comes back to the issue of the statistical unit. The current 2008 SNA preference for the establishment should not be a barrier to developing extended SUTs. If for example these can only be developed using a different statistical unit, then countries are strongly encouraged to consider doing so. There is an increasing recognition that the arguments for the current SNA
preference for the establishment have been weakened because of the changing nature of production and indeed because of the changes made in the SNA itself regarding economic ownership. This is further recognized in the 2008 SNA Research Agenda, where explicit references are made for the need to reconsider the establishment preference, taking into account the “basic source information” and changes in the underlying accounting principles of “Input-Output” tables, whose emphasis has moved from a physical perspective to an economic perspective.
3. A new look at trade in value-added
and global value chains: a view from the
consumption perspective – what the
accounting framework doesn’t tell you
3.1 OverviewIn the SNA the recommended price basis for producers, and so, de facto in input-output tables, consumers, is the concept of
Basic Price12. In very simple terms this is equivalent to the fac-tory gate price, and so excludes any distribution margin not sub-sumed in the original invoice price of the producer, and that are included in the price paid by the final consumer. Also excluded are any taxes paid or subsidies received on the product sold.
Although superficially benign, the distinction between basic and purchasers prices matters, especially for GVC analysis. Export prices are measured on a free on board (F.O.B.) basis and include any distribution services related to delivery from the factory gate to the port, and organized by the producer, but for input-output tables in basic prices (when these margins are sep-arately invoiced by the producer to the consumer or provided by an intermediary that purchases and then exports the goods) they are removed from the F.O.B. price and are instead re-allocated as separate exports of distribution services (typically recorded as output of transportation services and/or output of the retail/ wholesale sector).
On average these margins can be significant13, ranging at around 10 and 15% across countries, and over 30% in Greece, with significant differences by specific product, for example 140% and 216% for textiles and clothing in the United King-dom and Sweden respectively and 310% for pharmaceuticals in Greece (Figures 8.11A and B).
Moreover, with respect to international input-output tables, a focus on the distribution margin provided in delivering a good from the factory gate to the customs frontier understates the size of the problem related to the use of the basic price concept, as global input-output tables will also reallocate (to the distribution sector/product) the distribution margin related to the transpor-tation of the good from one frontier to another, and in turn the final distribution margin related to delivery from the frontier to the final consumer.
In effect input-output tables at basic prices treat distribution services as if they reflected the acquisition of a separate product. The rationale is that this creates an equivalence with prices paid by consumers when they independently organize the distribution
service (and which, by definition, are excluded from the F.O.B. price of the exported product, and indeed the cost, insurance and freight (C.I.F.) price of an imported product). But this con-vention is by no means a panacea.
Larger enterprises within affiliated supply chains for exam-ple are more likely (than independent smaller enterprises say) to include the costs of distribution in the basic price they charge (whether these are produced using in-house services or pur-chased from third parties), and so, in these circumstances, no adjustments will be made to arrive at a basic price estimate, which will be equivalent to the F.O.B. price. So, as can be seen, sometimes the distribution services are included in basic price measures and sometimes they are not, depending on how the original producer chose to invoice them.
But this is not the biggest issue here: the removal of the margin generates an alternative perspective of the value of what is being traded (and Figure 8.11A reveals that this can be sig-nificant) both from the exporting country’s perspective and the importing country’s (exacerbating complications raised by the fact that import prices typically also include international distri-bution margins).
For any given export of a good therefore, because the domes-tic content of distribution services is typically high, the share of domestic content of exports for a given good will be lower when measured on a basic price basis than compared to estimates on a F.O.B basis (although, in theory, for exports of total, whole econ-omy, goods and services, the ratios should align) (see, for example, Figure 8.12). Similarly looking at imports of a particular good into an economy, a basic price measure will show a significantly smaller (often implausibly low) contribution from the distribution and transportation sector, compared to C.I.F measures. Basic price concepts also complicate and hamper analyses of the multiplica-tive impact of tariffs, as, in a basic price format the rates, which are usually applicable to a C.I.F. price, will instead be applied to a lower basic price; this underestimates the overall impact of tariffs.
Figure 8.1314 reveals the impact that different price bases can have in interpreting the decomposition of value in GVCs by looking at the domestic services content of textiles exports. In the United Kingdom and Sweden for example the domestic services content jumps to around 70% compared to around 20% using the basic price concept. On average, across countries the domestic services content of exports increases by around 15 per-centage points.
Of particular interest in this respect is the contribution made by the distribution sector (transport, retail and wholesale) in the overall production of a given product, which is noticeably lower using the basic price concept (with well over half of the increase in domestic services value-added content reflecting distribution services in most countries).
The upshot is that by decoupling the distribution costs involved in transporting a good from the factory gate to the cus-toms frontier from the production costs of the good, the basic price concept creates an arguably downward-biased estimate of the overall contribution of exports of that good to the local economy. Exacerbating this downward bias is the fact that the
FIGURE 8.11 Factory gate to exporting country’s customs frontier, recorded distribution margins (% of basic price of recorded exports)
A: By product 0% 10% 20% 30% 40% 50% 60% 70% AgricultureForestry Fish Mining Food, beverages,tobacco
Textiles & clothingWood products Paper
Printing & recording Coke & refined petroleum
Chemicals
PharmaceuticalsRubber & plastic Other non-metallic minerals
Basic metals Fabricated metals Comp uter, e lectro nic & optic al Electrical equipment Machinery & eqpt n.e.c.
Motor vehicles
Other transport eqptOther manufacturing
310
91
216
120
179
Average across countries
Maximum across countries
B: By countryShare of of total exports
Minimum across products
Maximum across products
0% 10% 20% 30% 40% 50% 60% 70%
AustraliaAustriaBelgiumCanada ChileCzech Rep.DenmarkEstoniaFinland FranceGreeceHungaryIreland Italy Rep. of Korea
LithuaniaLatviaMexico
NetherlandsPortugalSlovak Rep.SloveniaSwedenTurkey
United KingdomUnited States
120
140 310
216
Note: Data for Australia refers to 2014, Austria 2012, Belgium 2010, Canada 2013, Chile 2015, Czech Republic 2017, Denmark 2014, Estonia 2014, Finland 2014,
France 2014, Greece 2010, Hungary 2014, Ireland 2011, Italy 2014, Republic of Korea 2010, Lithuania 2014, Latvia 2010, Mexico 2013, Netherlands 2014, Portugal 2013, Slovak Republic 2012, Slovenia 2015, Sweden 2015, Turkey 2012, United Kingdom 2010, United States 2016.
basic price of the exported good will include all upstream distri-bution costs incurred in the production of that good, including cross-border distribution costs on intermediate imports used in production. So, in other words, distribution costs incurred in pro-ducing a good for export will be reflected in the basic price of that good when they relate to intermediate parts shipped within the country or imported into the country but, typically, not when they relate to transportation of the goods to the customs frontier.
In addition, the concept proves problematic for notions of international competitiveness, as the basic price concept de facto gives the impression that countries are engaged in signif-icant direct exports of these distribution activities, as any distri-bution costs related to the transport of a good from the factory gate to the customs frontier will be treated as if they were direct exports of separate distribution services. For example, a country may have restrictions on the provision of these services by for-eign operators, as well as high relative prices that are absorbed only through the increased international competitiveness of goods-producing sectors purchasing these distribution services. This country is more likely than not to reveal relatively higher measures of revealed comparative advantages (when measured on the conventional gross basis) in the distribution sector and relatively lower in the goods producing sector, when the com-plete opposite is the more likely scenario.
FIGURE 8.13 Domestic services value-added content of textiles exports (basic versus F O B prices)
Australia BelgiumCanada Chile Czech Republic DenmarkEstoniaFranceGreeceHungaryIreland Italy Rep. of Korea Latvia LithuaniaMexico Netherlands Poland Slovak Republic SloveniaSwedenTurkey United Kingdom Austria United States 0% 10% 20% 30% 40% 50% 60% 70% 80%
Basic
F.O.B
Note: Data for Australia are 2014, Austria 2012, Belgium 2010, Canada 2013, Chile 2015, Czech Republic 2017, Denmark 2014, Estonia 2014, France 2014, Greece
2010, Hungary 2014, Ireland 2011. Italy 2014, Republic of Korea 2010, Latvia 2010, Lithuania 2014, Mexico 2013, Netherlands 2014, Poland 2013, Slovak Republic 2012, Slovenia 2015, Sweden 2015, Turkey 2012, United Kingdom 2010, United States 2016.
Source: OECD Supply-Use table database and OECD-WTO TiVA.
FIGURE 8.12 International transportation margins
on US imports 0 10 20 30 40 50 60 70 0 0,2 0,4 0,6 0,8 1 1,2
Thousands of product/country entries
CIF minus FOB margin as a share of CIF price
Source: OECD International Transport and Insurance Costs of Merchandise
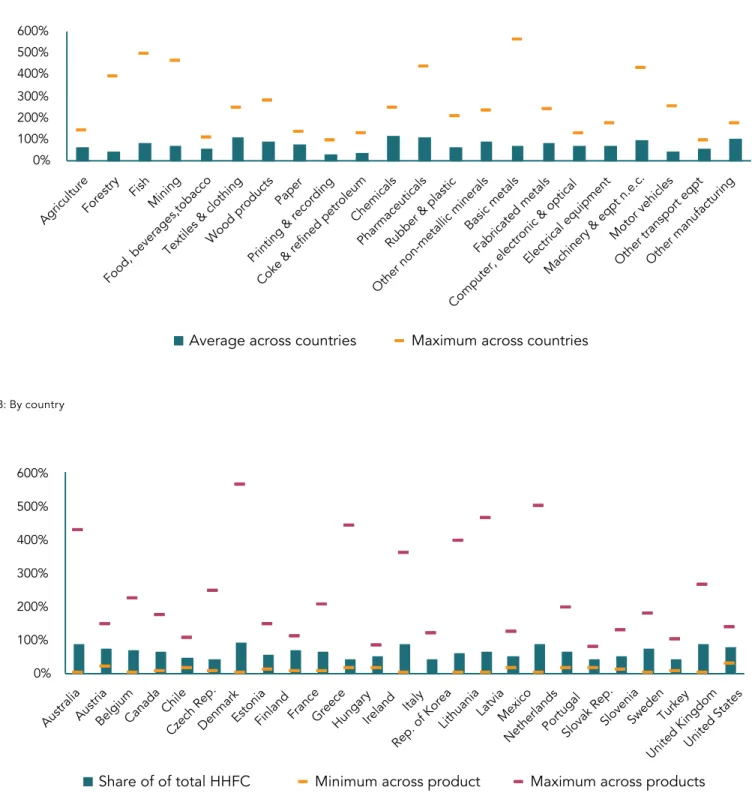
FIGURE 8.14 Margins on household final consumption, % of basic price A: By product AgricultureForestry Fish Mining Food, beverages,tobacco
Textiles & clothingWood products Paper
Printing & recording Coke & refined petroleum
Chemicals
PharmaceuticalsRubber & plastic Other non-metallic minerals
Basic metals Fabricated metals
Computer, electronic & optical Electrical equipment
Machinery & eqpt n.e.c. Motor vehicles
Other transport eqptOther manufacturing
Average across countries
Maximum across countries
0% 100% 200% 300% 400% 500% 600% B: By country 0% 100% 200% 300% 400% 500% 600%
Share of of total HHFC
Minimum across product
Maximum across products
AustraliaAustriaBelgiumCanada ChileCzech Rep.DenmarkEstoniaFinland FranceGreeceHungaryIreland Italy Rep. of Korea
LithuaniaLatviaMexico
NetherlandsPortugalSlovak Rep.
SloveniaSwedenTurkey
United KingdomUnited States
Note: Data for Australia are 2014, Austria 2012, Belgium 2010, Canada 2013, Chile 2015, Czech Republic 2017, Denmark 2014, Estonia 2014, Finland 2014, France
2014, Greece 2010, Hungary 2014, Italy 2014, Republic of Korea 2010, Lithuania 2014, Latvia 2010, Mexico 2013, Netherlands 2014, Portugal 2013, Slovak Repub-lic 2012, Slovenia 2015, Sweden 2015, Turkey 2012, United Kingdom 2010, United States 2016.
But it is equally important to note that this is not only an issue for decompositions of exports into their sources of value added. It affects all components of demand. For estimates of intermedi-ate consumption (or rather the coefficients of the Leontief matrix) the effects are mitigated by the fact that the distribution costs will always be captured in the costs of production of a good, whether embodied in the price of any intermediate used in pro-duction or treated as a separate cost. This reflects the fact that intermediate consumption totals are always measured at market prices even if the components are recorded in basic prices.
In other words, Leontief coefficients provide a theoretically correct view of the upstream impact of the production of a given good, but only when the application is to determine the full upstream impact of production as opposed to consumption. All current TiVA estimates align with this production view, but many of the applications are in fact looking at things from a consump-tion perspective. But in basic price Leontief systems, distribuconsump-tion margins provided by an intermediary (such as a retailer) or mar-gins that are not part of an all-inclusive price charged directly by the producer, are stripped out of the consumption (market) price. Not surprisingly, these charges can make a significant difference to the overall price of a good (see Figure 8.14).
For products, taking an average across countries’ margins adds (a low of) 31% to the basic price of printing products and (a high of) 113% for textile and chemical products (and 560% for basic metal products in Denmark). For countries, looking at total consumption of goods in basic prices, margins add a further 41% in Slovakia to 92% in Denmark.
None of that is to say that basic price approaches are with-out merit. Far from it, as they provide the conceptually correct view of the decomposition of costs from a production perspec-tive. Moreover, as described below, they are also significantly easier to calculate from current national accounting systems than decompositions based on market price concepts.
But it is clear that some care is needed in interpretation. As shown above, for analyses of global value chains, taking a per-spective from purchasers’ prices rather than basic prices can present a significantly different picture of GVCs, for example concerning the contribution to the domestic economy of exports of a given product. But the purchaser’s prices concept is perhaps also preferable in the derivation of other conventional analyses and metrics that rely on input-output based indicators. Perhaps chief in this respect concerns analyses of the now well-known Smile Curve, which is looked at in the following section.
3.2 Looking anew at the Smile Curve
Although, at least in recent years, there has been an improved understanding of the limits of GVC analyses that look at fragmen-tation of production through the prism of Stan Shih’s Smile Curve, even with these limits it remains an important looking glass.
A greater awareness that conventional statistics concerning fragmentation of production reflect the basic price rather than the market price concept can further help improve our under-standing and limitations of basic price measures.
A simple way to illustrate shortcomings in current measures, and in particular the basic price concept, is to reconsider how they reflect single case studies, indeed case studies that have acted as motivators for much of the work, and new statistics on GVCs, that exists today.
Perhaps the most well-known of these is Dedrick et al.’s sem-inal 2008 work looking at the decomposition of value creation in an iPod (Table 8.1).
As noted in their study, the factory gate price (roughly equivalent to what would be recorded in trade statistics) was less than half the total retail price, and, indeed, Apple’s con-tribution (measured as its gross profit), and compensation for design, marketing and research and development, is com-pletely absent from the factory gate price.
In this sense therefore any attempt to assess the full value chain, including Apple’s contribution, by decomposing only the factory gate price, will be severely compromised as the high-value activities, R&D and design (which are generally positioned at the beginning of the value chain, Figure 8.15) and marketing and distribution (at the end of the chain) are com-pletely absent from the decomposition. This is what is de facto done in decompositions of value using input-output tables at basic prices, because, as noted above, the contribution from distribution services, and very often R&D, marketing and design are shown as separate expenditure items also in basic prices.
An underappreciation of this shortcoming in the basic price concept for GVC analyses of lengths and positions of activities in value chains is widespread in the literature. For example, Degain
et al. (2017)’s otherwise excellent paper “Recent trends in global
trade and global value chains” provides a decomposition of value added, showing the contribution made by various indus-tries and counindus-tries relative to their distance from the consumer and by their relative compensation per hour.
Intuitively, all of their charts plotting relationships for various products (see below Figure 8.16, the example for China’s elec-trical and optical equipment) show distribution activities (clas-sified as industry 20 in the Figure) close to the consumer (with relatively high labor costs), where Degain et al. explain: “Post-fabrication service industries with higher labor compensation per hour – such as wholesale (20) and inland transportation (23) in
TABLE 8.1 Derivation of Apple’s gross margin on 30GB
video iPod
Retail Price $299
Distributor Discount (10%) ($30)
Retailer Discount ($45)
Sub-total (estimated wholesale price) $224
Factory Cost $144
Estimated Apple gross profit $80
FIGURE 8.15 Conceptual framework of the Smile Curve
Marketing
Knowledge
R&D
Knowledge
Value AddedLocation 1 Location 2 Location 3 Location 4 Location 5
Inputs Markets
Basic and applied
R&D, Design,
Commercialization
Manufacturing,
Standardized
services
Marketing, Advertising
and Brand management,
Specialized logistics,
After-sales services
Source: Mudambi, 2008.17
FIGURE 8.16 Smile Curve for China’s exports of electrical and optical equipment, 2009 (basic prices)
Compensation per hour ($)
the United States, Japan, Germany, and France – were the main beneficiaries in the postfabrication stage of this GVC. China’s ICT goods exported to the United States, Japan, and Germany had to be delivered to their domestic consumers mainly through those countries’ domestic wholesale and transportation service industries.”
However, therein (the bolded text) lies the misunderstanding between the basic price and market price concept. Decomposi-tions of the value of a good purchased as final domestic demand into source industries using input-output tables in basic prices do not capture the:
• final contribution made by domestic wholesale and transpor-tation service providers delivering an import to final domestic consumers;
• international distribution costs involved in shipping the good into the country; nor indeed the
• shipping costs from the factory to the customs frontier of the exporting country.
This is why Degain et al. estimate the contribution of the dis-tribution activities at generally no greater than 20%, while this chapter finds significantly higher estimates (around 40% when the decomposition is for an export, as in Figure 8.13, and signifi-cantly higher when the decomposition relates to the price paid by the final consumer, as in Figure 8.14).
To re-emphasize, what decompositions in basic prices do cap-ture (at least in theory) is the contribution of distribution activ-ities related to transactions in intermediates, before the very last transaction recorded in input-output tables at basic prices. So, for example, they include any distribution activities related to the intermediate consumption of any firm (whether those intermediates were imported, in which case decompositions would include any related international distribution margin, or produced domestically). This is because the production func-tion (input-output coefficients) of any given industry will always show total intermediate consumption at market prices, even if all the separate components are broken down into basic price components. However, these decompositions will not capture any distribution margins related to final demand transactions (whether household final consumption, general government final consumption – although in practice this is not generally an issue as in most countries general government final consumption only records transactions in services – capital formation or, indeed, exports, including exports of intermediates).
This reveals another potential problem with analyses that present the position of these distribution activities within global value chains. In all of these studies distribution activities find themselves positioned very close to the final consumer. This is, of course, an accurate reflection of their overall positions when seen as a whole (i.e. in market prices), as an overall view would include the distribution services provided to final domestic demand (household and government consumption, consumption of non-profit institutions serving households, and capital forma-tion). However, this is not an accurate reflection of the position of these activities when they refer to the provision of distribu-tion services used to service intermediate flows – in other words
it is not an accurate representation of the position of distribu-tion services when decomposing basic prices. Indeed it stands to reason that for very fragmented chains, distribution services would be needed throughout the production process and, so, would be further away from the consumer than retail distribution services (which are almost entirely related to the provision of ser-vices to final demand consumers). It is only because, in practice, estimates of the position of distribution services (i.e. distance to consumer) are calculated for the sector as a whole that results in distribution services appearing close to consumers. This reflects the fact that distribution services provided to final consumers make up the majority of overall distribution services, and, so, swamp results for the overall position of the sector. This some-what intuitive result appears to have led many to conclude that the distribution service component in decompositions of basic prices reflects the final distribution service at the end of the chain – but this is not the case.
3.3 Marketing, design and R&D services
Thus, an aggregated view of the position of the distribution sector in global value chains is unlikely to accurately reflect the position of intermediate services in a given production process when input-output tables used decompositions in basic prices. But, because the remuneration for marketing, design and R&D services is also often bundled within the final distribution margin, our understanding of the contribution of other underlying activ-ities – recorded as distribution activactiv-ities – may be similarly affected, i.e. their position in global value chains, estimated using input-output tables, may not necessarily align with where they appear in the physical production process.18
This is particularly relevant for the position of high-value tasks such as research and development and design. These should of course appear at the beginning of the production process, but where they appear in input-output based estimates depends greatly on a number of factors. Chiefly these relate to whether these activities are conducted by separate production entities or whether they are conducted within the firm. Further complicat-ing matters is the industrial classification of the firm itself, dis-cussed in more detail below.
If the R&D and design activities are conducted by separate units classified to these specific activities in input-output tables, then input-output based approaches will be able to capture their appropriate position and indeed value contribution within GVCs. However, often these activities are conducted in-house for which there is no observable transaction, and in these cases their con-tribution is included within the value added of the main activity of the firm. For example, a retailer may outsource production of clothing, but the value generated through brand, design, and R&D may instead (and often) appear as distribution margin. Input-output based measures will therefore record (but not sep-arately) the positions of the underlying R&D and design activi-ties in the same position as the firm’s main activity (distribution), which will not typically be at the beginning of the value chain.19 This of course is not an issue unique to these types of tasks; any in-house activity not separately identifiable in input-output
tables is treated in this way (as are secondary activities that are separately identifiable when input-output tables are con-structed on an industry by industry as opposed to product by product basis).
But whilst this is a more generic problem with input-out-put tables, it is perhaps most pertinent when it comes to R&D, design and marketing activities, where in-house production remains significant (certainly when considering the very high distribution margins on exports seen in Figures 8.11A and B). Further exacerbating this is the increasing importance within global value chains of factory-less producers, who outsource physical production whether at home or abroad, but control the overall production process (focusing control on activities such as specification, design, R&D, marketing), which to some extent is a reflection of the upgrading process underpinning GVCs.
Current international standards for the classification of firms (ISIC Rev 4) classify factory-less firms that own no material inter-mediate inputs in the production process to the distribution sector. As such the value added by these factory-less firms will materialize in input-output tables as distribution margins, and, so, are allocated to a separate activity to the good being pro-duced when input-output tables are recorded in basic prices. In other words the value of the goods (whose production and sales are controlled by these firms) will reflect the (contractor’s) factory-gate price but these prices will not include the intellec-tual property, design, brand etc. owned by the factory-less firm. These will instead materialize in the wholesale prices the firm charges to other intermediaries or indeed the final retail price if the factory-less firm sells the products through its own chain of retailers.
Further complicating matters, factory-less firms that own some material intermediate inputs (even if they have no actual role in the physical transformation of those inputs) are classi-fied to the activity of the good being produced. In these cir-cumstances input-output tables should record transactions between the factory-less firm and its contractors following the recommendations for the treatment of goods for processing transactions in the System of National Accounts. But in practice this may not be the case, especially if the value of the material intermediate inputs purchased by the principal is marginal, in which case national accountants may instead choose to record the output of the principal as if it were a distribution service, (i.e. excludes the factory gate price of the good) even if the industry of the principal remains classified to manufacturing.
Following the example of the iPod above therefore, input-output tables that decompose the basic price value of the iPod will not record the contribution from Apple’s R&D, design, brand etc. to the good itself if Apple is classified as a distributor (e.g. as a factory-less firm, in which case the contri-bution will be shown separately under consumption of distri-bution margins) and may not do so in practice even if Apple is classified as a manufacturer. Whatever the classification, any retail margins incurred by final demand consumers, whether charged by independent retailers or Apple stores, will never be included in the decomposition of the basic price. In other
words, decompositions of goods in basic prices (and in particu-lar hi-tech goods) may, in practice, typically significantly under-estimate the contribution of R&D, marketing, design etc. to the production process (as they will instead be recorded as a sepa-rate transaction of “direct” purchases of distribution services).
3.4 A new perspective on the role of imports
Another area, among many, where a purchaser’s price perspec-tive can provide an important complementary view to a basic price concept concerns the role of imports. One highly sensi-tive indicator produced in TiVA-type analysis is the domestic content of a country’s imports, typically used to highlight the potentially counter-productive impact of tariffs as they may affect upstream domestic exporters. In the United States, the US content of its total goods imports amounts to, on average, 6% in recent years (Figure 8.17). But bringing the imports into the country, in turn, generates distribution services, whether the imports are for intermediate consumption, final domestic consumption, or indeed for direct re-exports.20
Conventional input-output approaches, using the basic price concept, de facto decouple and break the link between these costs and the imported good. But a purchasers’ price approach treats the distribution services as integral, revealing, in turn, much higher US “dependencies” (or US “content”) of its imports. Indeed changing the price basis, and decompos-ing the purchasers price value of an imported good reveals that the US content of its total goods imports (or rather the US val-ue-added generated by consumption of imports) amounted to 30%21 of the overall price of those imports (excluding any con-sumption taxes). For imports of textiles, the US content was as high as 50% for consumption by US households and 20% for exports, compared to the 3% shown in TiVA.
Indeed, the total value of distribution margins provided by US domestic operators in taking imports from the customs fron-tier to their next destination (to industries, final consumers, or as re-exports) amounted to close to 900 billion USD dollars in 2016, equivalent to 5% of GDP. In value-added terms, as the distribution sector also requires imports for production, dis-tribution activities added 840 USD billion to US GDP in 2016 on account of transportation and sales of imports, supporting 9 million jobs, including 6.3 million in the wholesale and retail sector, and 1.0 million in the transportation sector, with signifi-cant contributions from upstream industries (0.2 million in man-ufacturing, and 1.6 million in all other activities) (Figure 8.18).
In many other countries the contribution of distribution services (as recorded in official supply-use statistics) to the domestic economy through sales of imports is significantly higher (Figure 8.19). Unsurprisingly, the contribution is larger, the smaller the economy (and the higher the dependency on imports). In Lithuania for example, where gross imports were equivalent to 78% of GDP in 2014, and the value added of the distribution and transportation sectors accounted for 28% of GDP, the domestic value added generated through sales of imports in the economy accounted for 22% of GDP. Of partic-ular interest is the contribution to GDP made via distribution
FIGURE 8.17 US value-added content of imports at the frontier (% of basic price) and as percent of consumer’s price (excluding taxes) (2016)
At the frontier (Basic Price)
Intermediate Consumption (inc margins)
HHFC (inc margins)
Exports (inc margins)
Total all goods all consumers (inc margins)
Total goodsAgriculture
Mining Food Textiles
Wood etcPaper etc
Petroleum etcCheminals Rubber
Other non metalsFabricated metals Metals
Computer etc Electrical equipment
Machinery and equipment Motor vehicles Othe r tran spor t equ ipmen t Other manufacturing 0% 10% 20% 30% 40% 50% 60%
Note: MHHFC, Household final consumption.
Source: Calculations based on OECD-WTO TiVA and OECD Supply-Use Table database.
FIGURE 8.18 Jobs supported and value added via sales and export of imports in the US, by source (2016)
0 100 200 300 400 500 600 0 1 2 3 4 5 6 7 Import content
of distribution Manufacturing Transportation Other activities Wholesale, retail