CHUGOKUGAKUENJ. 2002 Vol. 1, pp. 19-25 Copyright©2002 by Chugokugakuen
Original Article
CHUGOKUGAKUEN Journal http://www.cjc.ac.jp/The Relation of Bone Mass to Physical Constitution,
Physical Strength and Dietary Intake
in Female. Students of a Junior College
Sanae Ko
Department of Human NutritWn, Faculty of Contemporary Life Scieoce, Chugokugakuen University, Okayama 701-0197, Japan
Female, junior college students reach the stage of peak bone mass and stand at an important turning point of bone mass maintenance when these enter college. In the present paper, measure-ment of bone mass of female students at a junior college was performed by the quantitative ultrasound (QUS) method (the measured values are expressed as osteosono-assessment indexes or OSIs) in association with the measurement of bone mass-influencing factors such as physical constitution (height, weight, body mass index), physical strength (maximum oxygen intake, grasp power), number of steps per day and survey of dietary intake. We compared these parameters between the low and high OSI groups and between the low and standard body mass index (EMI) groups. The results are: (1) Seventy percent of all subjects had a T score lower than 100. This means that the bone mass in the female college students studied tends to have generally lower values than the standard (an average of OSI of female young adults). (2) Twenty seven percent of the subjects had a EMI lower than 18.5 which was lower than the standard EM!. The OSI of the low EMI group was significantly lower than that of the standard EMI group. Positive correlations between the OSI and EMI in the high OSI group and also in all the subjects were observed. (3) Physical constitution, physical strength and number of steps of the subjects were not significantly different between the low and high OSI groups. However, the low EMI group had 2,000 fewer steps per day than that of the standard EMI group indicating low daily activity in the low EMI group. (4) Comparison of intake of foods classified by food groups between the low and high OSI groups indicated that there was a significant difference between meats and potatoes intakes. Intakes of milks, fishs, beans and fruits were high in the high OSI group suggesting that nutritional consideration was a factor in the high OSI group. (5) The low EMI group had a high intake of snacks, favorite soft drinks, fruits and milks, and a low intake of vegetables and seaweeds. A tendency of deviated food habit was observed.
Key Words: Bone mass, BMI, Dietary intake
Introduction
Osteoporosis is a common bone disorder characterized by reduction in bone mass sufficient to render the skeleton fragile and vulnerable to fracture [1]. The complications of the osteoporosis such as compression micro fractures
of the vertebrate lead to lasting low-back pain, lordosis and accompanying functional disorder of intestinal and/or respiratory organs. Fracture of the femoral neck fre-quently caused by osteoporosis causes trouble in standing posture and gait. These are major cause in the lowering of activity of daily living (ADL) in older populations.
Further more, after the fracture in the femoral neck, older populations condition frequently worsens to bed-ridden status and their quality of life (QOL) seriously declines [2J. Thus the prevention of the fracture is very important.
Bone density of females shows a steep rise from the early teens and reaches its maximum in the late teens. The basis of prevention of osteoporosis and fracture caused by the osteoporosis is to heighten the maximum bone density attained in the late teens as much as possible and then slow down the later decrease of bone density by improving their life style.
Female junior college students having already reached their maximum bone density are placed at the starting line of the gradual decrease of bone mass. Therefore, in preventing osteoporosis in later stage of life, it is impor-tant to improve their life style at this stage of life and to sustain the improved life style to reduce the loss of bone mass as much as possible. However, female students at this age do not pay so much attention to health, and live an unfavorable life style by keeping late hours and skip-ping morning meals [3, 4J. They strongly desire a slim body and the social phenomena "diet boom" has caused an increase of young females with low body weight in the population. [4J. The situation is getting serious. Although there is an intimate relationship between low weight and low bone mass and as such low weight is one of the risk factors of osteoporosis, few previous reports on bone density of female students exist concerning the analysis of low weight populations. In the present paper, therefore, we focused our study on bone mass and factors that influence bone mass such as physical constitution, physical strength and food intake status. We also tried to grasp the characteristics of the life style of this age group.
Subjects and methods
AOS-100 (Aloca Co., Ltd., Japan). The osteosono-assessment index (OSI) which was calculated from propa-gation speed of ultrasound (SOS) through the calcaneus and transmission index (TI) by the formula, [SOS2X TI], was used as an index of bone mass. In order to evaluate measured OSI, an average OSI (YAM, young adult mean; 2.799X 10⁶
) of female young adult (20-44
years old) [6J was used as the standard. Percentage to the YAM (2.799X 10⁶
) is expressed as T score. In the
present paper, OSIs are expressed in units of millions(X 106
).
3.
Measurements of physical constitution,
physical strength and others
Height and weight were measured by using a height scale with weight scale (TANITA Co. Ltd., Japan). The weight of clothing was estimated to be 1 kg, and the value was subtracted from the weight of clothed person. BMI (body mass index) was calculated according to the for-mula, weight (kg)/height (m)2. We measured the maxi-mum oxygen intake (abbreviated asV02max) by a bicycle ergometer· as an index of systemic durability (staying power), the grasping power (twice in both hands and took the maximum value) as an index of muscle power, and number of steps by a pedometer as an index of physical activity (measured on three successive week days and calculated average steps per day).
4. Investigation of food ingestion status
Investigation sheets (questionnaire) of dietary intake (diet survey) for preventing life style-related disease were purchased from Top Business Co., Ltd.,· Japan, and used for the diet survey. Analysis of the results was performed using an original totalization software package,
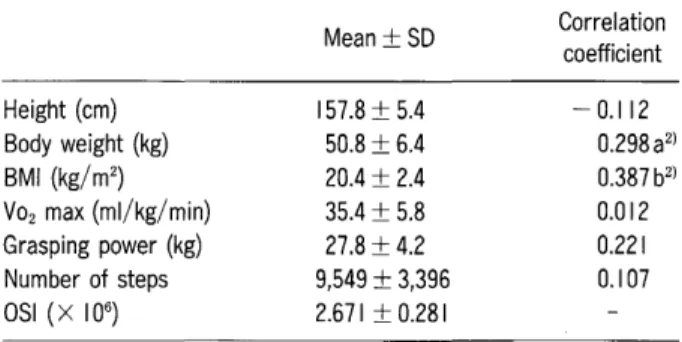
Table I Base line features of physical constitution, physical strength and osteosono-assessment index (OSI) of the study subjects, and correlation coefficient between measured values of each item and OSI1
)
l)The subjects were60 female students in a junior college. Z)a: p<0.05; b: p<O.OI.
1. Subjects
The subjects who participated in this study were 90 female students who are registered in the second year of Department of Human Nutrition at Chugoku Junior College. In this report we used the data of 60 female students from whom we were able to get available data for
all the items measured.
2. Bone mass analysis
Bone mass was measured at the right calcaneus with the quantitative ultrasound method (QUS) by using
Height (cm) Body weight (kg) BMI (kg/mZ ) Vozmax (ml/kg/ min) Grasping power (kg) Number of steps OSI (x106) Mean±SD 157.8±5.4 50.8±6.4 20.4±2.4 35.4±5.8 27.8±4.2 9,549±3,396 2.671 ±0.281 Correlation coefficient -0.112 0.298aZ) 0.387 bZ) 0.012 0.221 0.107
15.5 16.5 17.5 18.5 19.5 20.5 21.5 22.5 23.5 24.5 25.5
BMI
WELLNESE /win2, provided by the Top Business Co., Ltd. We had subjects (female students) choose intake
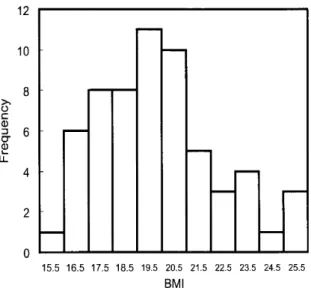
Fig. I Distribution of body mass index (8MI) of junior college students. The subjects were 60 female students in a junior college. The 8Mls were distributed between 15.82 (the minimum value) and 26.14 (the maximum value). Twenty seven percent of them was low weight (8MI lower than 18.5), and 5% of them obesity (8MI higher than 25). 12 10 8 ~ c Q)
5-
6 ~ LL 4 2o
I " " " -I - ---
-frequency of foods (from the set 77 types of foods including processed foods) with 9 grades from grade 1 (almost no intake) to grade 9 (intake 3 times per day). The result was processed on WELLESE /win2 soft-ware, and food intake amount classifIed by food groups was measured.
5. Statistical analysis
Comparison of average values was done with a significance test of the Student's t-test. Correlation coefficient was performed with Pearson correlation analy-sis. Both tests were done with significance level of 5%or 1%. These statistical analyses were conducted by using Excel Statistics 2000.
Results
1. Physical constitution and bone mass
Mean values and standard deviations of physical constitution and bone mass of the 60 subjects, including BMI, VOzmax and OSI, are shown in Table 1. Figs. 1
and 2 show histograms of BMI and OSI, respectively. Averages with standard deviations of height and weight of the subjects were 157.8
±
5.4 cm and 50.8±
6.4 kg, respectively. These data almost conform with the data (157.8 cm and 51.8 kg) of the national nutrition survey1.95 2.11 2.27 2.43 2.59 2.75 2.91 3.07 3.23 3.39 3.55 4 y=O.0445x+ 1.7624 r=O.3869 (p<O.01)
•
3.4•
•
••
..,.
...
en 2.8••
•
a••
."
•
.
2.2IIlII•••
•
l " " " I " " " i-r
I 4 14 10 12 2 oFig. 3 Relationship between osteosono-assessment index (OSI) and body mass index (8M I). The subjects were 60 female students in a junior college. The OSI values are expressed under the unit of million (X 106).
OSI
Fig. 2 Distribution of osteosono-assessment index (OSI) of junior college students. The subjects were 60 female students in a junior college. The OSI values are expressed under the unit of million(x 106). The OSls of them showed the normal distribution between 1.951 (the minimum value) and 3.560 (the maximum value). The standard value of OSI (young adult mean) is 2.799(X 106
). Seventy percent of the subjects was less than the standard.
1.6
12 16 20
BMI
1999 [5J For the same age (19-20 years old) and indicate that the subjects had average physical constitution. Average and standard deviation of the BMIs were 20.39
±
2.44. When the subjects were classifIed accord-ing to the obesity judgment standard of Japanese Society of Obesity, 26.7% (16 people) of them were low weight (BMI lower than 18.5), 68.3% (41 people) of standard weight (BMI within higher than 18.5 and lower than 25), and 5% (3 people) obese (BMI higher than 25).The average and standard deviation of values of bone mass index were 2.671
±
0.281, and the average of T score (ratio to YAM) was 95.4. When the subjects were classifIed according to the osteoporosis judgment standard of AOS-100 [6J, 68.3% of them had a T score higher than 90 (no abnormality), 30.0% had a T score within the higher than 80 and lower than 90 range (necessary to be under instruction), and 1.7% had a T score within the lower than 80 and higher than 70 range (necessary to be under the scrutinization). When the correlation coefficients of their OSIs to height, weight and BMI were calculated, signifIcant positive correlation was observed between the OSI and BM1 (r= 0.3869, p<
0.01) (Table 1, Fig. 3). Weak, positive correlation between the OSI and weight was observed (r= 2.981, p<
0.05). There was no correlation between OSI and height (r=-
0.112, ns).From the results of OSI measurement, the subjects were divided into a low OSI group (OSI lower than 2.519= T score lower than 90, 19 people), a high OSI
group (OSI higher than 2.799= T score higher than 100, 19 people), and a medium OSI group (T score between higher than 90 and lower than 100, 22 people). Among the three 'groups, the low OSI group and high OSI group were compared. Because there were many low BMI subjects, a comparison between the low BMI group (BMI lower than 18.5, 16 people) and standard BMI group (BMI higher than 18.5, 44 persons) was also conducted. In this case, 3 people having higher BMI than 25 were included in the standard BMI group (Table 2). Overlap-ping between inter groups were 3 subjects belonging to the low BMI andlow OSI group, and 4 subjects belong-ing to the low BMI and high OSI group.
Comparison of physical constitution between two (low and high) OSI groups indicates that height, weight and BMI have no signifIcant difference (Table 2). On the other hand, comparison between the low and standard BMI groups shows signifIcant difference in weight (p
<
0.01); the weight difference was 8 kg. There was no signifIcant height difference between the two BMI groups (Table 2).The OSI signifIcantly correlated to the BMI (r=
0.691, p
<
0.01) in the high OS1 group. However, no correlation was observed between the OSI and BMI in the low OSI group (r= 0.047, ns). Neither the low or standard BMI group correlated to OSIs.2. Physical strength and others
Baseline features of the study subjects are shown in Table 1. Comparison of the physical strength between
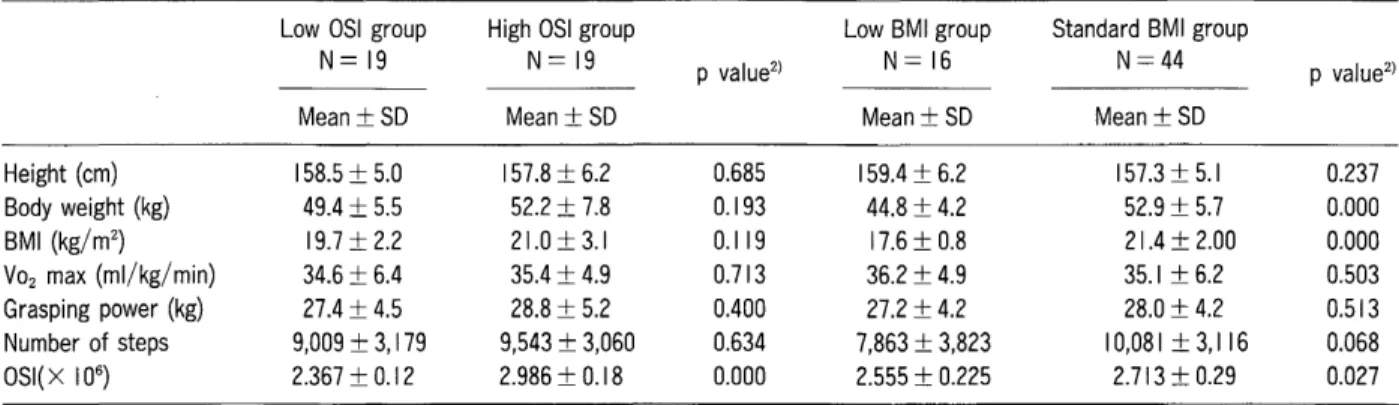
Table 2 Comparisons of physical constitution, physical strength and 8MI between low and high OSI groups, or between low and standard 8MI groupsl)
Low OSI group High OSI group Low 8MI group Standard 8MI group
N=19 N=19 p value2
) N=16 N=44 p value2)
Mean±SD Mean±SD Mean±SD Mean±SD
Height (cm) 158.5 ± 5.0 157.8 ± 6.2 0.685 159.4 ± 6.2 157.3±5.1 0.237 80dy weight (kg) 49.4 ± 5.5 52.2 ± 7.8 0.193 44.8 ± 4.2 52.9 ± 5.7 0.000 8MI (kg/m2 ) 19.7 ± 2.2 21.0± 3.1 0.119 17.6 ± 0.8 21.4 ± 2.00 0.000 V02 max (ml/kg/ min) 34.6 ± 6.4 35.4 ± 4.9 0.713 36.2 ± 4.9 35.1 ± 6.2 0.503 Grasping power (kg) 27.4 ± 4.5 28.8 ± 5.2 0.400 27.2 ± 4.2 28.0 ± 4.2 0.513 Number of steps 9,009 ± 3, 179 9,543 ± 3,060 0.634 7,863 ± 3,823 I0,081 ± 3,I16 0.068 OSI(X 106 ) 2.367 ± 0.12 2.986 ± 0.18 0.000 2.555 ± 0.225 2.713 ± 0.29 0.027
l)The subjects were60female students in a junior college. The subjects were divided into the low OSI group (aSI lower than2.519, 19persons), high OSI group (OSI higher than2.799, 19persons), and medium OSI group (OSI between higher than2.519and lower than2.799, 22persons). Among the three groups, the low OSI group and high OSI group were compared. The subjects were also divided into the low 8MI group (8MI lower than 18.5, 16persons) and standard 8MI group (8MI higher than 18.5, 44 persons).
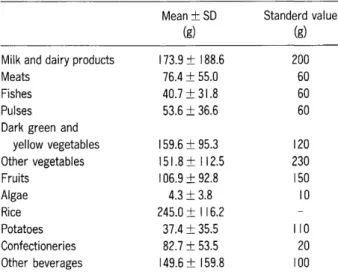
Table 3 Intake of foods classified by food groupsl)
Mean±SO Standerd value
(g) (g)
Milk and dairy products 173.9±188.6 200
Meats 76.4±55.0 60
Fishes 40.7±31.8 60
Pulses 53.6±36.6 60
Dark green and
yellow vegetables 159.6±95.3 120 Other vegetables 151.8±112.5 230 Fruits 106.9±92.8 150 Algae 4.3±3.8 10 Rice 245.0±I 16.2 Potatoes 37.4±35.5 110 Confectioneries 82.7±53.5 20 Other beverages 149.6±159.8 100 l)The subjects were 60 female students in a junior college. The standard value indicates the standard intake (recommended dietary allowance) of each food classified by food groups of 18-29 age females, which was listed in "A Guidebook for the Dietary Reference Intakes" (8).
low and high OSI groups or between low and standard BMI groups are shown in Table 2. Average and standard deviation of V02 max of the subjects were 35.37
±
5.81ml/kg/min, and those of grasp power were27.80
±
4.18 kg. The result of V02 max was identical to the sustaining(maintaining) target value(35 ml/kg/min) of twenty years old females, which is described in the "recommended exercise allowances" [7J. The mean grasp power of the subjects was also the same level as the standard level (28.9 kg) of females age 19-20.
The average and standard deviation of the number of steps of the subjects were 9,478
±
3,396, which value was1,000 steps more than the national average of number of steps (8,207 steps) [5J of females aged 15-29. One reason for this is thought to be that most of the subjects (students) have walked from the nearest train station to the college (1km distance, corresponding roughly to a 4,000 step distance). The number of steps of the subjects was not signifIcantly correlated to OSI of neither the low or high OSI group. There was also no signifIcant correla-tion with the bone mass, physical strength or daily activity. There was a difference in the number of steps between the low and standard BMI groups, and 2,000 fewer steps in the low BMI group, although the value is not statistically signifIcant.3. Intake of foods classified by food groups Food intake of the studied subjects and the standard
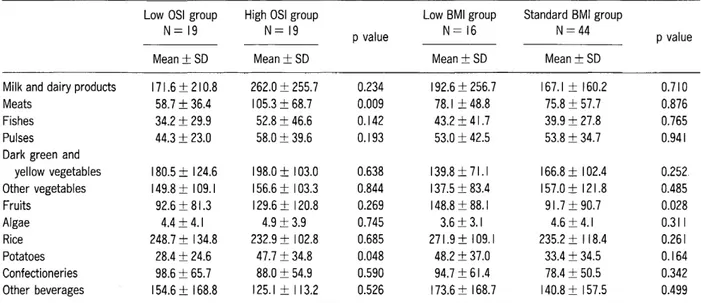
intake (recommended dietary allowance) of each food classifIed by food groups of 18-29 age females [8J are shown in Table 3. Comparisons of food intake between the low and high OSI groups and between the low and standard weight group are showninTable 4. Comparing the average intake of the subjects with the standard, dark green and yellow vegetables, pulses, milks and dairy products (abbreviated as milks in the following) were taken in almost appropriate amounts. There was a ten-dency toward insufficient intake of nshs, other vegetables, fruits, algae and potatoes. Contrary to this, there was a tendency of excessive intake of meats, confectionaries and non -alcoholic beverages. No correlation was observed between the OSI of the subjects and amount of intake of each food group.
When food intake was compared between the low and high OSI groups, the high OSI group took larger amounts of various foods than the low OSI group except that the low OSI group took larger amounts of con-fectionaries and beverages than the high OSI group. 105 g of meats were taken on averageinthe high OSI group, whereas 59 g were taken in the low OSI group. The difference was statistically signifIcant (p
<
0.05). The high OSI group took enough milk above the recommended dietary allowances. In comparing the low and high OSI groups, there is no signifIcant difference in intake of foods classifIed by food groups. When the low and standard BMI groups were compared the intake of milk, rice, fruit, potato, confectionaries and beverages was higher, and intake of vegetables and algae was lower in the low BMI group than in the standard BMI group, although the correlations were statistically insignifIcant.Discussion
In the present paper, measurement of bone mass of female students at a junior college was performed in association with the measurement of bone mass-influencing factors. Seventy percent of all subjects had a T score lower than 100. This means that the bone mass in the female college students tends to be of generally lower values than the average, as reported previously [9, 10]. According to the report of Mitsui et ale [llJ, female bone mass peaks at the age of17, and the bone mass was higher than that of20-years old females. This suggests that lowering of female bone mass starts even at the age of20. Nakabayashi et ale [12J reported that bone mass of systemic bones and lumbar vertebrae was
sus-Table 4 Comparisons of food intake between the low and high OSI groups and between the low and standard BMI groupl)
Low OSI group High OSI group Low BMI group Standard BMI group
N=19 N=19 p value N=16 N=44 p value
Mean ± SD Mean ± SD Mean ± SD Mean ± SD
Milk and dairy products 171.6 ± 210.8 262.0 ± 255.7 0.234 192.6 ± 256.7 167.1 ± 160.2 0.710
Meats 58.7 ± 36.4 105.3 ± 68.7 0.009 78.1 ± 48.8 75.8 ± 57.7 0.876
Fishes 34.2 ± 29.9 52.8 ± 46.6 0.142 43.2 ± 41.7 39.9 ± 27.8 0.765
Pulses 44.3 ± 23.0 58.0 ± 39.6 0.193 53.0 ± 42.5 53.8 ± 34.7 0.941
Dark green and
yellow vegetables 180.5 ± 124.6 198.0 ± 103.0 0.638 139.8 ± 71.1 166.8 ± I02.4 0.252 Other vegetables 149.8 ± 109.1 156.6 ± 103.3 0.844 137.5 ± 83.4 157.0± 121.8 0.485 Fruits 92.6 ± 81.3 129.6 ± 120.8 0.269 148.8 ± 88.1 91.7±90.7 0.028 Algae 4.4± 4.1 4.9 ± 3.9 0.745 3.6 ± 3.1 4.6±4.1 0.311 Rice 248.7 ± 134.8 232.9 ± 102.8 0.685 271.9 ± 109.1 235.2 ± 118.4 0.261 Potatoes 28.4 ± 24.6 47.7 ± 34.8 0.048 48.2 ± 37.0 33.4 ± 34.5 0.164 Confectioneries 98.6 ± 65.7 88.0 ± 54.9 0.590 94.7 ± 61.4 78.4 ± 50.5 0.342 Other beverages 154.6 ± 168.8 125.1 ± I 13.2 0.526 173.6 ± 168.7 140.8 ± 157.5 0.499
l)The subjects were 60 female students in a junior college. Food intake was compared between the low and high OSI groups or between the low and standard BMI groups as classified in the Table 2.
2)Pvalues were determined by Student's t-test. Differences were considered significant when p<0.05. tained until the age of 40, but that bone mass of the
proximal portions (including femoral neck) of femoral bones decreased slowly after the age of 18. Since bone mass of calcaneus has highly positive correlation with that of femoral neck [12, 13J, low bone mass tendency of the studied subjects (19-20 years old) suggests that bone mass decrease already started at calcaneus, and/or that the maximum bone mass attained was generally low. Because it is thought to be difficult to recover the bone mass in the adulthood, the importance of countermea-sures against bone mass decrease from the late teens is stressed.
Concerning physical constitution, slim body tendency of the studied subjects was confirmed. To reduce the percentage of slim body population of 20-years-old females from 23.3% to 15% is one of the target of "Health Japan 21" [7J. It is apparent that the back-ground of slim body tendency problem is the diet boom among young females. The studied subjects were thought to reflect the influence of the diet boom. Itis said that low weight population is at grave risk of amenorrhea, osteoporosis and so on. Since lowering of the age of slim body desire is observed today [4J, we have to immediate-ly think over the countermeasures against this.
Since the OSI of the low BMI group was signillcantly lower than that of the standard BMI groups, it suggests that low OSI occurs frequently in low BMI persons.
Positive correlation was observed between the high OSI group and the weight or BMI, but the low OSI group had no signifIcant correlation to weight or BM!. Although it has been reported in many papers [12, 13J that bone mass of calcaneus which is weight load bone is positively correlated with BMI, the present results showed that this correlation is not necessarily a firm one as described above. Considering the discrepancy of the results between the previous papers [12, 13J and the present paper, a report of Sower et al. [14J which reported that bone density correlated not to the BMI but to the lean body mass is strongly suggested. Body fat gives strong influence to estrogen which is tightly connected with bone mass maintenance. Thus, when we try to study the influence of low weight to bone mass, measurement of BMI that does not reflect the body fat is not sufficient enough, but we have to consider the need to measure the body fat and lean body weight. We would like to conduct further studies concerning the relation of bone mass to short term, intentional weight loss caused by being on a diet.
Concerning intake amount of foods classifIed by food groups, the high OSI group had better intake status for almost all food groups than the low OSI group (Table 4). Although the food intake status of the high OSI group deviated slightly toward animal foods, the food intake status was generally good in regard to nutritional
consid-erations. Meats and milks were especially taken in sufficient quantity by this (high OSI) group. There are many reports concerning positive correlation between bone density and intake amounts of meats [15, 16J and milks [16, 17]. The effects of meats and milks on increase of bone mass and maintenance were confrrmed by the present paper. The reason why meats are good for bone mass increase and maintenance is thought to be due to the fact that meats contain a variety of nutrients in addition to plenty of protein and that such food habits to eat plenty of meats also providing good nutrients for bone mass. Milks are not only the best supply source of calcium but also prevent osteoporosis through effects of newly found milk basic protein (MBP) [18
J.
Thus, the importance of intake of milks appears to be clear. The low OSI group had only about 60%intake of milks, meats and nshes of the high OSI group, and also had low intake of all other food groups except for confectionaries. There was no difference in physical constitution, physical strength and the number of steps between the both OSI groups. These results suggest a relationship between low intake of foods and low bone mass. The low BMI group showed deviated food habit (an unbalanced diet) such that they are inclined to take sugar-rich foods such as con-fectionaries and that they showed a tendency of low intake of vegetables and seaweeds. Hosokawa et al. [15J report-ed that patients suffering from osteoporosis have had high frequency of deviated food habit in the past. Even in the present study the low BMI group was suspected to relate to low bone mass, because they had several factors adversely affecting to bone mass such as low BMI, less number of steps in addition to the deviated food habit.In the present study, the subject population was not so large, and there were items with large individual difference such as food intake classified by food groups. Although the differences in averages were large, the results were largely statistically insignificant. However, the high OSI group, low OSI group, and low BMI group were found to have their own characteristics in relation to bone mass. Weare going to collect more data and to analyze them, and would like to clarify bone mass influencing factors and the back ground. We also would like to prepare a nne nutritional guide based on our data and that of others for preventing osteoporosis.
Acknowledgments. The author wishes to thank Dr. Yuichi Seki for his assistance on translating this manuscript into English. This work was
supportedinpartbya Grant of the Promotion and Mutual Aid Corporation for Private School of Japan (to S.K.).
References
I. Kanis J: The diagnosis of osteoporosis. J. Bone and Mineral Res. (1994)9, 1137-1141.
2. Hosoi T: Osteoporosis. A manual of Osteoporosis Prevention. Orimo ed., 2nd, Nihon-ijisinpousha (200 I) pp 1-15 (in Japanese). 3. Kamesaki Sand Iwai N: Relationship between a desire about body
weight, dieting and subjective symptoms among female college stu-dents. Jpn J Nutrition (1998)56, 347-358 (in Japanese). 4. Inoue M, Marutani N, Ohota M and Miyagawa K: Desire for
slender-ness and actual state of dieting of high school and junior college girls. Jpn J Nutrition (1992) 50, 355-364 (in Japanese).
5. A Society for the Research of Health and Nutrition; The national nutrition survey 1999. Daiichi-syuppan (200 I) pp 103- 105 and 116-118 (in Japanese). 6. The Osteoporosis Foundation; A manual of Osteoporosis Prevention.
Nihon-ijisinpousha (2001) pp 73-80 (in Japanese).
7. Fujisawa Y: Handbook of data for nutrition and health. Doubun-syoin (2000) pp 221-229 and 164-172 (in Japanese).
8. A Society for the Research of Health and Nutrition; A guide book for the dietary reference intakes. Daiichi-syuppan, (2000) pp 53-65 (in Japanese). 9. Miyazaki K: Reality of the consciousness of health and its movement in female students. J Kouran Jr Coil (1999) 42, 45-50 (in Japanese). 10. Asano M: Relationship between bone quality of female college
stu-dents and living factors. J Osaka Intern Women's Univ. (1999)25, 93-98 (in Japanese).
I I. Mitsui H, Harada M, Kumazawa Y, Sasaki M, Mita Rand Tsuge M: A study of quantitative ultrasound of the calcaneus and the factors associated with the measured value in normal adult females. Higasinihon-seisaikaisi (1998) 10, 209-212 (in Japanese). 12. Nakabayasi T, Hirota T, Yamanisi S, Sirokawa N, Takeda Hand
Hirota K: Factors differentially affecting on lumbar vertebrae, prox-imal portions of femoral bones and systemic bones in increasing, sustaining and decreasing phases of bones. Osteoporosis Japan (1997) 5, 213-218 (in Japanese).
13. Katagiri H, Yamamoto K, Kisimoto H, Hagino K and Tsuda K: Bone mineral measurement of calcaneus by osteo analyzer. Osteoporosis Japan (1993)1, 67-71 (in Japanese).
14. Sower M: Joint influence of fat and lean body composition compart-ment on femoral bone mineral density in premenopausal woman. Am.
J. Epidemio!. (1992) 136, 257-265.
15. Yukawa H, Suzuki T, Shibata H, Amano H, Haga Hand Yasumura S: The correlation of bone mineral density and nutrient intake what a woman of advanced age in the outskirts. Nihon-kousyueiseisi (1998) 45, 968-977 (in Japanese).
16. Hosokawa M, Yanagi H, Kawanami K, Tanaka K, Kobayasi K, Amagai H, Tomura Nand Tsuchiya S: A Study of osteoporosis and eating habit. Nihon-kousyueiseisi (1996) 43, 606-613 (in Japanese). 17. Miyamura T, Yamagata N, lijima Sand Asaka A: Effect of risk factors
of osteoporosis on the bone mineral content. Nihon-kousyueiseisi (1994)41, 1122-1130 (in Japanese).
18. Kumekawa M: Improving effects of milk basic protein (MBP) on bone metabolism; in Health Digest - Health update - (200 I)16, No. 1(in Japanese).