Studies on the Depth of Longline Hook
著者
YUWAKI Yasutaka, HIGASHI Masataka, SHIMADA
Kiyoshi, HENMI Tomio
journal or
publication title
鹿児島大学水産学部紀要=Memoirs of Faculty of
Fisheries Kagoshima University
volume
34
number
1
page range
21-26
別言語のタイトル
延縄の釣鉤深度についての研究
Mem. Fac. Fish., Kagoshima Univ. Vol. 34, No. 1, pp. 21-26 (1985)
Studies on the Depth of Longline Hook
Yasutaka Yuwaki*, Masataka Higashi*, Kiyoshi Shimada*
and Tomio Henmi*
Abstract
The tuna fishing experiments were carried out in the southern region of the Hawaiian Islands in May 1985. Someinformations were obtained on the relation between the calculated catenary value and the actual survey value of the depths of hooks of tuna long line and were discussed in
comparison with the results of study in 1984.
1 . Introduction
It has been noticed through the research in fishery and oceanography that the upwelling
associated with vortices exists in the equatorial region of the Eastern Pacific Ocean.
Oceanographic studies in this region have been published by many oceanographers, such
as Cromwell (1953)1), Sverdrup (1937, 1942)23), etc.
Since 1978, the authors have been engaged in studies on physical oceanography and
biological productivity in this region.To increase the "catch" of tuna , it is necessary to study the fishing gear of tuna for its
refinement as well as to research the oceanographic condition.
Studies on the fishing gear of tuna have been published by Morita (1969)4), Nakagome
(1961)5), Saito (1974)6), Yoshihara (1951,1952,1954)7'9\ and Higashi (1984)10).
As a part of the cadets training program, tuna fishing experiments were carried out in the southern region of the Hawaiian Islands in May 1985.
In each experiment, the depths of hooks of tuna long line were measured for comparison
with the same measurement data obtained in 1984. The results of study on the depths of
hooks of tuna long line based on the data obtained through the tuna fishing experiments in
1984 and 1985 are reported in this article.
2. Methods
In middle of May1985, tunafishing experiments were carried out in the southern region of
the Hawaiian Islands on board the Keiten Maru (G. T. 860tons), a fisheries and research ship of Kagoshima University.* Training Ship Keiten Maru, Faculty of Fisheries, Kagoshima University, 50-20 Shimoarata 4, Kagoshima Japan.
22 Mem. Fac. Fish,, Kagoshima Univ. Vol. 34, No. 1 (1985)
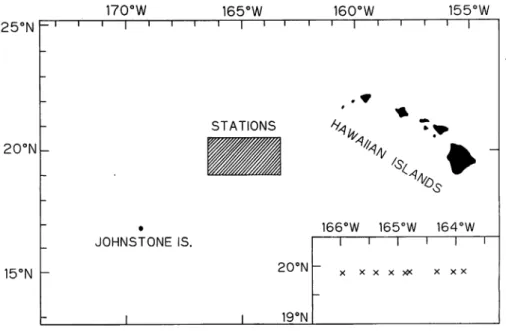
The experiment stations are shown in Fig. 1 . The long line gear was used in the tuna fishing experiment and the depths of hooks of tuna long line gear were measured by using a self-registering depth meter (BS—04).
The construction of long line gear was quite the same as that used in 1984.
170°W 165°W 160°W 155°W 25°N — i i i 1 i i i i I i i i i I i i 1 1 1 -STATIONS 20°N
^H
- • JOHNSTONE IS. 166°W 165°W 164°W 1 i 1 l 1 1 15°N -20°N X x X X XX X X X _ 1 1 19°NFig. 1. Map showing the stations of tuna fishing experiments.
3 . Results and Discussion Five hooks are attached on each unit of tuna long line gear.
Depth and range of eachhookon tunalongline used in 1984 and1985 are shown in Table 1.
The schematic profiles of the depth of hook on long line are depicted in Fig. 2 . As seen in the aforementioned table and figure, the depths of the hooks Nos. 1 and 5 were the shallowest and of the hook No. 3 was the deepest.
Table 1. Depths and ranges of Hooks measured by the self-registering depth meters in 1984 and 1985.
No. of Hooks
Nos. 1, 5 Nos. 2, 4 No. 3
1984 DEPTH 95m ~ 115m 100m ~ 145m 120m ~~ 205m RANGE 20m 45m 85m 1985 DEPTH 90m — 110m 125m ~ 170m 130m ~ 210m RANGE 20m 45m 80m
YUWAKI et al .' Studies on the Depth of Longline Hook ~ i — i — i — r No.1 HOOK ~i i — i — i — i — i — i — r 90 100 110
^Q^^v-yTvA/^v/T-gg-wA-A^—v a.—.
A^fh\200 -J I I I I I I I I I I I 2 4 6 TIME (hour) 8 10 12 23
Fig. 2 . The schematic profiles of the depth of hook of tuna long line.
The depths of hooks Nos. 1 , 5 and 3 were about the same as those observed in 1984, while the hooks Nos. 2 and 4 were much deeper.
This must be due to the influence of sea currents in various layers changing with depth. Unfortunately, the information on the oceanographic environment could not be described
owing to some trouble in the oceanic measurement systems.
The depths of hooks of tuna long line gear were calculated after the Yoshihara's
expression (1951 )7) for comparison with the actual survey values.
Hooks Nos. 1 and 5 were at the depth of 100 m, hooks Nos. 2 and 4 at 146 m and hook No. 3 at 194 m, respectively.
The mean values of differences in depth of hook between the calculated catenary value
and the actualsurvey valueon eachhook in the 1984 andthe 1985 datum-groups are shown in
Table 2.In both datum-groups, the actual survey value larger than the calculated catenary value on the hook No. 1 and the actual survey value smaller than the calculated catenaryvalue on
the hook No. 3 were recognized. And the mean values on No. 3 hook were almost the same between the two groups.
On the hook No. 2 , the actual survey value was smaller than the calculated catenary
24 Mem. Fac. Fish., Kagoshima Univ. Vol. 34, No. 1 (1985)
Table 2. Mean values of differences in depth of hook between the calculated catenary value and the actual survey value,
(calculated catenary value-actual survey value)
No. of Hooks
Nos. 1, 5 Nos. 2, 4 No. 3
C
1984 -2.9m 20.6 m 29.2 m
1985 -1.79m 0.61m 32.4 m
catenary value in the 1985 data.
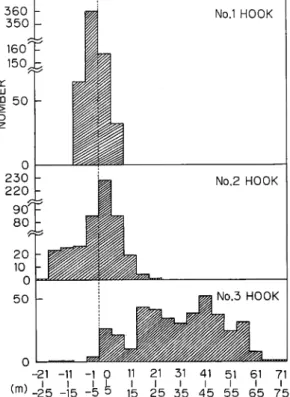
Frequencies of differences in depth ofhook between the calculated catenary value andthe
actual survey value in the 1985 data, which represent the main line form approaching a
catenary curve, are shown in Fig. 3 .
Frequencies of difference in depth of hooks Nos. 1 and 5 range between 5 m and —5 m,
hooks Nos. 2 and 4 between 10 m and —5 m, and hook No. 3 between 20 m and 60 m.The more the depth of hookis, the more the range of difference in depth of hook widens.
-21 -11 -1 0 11
^ -25 -15 -5 h ^
No.1 HOOK No.2 HOOK No.3 HOOK 21 31 41 51 61 71 I l I l I I 25 35 45 55 65 75Fig. 3. Frequencies on difference of the depth of hook between the calculated catenary value
YUWAKI et al .' Studies on the Depth of Longline Hook 25
Dispersion of the difference in depth of the hook No. 3 ranged more widely than those of
hooks Nos. 1 and 2. It must be caused by the difference in depth of hook and length of branch line on main line, as well as by the diversity of sea current in various layers.
Dispersions of the hooks Nos. 1 and 3 were almost the same between the data in 1984 and 1985.
It was noticed that the dispersion of the hook No. 2 in the 1985 experiment was narrower than that in 1984, namely, the dispersion rather widely ranged between 0 m and 50 m in 1984, while it narrowly ranged between —5m and 10 m in 1985.
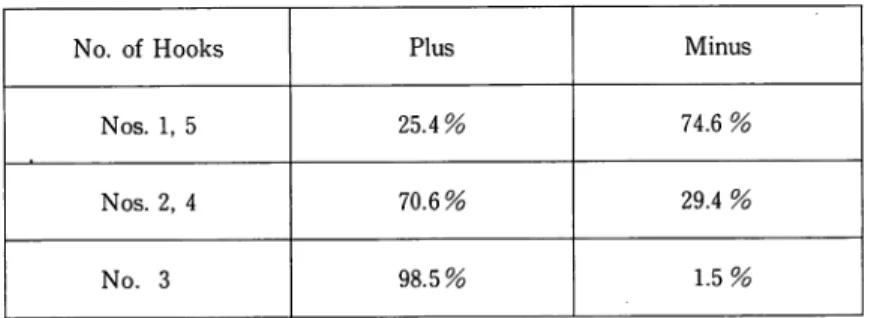
The composition of positive and negative values of differences between the calculated catenary value and the actual survey value on each hook are shown in table 3 .
Table 3. Composition of the positive and the negative values of differences be
tween the calculated catenary value and the actual survey value.
No. of Hooks Plus Minus
Nos. 1, 5 25.4% 74.6%
Nos. 2, 4 70.6% 29.4%
No. 3 98.5% 1.5%
The negative difference between the calculated and the actual values, i. e. the calculated
catenary value smaller than the actual survey value, was frequently recognized on the hook
No. 1 . On the contrary, the positive difference, i. e. the calculated catenary value larger
than the actual survey value was known to be more frequent on the hooks Nos. 2 and 3 .
The sinking rate "S" , the ratio of the actual survey value to the calculated catenary
value, was calculated to investigate the reaching depth of hook.
When S = 100%, the actual survey value is equal to the calculated catenary value and when S<100%, the actual survey value is smaller than the calculated catenary value, i. e. the actual depth of hook is shallower than calculated one.
Sinking rate ranged between 97. 5% and 104. 6% on the hook No. 1, between 95. 8% and
109.1% on the hook No. 2, and between 72.7% and 96.3% on the hook No.3.
Meanvalues of sinking rate were 101. 8% on the hook No. 1, 99.4% on the hook No. 2 and
73.0% on the hook No.3, respectively.It was found that the actual survey values on the hook Nos. 1 and 2 are almost equal to the calculated catenary value, but the actual surveyvalue on the hook No. 3 is shallower than
the calculated catenary value.
4 . Summary
26 Mem. Fac. Fish., Kagoshima Univ. Vol. 34, No. 1 (1985)
Islands in May 1985. The results were summarized as follows comparing with the results of tuna fishing experiments in 1984.
(1) The depths of the hooks Nos. 1,5 and 3 were about the same as those observed in 1984, but the hooks Nos. 2 and 4 were deeper than those in the 1984 experiment.
(2) In 1984 and 1985, the actual survey value was larger than the calculated catenary value on the hook No. 1, while on the hook No. 3 the former was smaller than the latter. (3) The actual survey value was smaller than the calculated catenary value on the hook No. 2 in the 1984 experiment, but the former was almost equal to the latter in 1985. (4) The dispersions of the hooks Nos. 1 and 3 were almost the same as those in 1984, but that of the hook No. 2 was narrower than that in 1984.
(5) Cases in which the calculated catenary value is smaller than the actual survey value were frequent on the hook No. 1. Cases in which the calculated catenary value is larger than the actual survey value were still more frequent on hook Nos. 2 and 3.
(6) Mean values of sinking rate were 101.8% on the hook No. 1, 99. 4% on the hook No. 2 and 73.0% on the hook No.3.
5 . References
1 ) CROMWELL, T. (1953) : Circulation in a meridional plane in the Central Equatorial Pacific. J.
Mar. Res., 12, 196-213.
2) SVERDRUP, H. U. (1937) : On the process of upwelling. J. Mar. Res., 1(2), 155-164. 3) Sverdrup, H. U. ,M W. Johnson and R. H. Fleming (1942) : The ocean. Their physics
chemistry and general biology. Prentic-Hall, New York, 605-761.
MORITA, T. (1969) : Studies on the Fishing Gear of Tuna Long Line. Mem. Fac. Fish. Kagoshima Univ., 18, 145-215.
NAKAGOME, J. (1961) : Comparison of Depth of Longline Hook Between Calculated and Surveyed. Bull Jap. Soc. Fish., 27(2) 199-123.
SAITO, (1974) : Swimming Depth of Large Sized Albacore in the South Pacific Ocean- II. Bull.
Jap. Soc. Sci. Fish., 40(7), 643-649.
YOSHIHARA, T. (1951) : Distribution of Fishes caught by the Long Line. Bull. Jap. Soc Sci. Fish., 16(8), 42-46.
YOSHIHARA, T. (1952) : Distribution of Catches of Tuna Longline-IE. Bull. Jap. Soc. Sci. Fish.,
18( 5 ), 187-190.
YOSHIHARA, T. (1954) : Distribution of Catches of Tuna Longline -W. Bull. Jap. Soc. Sci. Fish., 19(10), 1012-1024.
10) Higashi, M., K, Shimada. , Y, Yuwaki and T, Henmi. (1984) : The Oceanographic Research in the Southern Region of the Hawaiian Islands- MI. Mem. Fac. Fish. Kagoshima Univ., 33(1),
33-42.
Amendment
The following amendment is made to Fig. 4 in the previous paper (Higashi et al., 1984). Triangle mark is the proportion of catches of marlin and circle is of albacore.