Changes of Some Carbohydrates and Amino Acids
in the Blood of the Eel after Feeding
著者
HAYASHI Seiichi, KAWABATA Masanobu, ITAKURA
Takao, OOSHIRO Zentaro
journal or
publication title
鹿児島大学水産学部紀要=Memoirs of Faculty of
Fisheries Kagoshima University
volume
31
page range
259-266
別言語のタイトル
ウナギ血中炭水化物, アミノ酸量の摂飼後の変化
Mem. Fac. Fish., Kagoshima Univ.
Vol. 31 pp. 259-266 (1982)
Changes of Some Carbohydrates and Amino Acids
in the Blood of the Eel after Feeding
Seiichi Hayashi*, Masanobu Kawabata*,
Takao Itakura* and Zentaro Ooshiro*
Abstract
Changes ofglucose, lactate, pyruvate, and amino acids in theblood ofthecultured eel after feeding
wereinvestigated. Blood glucose was the highest at 2 hoursafter feeding. Lactate concentration in the eelblood afterfeeding increased slowly and pyruvate concentration wasthe highest at one hour.
The ratiooflactate to pyruvate in theeel blood was 35to 130, which was much higher than that in rat blood. Every amino acids except histidine, tryptophan, glutamate, and aspartate increased remarkably after feeding. Amount of taurine in the eel blood was 100 times higher than that in human blood.
Investigating the changes of some materials in the blood of animal after feeding provides
important informations on digestion and absorption, and metabolisms in animal. We investigated the changes of glucose, lactate, pyruvate, and amino acids in the blood of the cultured eel (Anguilla japonica) after feeding. It is known that in normal human after feeding blood glucose is the highest after one hour. Although there are some reports on the changes of blood glucoseof fishes after feeding1,2*, its change of the eel is still unknown. Chaanges of lactate and pyruvate in the blood are interesting from the viewpoint of gluconeogenesis, since both are good substrates for gluconeogenesis in liver. In the eel liver gluconeogenetic pathway is different from that in mammals described previously3). Informations of changes of amino acids in the
blood provides useful knowledge on amino acid metabolism.
Protein concentration and transaminase activities in the blood beside materials described above were also investigated.
Experimental Procedures
Eels Cultured eels were obtained from Mr. Ushinohama who cultured eels at Sendai in
Kagoshima.
Experiments were done every month from May, 1981 to January, 1982. The
average weight and length of eels used were shown in Table 1.Preparation of blood sample
Eels were anaesthetized by 2% urethane.
The abdomenwas
cut from the anus to the head by scissors and the hepaticveinbetween the heart and the liverwas
cut. After cutting the hepatic vein the blood was collected immediately by syringe containing
260 Mem. Fac. Fish., Kagoshima Univ. Vol. 31 (1982)
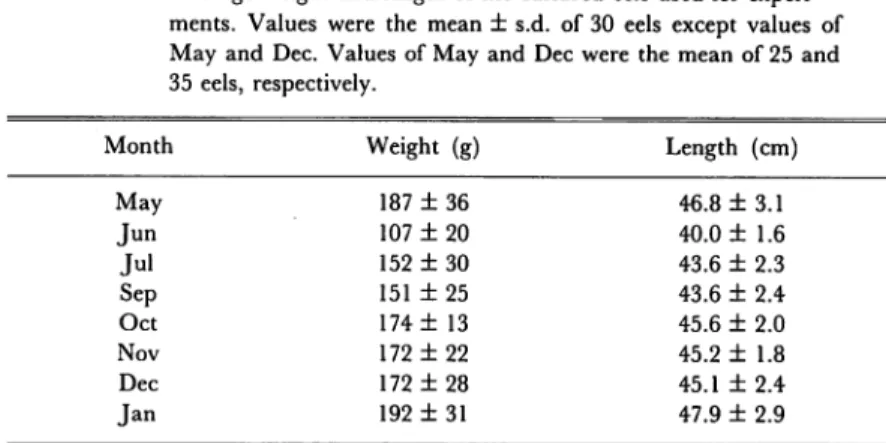
Table 1. Average weight and length of the cultured eels used for experi ments. Values were the mean ± s.d. of 30 eels except values of
May and Dec. Values of May and Dec were the mean of 25 and 35 eels, respectively.
Month Weight (g) Length (cm)
May 187 ±36 46.8 ± 3.1 Jun 107 ±20 40.0 ±1.6 Jul 152 ± 30 43.6 ± 2.3 Sep 151 ± 25 43.6 ± 2.4 Oct 174 ±13 45.6 ±2.0 Nov 172 ±22 45.2 ±1.8 Dec 172 ±28 45.1 ± 2.4 Jan 192 ± 31 47.9 ± 2.9
one ml of 0.02% heparin solution. After measuring the volume of the blood the blood was divided into two centrifuge-tubes. One tube contained 0.8 ml of 1 N perchloric acid per ml of
blood previously and the other contained nothing. Both tubes were centrifuged at 3,000 rpm for 10 min. The supernatant of the former tube was neutralized with 0.2 ml of 2 M K2CO3 per ml of
blood. Neutralized supernatant was frozen in liquid nitrogen and used for determination of
glucose, lactate, pyruvate, and amino acids. The supernatant of the latter tube was frozen
immediately in liquid nitrozen and used for determination of protein and transaminase
activities. All samples were stored at freezer of —20°C until samples were analyzed.
Methods of determination Glucose, lactate, and pyruvate were determined by enzymatic methods4,6*. Amino acids were determined by amino acid analyzer (Hitachi Amino Acid
Analyzer Type 835). Protein was determined by the method of biuret7). Transaminase
activities were measured according to the method of Segal8) for alanine transaminase and the method of Morino9) for aspartate transaminase. One enzyme unit is defined as the amount of
enzyme catalyzing a decrease of one micromole of NADH per minute under the assay conditions.
Materials Hexokinase, glucose-6-phosphate dehydrogenase, lactate dehydrogenase, and
malate dehydrogenase were obtained from Boehringer Mannheim.
ATP, NAD+, NADP+, and
NADH were obtained from Oriental Yeast Co. Triethanolamine HCl was purchased from
Merck Co. and other reagents were from Wako Pure Chemical Industries.
Results and Discussion
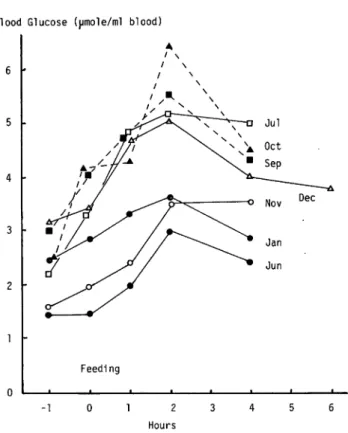
Changes of blood glucose After feeding the blood glucose of the eel increased for 2 hours, then it decreased as shown in Fig. 1. Shimeno reported that the blood glucose ofjack mackerel attained the highest from 2 to 3 hours after feeding1*. The blood glucoseof red sea bream after feeding was the highest at 2 hours as well as the blood glucose of the eel2).
Hayashi. Kawabata-Itakura.Ooshiro : Changes of some materials in the eel blood after feeding
Blood Glucose (umole/ml blood)
6
--1
Feedi ng
1 2 3 4 5 6
Hours
Fig. 1. Chages in concentration of the blood glucose of the eel after feeding.
Each value was the mean of 5 eels.
261
Comparing with the blood glucose of normal mammals, fish blood glucose increased late by one hour after feeding. It is uncertain that in fishes the absorption of glucose after digestion or the utilization of glucose in tissues is slower than that in mammal.
Concentration of the blood glucose of the eel ranged from 1.5 to 6.5 jjl moles per ml of blood. These values were lower than those in mammals, jack mackerel or red sea bream.
Changes of lactate and pyruvate Concentration of blood lactate of the eel obtained in
summer (June, July, and September) was higher than that in winter (November, December, and January). As shown in Fig. 2 blood lactate of the eel obtained in summer increased after feeding
by 2 to 3 times and high concentration of blood lactate continued for 4 hours after feeding. Whereas lactate concentration of the eel obtained in winter did not change remarkably after feeding. The lactate concentration of the eel blood ranged from 1 to 6 f± moles per ml of blood.
The change of pyruvate concentration after feeding was shown in Fig. 3. After feeding pyruvate concentration attained the highest at one hour. After 2 hours the level of pyruvate returned to the level before feeding. The range of the pyruvate concentration of the eel blood was from 0.02 to 0.055 //mole per ml of blood.
Blood Lactate (jjmole/ml blood) 7 Feeding -1 0 12 Hours U Jul 3 4 5 Fig.2. Changesin concentrationof theblood lactate ofthe eelafter feeding. BloodPyruvate (xl0~ umole/ml blood) 6 -1 Feeding 1 2 Hours Fig.3. Changesin concentrationof theblood pyruvate ofthe eelafter feeding. 3 3GO* £
Hayashi-Kawabata. Itakura-Ooshiro : Changes of some
materials in the eel blood after feeding 263
The ratio oflactate to pyruvate in the blood of the eel was from 35 to 130.
These values were
very high comparing with those in rat blood.
In rat blood the ratio was from 11 to 12'°*. The
high ratio is due to rather high level of lactate and low level of pyruvate in the eel blood.
Recently we have clarified that the typeof lactate dehydrogenase in the eel liveris heart type.
Whereas it is known that lactate dehydrogenase in rat liver is muscle type11*. Heart type lactate
dehydrogenase unlike muscle type one proceeds mainly the conversion of lactate to pyruvate.
Pyruvate in liver cells is utilized for gluconeogensis or for energy through TCA-cycle.
It is
interesting whether the high ratio oflactate to pyruvate in theeel blood implicates or does notin
gluconeogenesis and energy metabolism in the eel liver.
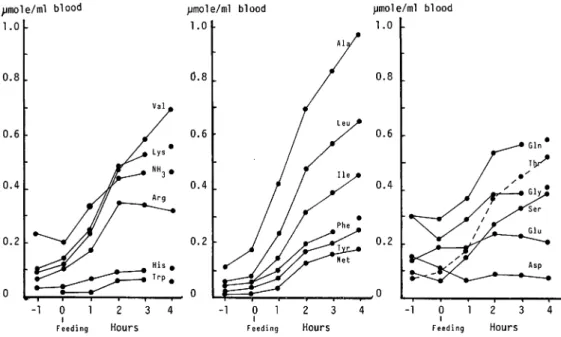
Changes of amino acids Changes of the concentration of each amino acids in the blood of
the eel obtained in June was investigated. Every amino acids except histidine, tryptophan,aspartate, and glutamate increased remarkably after feeding as shown in Fig. 4. Methionine,
leucine, isoleucine, and alanine increased by 18, 13, 12, and 9 times, respectively at 4 hours after feeding. Total amino acids increased 4 times at 4 hours after feeding.
umole/ml blood 1.0 0.2 -umole/ml blood 1.0 t 1 2 3 Hours umole/ml blood 1.0 -0 1 2 3 4 i Feeding Hours
Fig. 4. Changes in concentration of the amino acids of the eel after feeding.
Low amount of histidine, tryptophan, aspartate, and glutamate seemed due to their permeability to the cell membrane. The amount of tryptophan and histidine seems to be important from the viewpoint of the nutrition of the eel. However, since the blood used for analysis was collected from the hepatic vein as described in "Experimental Procedures",
264
Mem. Fac. Fish., Kagoshima Univ. Vol. 31 (1982)
difference of the amonunt of alanine between portal and hepatic vein of rat is 149 //M,2).
Among amino acids of the eel blood taurine was 5.55 //moles per mlof blood as shown in Table
2. This value was about 100 times higher than the amount of taurine in human blood. It is
unknown why such a high concentration of taurine is contained.
Table 2. Cmparision of the amount of each amino acids in the eel and human blood. Eels before feeding by one hour were used.
Amino Eel* Human**
Acid jj. mole/ml blood ^mole/ml blood
Tau 5.55 ± 1.35 0.05 Asp 0.15 ±0.09 0.15 Thr 0.08 ± 0.03 0.16 Ser 0.10 ±0.03 0.12 Glu 0.14 ±0.05 0.03 Gin 0.30 ± 0.27 0.63 Gly 0.30 ±0.13 0.25 Ala 0.11 ±0.04 0.39 Met 0.01 ± 0.01 0.04 He 0.03 ± 0.01 0.07 Leu 0.06 ± 0.01 0.14 Tyr 0.03 ± 0.01 0.08 Phe 0.04 ± 0.01 0.06 Lys 0.10 ±0.04 0.17 His 0.03 ± 0.01 0.09 Arg 0.07 ± 0.00 0.10 Val 0.09 ± 0.02 0.24
* Values of eels were the mens ± s.d. of 5 eels.
** Biochemical Data Book (1979) 1548 (Tokyo Kagaku Dojin, Tokyo).
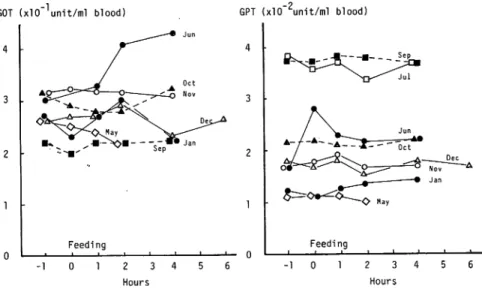
Protein and transaminase in the blood No change of protein concentration and transaminase activities in the plasma of the eel was observed after feeding as shown in Fig. 5 and
Fig. 6. However, seasonal variation was observed in protein concentration and transaminase
activities. Especially alanine transaminase activities in September and July were high and those in May and January were low.Hayashi.Kawabata-Itakura. Ooshiro : Changes of some materials in the eel blood after feeding
Plasma Protein (mg/ml blood)
60 50 40 30 20 10 Feeding , , i 1 I ! ! - 1 0 1 2 3 4 5 6 Hours
Fig. 4. Changes in concentration of the plasma protein of the eel after feeding.
265
GOT (xlO^unit/ml blood) GPT (xl0"2unit/ml blood)
4 -Feeding _ i 1 1 — -»— 0 -1 0 1 2 3 4 5 6 Hours -O May Feeding _i i i i i - 1 0 1 2 3 4 5 6 Hours
266 Mem. Fac. Fish., Kagoshima Univ. Vol. 31 (1982)
Acknowledgment
We wish to express our gratitude to Mr. Ushinohama for giving cultured eels.
References
1) SHIMENO, S. (1974): Studies on carbohydrate metabolism in fishes. Rep. Fish. Lab., Kochi Univ., 2, 80-81.
2) IKEDA, S. (1979): Sugar metabolism in fishes. Protein, Nucleic Acid and Enzyme, 24, 292-300. 3) Hayashi, S., and Z. Ooshiro (1979): Gluconeogenesis in isolated liver cells of the eel, Anguilla
japonica., J. Comp. physiol., B132, 343-350.
BERGMEYER, H. U., Bernt, E., Schmidt, F., and H. STORK (1974): "Methods ofenzymatic Analysis",
1196-1201 (Academic Press, New York and London).
GUTMANN, L, and A. MW. Wahlefeld (1974): "Methods of Enzymatic Analysis", 1464-1468 (Academic Press, New York and London).
CZOKAND, R., and W. LAMPRECHT (1974): Methods of Enzymatic Analysis", 1446-1451 (Academic Press, New York and London).
Sugawara, K., and M Soejima (1979): "Determination of Protein", 74-84 (Gakkai-Shuppan Center, Tokyo).
8) Segal, H. L., and T. Matsuzawa (1970): "Methods in Enzymology", 17, 153-159 (Academic Press, New York and London).
9) MORINO, Y. (1976): "Seikagaku Jikken Koza" 11, 159-161 (Tokyo kogaku Dojin, Tokyo). 10) BERGMEYER, H. U. (1974): "Methods of Enzymatic Analysis", 2267-2279 (Academic Press, New York
and London).
11) FINE, I. H., Kaplan, N. O., and D. KUFTINEC (1963): Developmental changes of mammalian lactic
dehydrogenase. Biochemistry, 2, 116—121.
12) ISHIKAWA, E. (1974): Interorganal relationships and roles of individual organs in amino acid