The Oceanographic Conditions along 134°E from
12°N to 30°N in September, 2003 and 2009
著者
HIGASHI Masataka, UCHIYAMA Masaki, HABANO
Akimasa, AZUMA Takafumi, FUKUDA Ryuji, ARITA
Youichi, MAKINO Fumihiro
journal or
publication title
鹿児島大学水産学部紀要=Memoirs of Faculty of
Fisheries Kagoshima University
volume
59
page range
1-9
別言語のタイトル
2003・2009年9月134°E線上12°Nから30°Nにおけ
る海洋構造
*1 鹿児島大学水産学部附属練習船かごしま丸 (The Fishing Training Ship Kagoshima Maru, Faculty of Fisheries, Kagosima University, 4-50-20 Shimoarata, Kagoshima 890-0056, Japan)
*Corresponding Author, E mail: [email protected]
It is very important to perform the oceanographic surveys as many times as possible for monitoring the oceanic circulation in the western part of the Pacific Ocean.
This is because the oceanographic conditions in the Pacific Ocean affect the climate over the world and have an influence upon the fishing affairs.
We, using the Kagoshima Maru (G.T. 1297.08 tons), the fishing training ship of the Kagoshima University, have the routine cruise for training the cadets in every year which passes through the northwesten Pacific Ocean from kagoshima to the Indian Ocean.
The oceanographic observations were carried out for the return cruise from Palau Islands to Kagoshima in 2003 and 2009.
Some results of the oceanographic survey to the 137°E section and its adjunct sections have been published by J.Masuzawa et al. 1) in 1975, by the Japan Meteorological
Agency several times in a year from 1967, by T.Suga et al.2) ,
which focuses on the Subtropical Mode Water in the 137°E Section, by M.Higashi 3) with data along 131°E from 30°N
to 15°N in 1989, by Uchiyama et al.4) for the section from
the west of Okinawa to Palau Islands in 1995, by M.Higashi
et al.5) for the section between the south of Kyusyu and the
Yap islands in 1999. Furthermore, the Japan Meteorological Agency’s data of the 137°E section were analyzed to explain the inter-annual variation of the catch for the Japanese eel with the processes that such a variation depends on the meridional location of the low-salinity water within the North Equatorial Current (S.Kimura et al.6)), and the Kuroshio’s effect on the
larval transport of the Japanese eel (Kimura et al 7)).
In this paper, we describe the results of the observations along 134°E from 12°N to 30°N in 2003 and 2009. We expect these data turn to account for elementary materials
Abstract
The CTD observations were carried out along 134°E from 12°N to 30°N in the northwestern part of the North Pacific in September’s of 2003 and 2009. The surface layers warmer than 27.5℃ were observed from 12°N to 27°N in 2003 and observed from 12°N to 22°N in 2009. The present paper aims to comparing the September’s hydrographic conditions for the two years. The subtropical Mode Water occupied the subsurface layer between 200m and 400m depths in the region between 18°N and 24°N for 2003, while in that between 18°N and 26°N for 2009. The North Equatorial Current, which is identified by the downward slope of isotherms toward the south, was observed north of 17°N in 2003 while north of 15°N in 2009. The saline water higher than 34.8 psu occupied the subsurface layer between 100 m and 250 m depths in the almost whole section in 2003, whereas only in the region north of 21°N in 2009. The halocline below the subsurface saline water, was identified between 34.5 psu and 34.7 psu in the entire sections for both the years. The intermediate water fresher than 34.2 psu occupied within the depths from 550 m to 850 m in the region between 18°N and 27°N in 2003, but the depths from 550 m to 750 m in the region between 19°N and 27°N in 2009.
2 Mem. Fac. Fish. Kagoshima Univ., 59 (2010)
Materials and Methods
CTD, and XBT observations
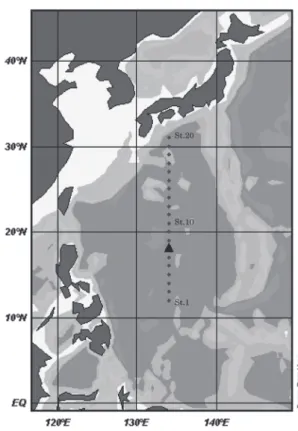
Fig. 1 shows the position of oceanographic observation along 134°E in 2009.
Fig. 2 shows in 2003.
The oceanographic observations were carried out with CTD system (Model 911 plus SEA-BIRD ELECTRONICS INC.), and XBT (TS-MK130 TSURUMI SEIKI). The CTD casts were performed from the sea surface to the maximum depth of 1000 m. Salinity measured by CTD was corrected by that measured accurately with AUTOSAL from water samples.
The values of temperature and salinity at the serial depths for the international standard were tabulated in Appendix.
Results and Discussion
Vertical section of temperature
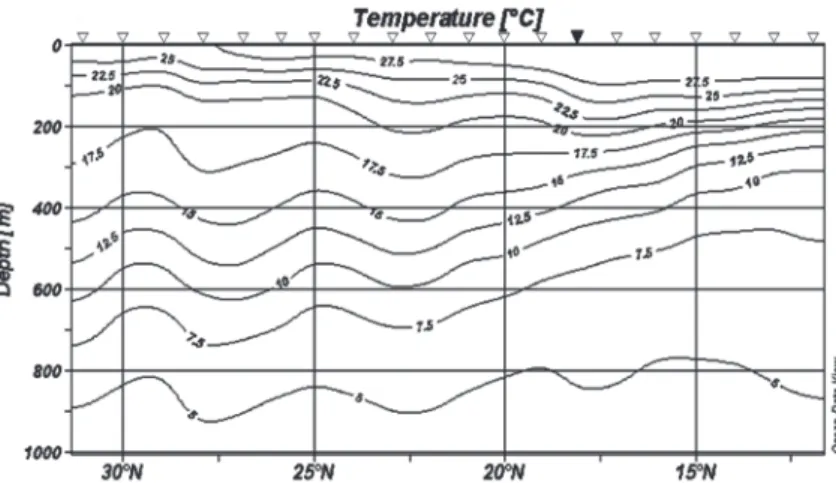
Fig. 3 shows the distribution of water temperature in the vertical section in 2009.
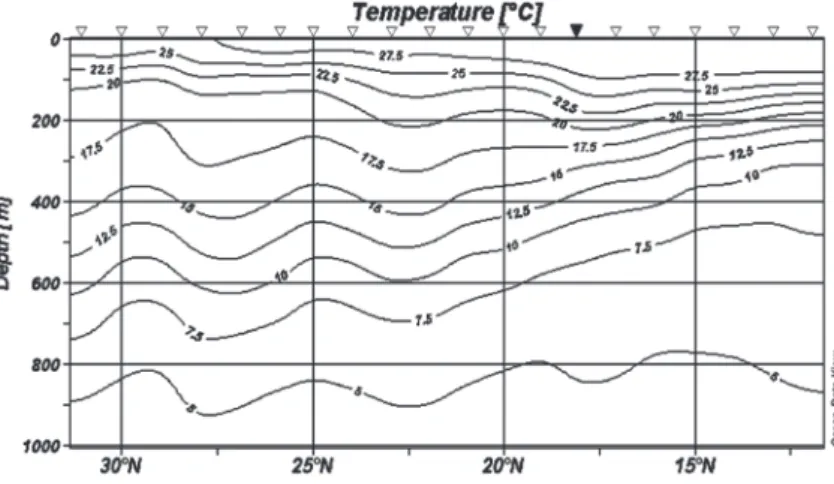
Fig. 5 shows in 2003.
The surface water with temperature higher than 27.5 ℃ was observed from 12°N to 27°N in 2003, while from 12°N to 22°N in 2009.
The strong downward-slope of isotherms from the north to the south, which was associated with the Kuroshio, was found from 28°N to 29°N in 2003 and from 28°N to 30°N in 2009,
The upward-slope of isotherms from the north to the south around 27°N showed the existence of the Kuroshio counter-current, or mesoscale eddies for both2003 and 2009.
The subtropical Mode Water occupied the subsurface layer between 200 m and 400 m in the region between 18°N and 24°N in 2003, although it was seen between 18°N and 26°N in 2009.
The maximum value of the sea surface temperature was 30.49 ℃ at 15°N in 2003 while 30.76 ℃ at 17°N in 2009.
The North Equatorial Current, which is identified by the downward slope of isotherms toward the south, was observed north of 17°N in 2003 while north of 15°N in 2009.
The fact that the eastward current in 2003 is stronger than in
Fig.1. The positions of oceanographic observation along 134°E in 2009
( CTD stations : ● XBT stations : ▲ )
Fig. 2. The positions of oceanographic observation along 134°E in 2003
Fig. 3. The distribution of water temperature in the vertical section in 2009 ( CTD stations : ∇ XBT stations : ▼ )
Fig. 5. The distribution of water temperature in the vertical section in 2003 ( CTD stations : ∇ XBT stations : ▼ )
2009, indicates that the circulation of the upper ocean in 2003 was more intensified than in 2009 for the western subtropical North Pacific.
Vertical section of salinity
Fig. 4 shows the distribution of salinity in the vertical sec-tion in 2009.
Fig. 6 shows in 2003.
The lowest value of the less saline surface water was 33.935 psu at the sea surface of 14°N in 2003 while 33.625 psu at that of 25°N in 2009.
A water core characterized by the salinity maximum ( > 34.9 psu) was seen in the depths less than 200 m between 21°N and 24°N in 2003. It indicates that pressure is higher below this core than the surrounding waters.
Salinity of the water between 100 m and 200 m depths was
higher in 2003 than in 2009.
The salinity minimum existed at 16°N in 2003 while at 13°N in 2009. This difference is probably explained as fol-lows ; the El Nino event 6) occurred in 2009 so that the low
salinity water shifted southward, comparing to the usual year such as 2003.
The saline water ( > 34.75 psu) below the surface water, occupied the subsurface layer between 100 m and 250 m depths in the almost whole section in 2009 and especially this subsurface saline water with a character of the highest salinity ( > 35.028 psu) extended from the south to 13°N.
In 2003, the saline water higher than 34.8 psu occupied between 100 m and 250 m depths in the almost whole sec-tion, having a core with salinity higher than 35.0 psu at 22°N - 23°N (the highest salinity value was 35.116 psu at 22°N).
4 Mem. Fac. Fish. Kagoshima Univ., 59 (2010)
salinity changes from 34.5 psu to 34.7 psu in the entire sec-tions in both the years.
Below the halocline, the North Pacific Intermediate Water, which was characterized by the low salinity water ( <34.2 psu) appeared between 550 m and 850 m depths in the region be-tween 18°N and 27°N in 2003, although it was seen bebe-tween 550 m and 750 m depths in the region between 19°N and 27°N in 2009. The salinity minimum layers for both the years had the tendency of shallowing toward the south of 18-19° N.
Acknowledgements
I wish to express my hearty thanks to crew and cadets of the training ship Kagoshima Maru for their assistance and support on board, and Dr. Nishina, the Faculty of Fisheries of kagoshima University, for her work in arrangement and calibration of the observational data and also for her advice in preparing this manuscript.
Fig. 4. The distribution of salinity in the vertical section in 2009 ( CTD stations : ∇ XBT stations : ▼ )
Fig. 6. The distribution of salinity in the vertical section in 2003 ( CTD stations : ∇ XBT stations : ▼ )
References
1) Masuzawa, J. and K.Nagasaki (1975). The 137°E oceanographic section. J. Mar. Res., 33(suppl): 109-116. 2) Suga,T., K.Hanawa, and Y.Toba (1989). Subtropical mode
water in the 137°E Section. J.Phys.Oceanogr.,19: 1605-1618. 3) Higashi, M. (1989). The oceanographic Condition along
131°E from 30°N to 15°N in June, 1989. Mem. Fac.Fish.
kagoshima Univ., 38(1): 53-62.
4) Uchiyama, M., K.Yoshinaga, and K.Shimada (1996). The oceanographic conditions in the section from the west of Okinawa to Palau Islands in 1995. Kagoshima Univ. Res.
Cent. South Pac.(occasional paper), 30: 139-141.
5) Higashi, M., H.Ichikawa, K.Shimada, A.Habano, and T.Azuma (2000). Oceanographic Conditons in Fall of 1999 along the Section between the South of Kyusyu and the Yap Islands. Mem. Fac .Fish. Kagoshima Univ., 49: 1-7.
6 Mem. Fac. Fish. Kagoshima Univ., 59 (2010)
Appendix
Date 2009.9.19 2009.9.20 2009.9.20 2009.9.20 2009.9.21 JST 23:22 8:02 16:33 23:26 7:58 St.No. 1 (XBT) 2 3 4 (XBT) 5 Lat. 12-00.00N 13-00.00N 13-59.95N 15-00.00N 16-00.01N Long. 134-00.13E 134-00.07E 134-00.02E 134-00.00E 133-59.98ETemp. (°C) Sal. (psu) Temp. (°C) Sal. (psu) Temp. (°C) Sal. (psu) Temp. (°C) Sal. (psu) Temp. (°C) Sal. (psu)
0 28.83 29.50 29.59 10 29.22 29.33 34.359 29.71 29.58 20 29.22 29.33 34.436 29.50 34.265 29.61 29.58 34.261 30 29.23 29.34 34.437 29.48 34.266 29.56 29.57 34.260 50 29.22 29.16 34.554 29.18 34.543 29.35 29.16 34.480 75 28.59 28.22 34.960 28.15 34.872 27.74 27.18 34.798 100 27.39 27.60 35.028 26.32 34.894 25.68 25.05 34.907 150 22.94 23.65 35.022 22.85 34.983 23.15 21.44 34.891 200 18.12 18.63 34.787 18.85 34.835 20.17 18.69 34.818 250 13.07 14.40 34.486 16.70 34.690 17.82 17.17 34.747 300 10.73 11.44 34.342 14.26 34.503 15.08 15.21 34.586 400 8.42 8.99 34.397 9.93 34.270 10.71 10.83 34.298 500 7.15 6.92 34.355 7.47 34.289 8.10 7.76 34.198 600 6.44 6.47 34.476 6.22 34.391 6.46 6.63 34.290 700 5.83 5.79 34.508 5.55 34.468 5.51 5.79 34.412 800 5.22 34.522 5.05 34.501 5.08 34.473 900 4.69 34.528 4.58 34.527 4.67 34.506 1000 4.25 34.546 4.20 34.541 4.23 34.525 1200 3.59 34.567 5.53(760m) 5.15(760m) Date 2009.9.21 2009.9.21 2009.9.22 2009.9.22 2009.9.22 JST 14:57 22:16 8:00 15:08 22:09 St.No. 6 7 (XBT) 8 9 10 (XBT) Lat. 17-00.04N 18-00.00N 18-59.99N 19-59.99N 21-00.02N Long. 134-00.03E 134-00.00E 133-59.82E 133-59.80E 134-00.00E
Sal. (psu) Sal. (psu) Temp. (°C) Sal. (psu) Temp. (°C) Sal. (psu) Temp. (°C) Sal. (psu) Temp. (°C) Sal. (psu)
0 30.76 29.69 29.70 29.10 10 29.68 34.332 29.79 29.70 29.82 34.257 29.59 20 29.49 34.302 29.69 29.65 34.309 29.80 34.268 29.59 30 29.47 34.302 29.67 29.62 34.302 29.79 34.272 29.49 50 29.16 34.358 28.51 28.40 34.687 28.45 34.575 27.21 75 26.93 34.615 25.74 26.65 34.809 26.19 34.757 24.59 100 26.08 34.796 24.17 25.12 34.764 24.93 34.768 23.35 150 23.76 34.935 21.56 22.13 34.865 22.19 34.830 20.90 200 20.93 34.893 19.33 19.50 34.733 20.13 34.837 18.83 250 18.21 34.798 17.74 18.07 34.791 18.24 34.803 17.43 300 15.78 34.600 16.40 16.40 34.688 16.90 34.722 16.18 400 11.32 34.314 12.20 12.39 34.382 13.27 34.448 12.44 500 8.37 34.212 8.81 9.20 34.222 10.06 34.240 9.14 600 6.73 34.265 6.80 7.16 34.229 7.55 34.165 6.79 700 5.41 34.339 5.62 5.58 34.264 5.77 34.211 5.49 800 4.54 34.409 4.66 34.367 5.05 34.323 900 3.94 34.474 4.23 34.436 4.43 34.395 1000 3.58 34.519 3.90 34.486 4.03 34.450 1200 5.11(760m) 5.11(760m)
100 20.77 34.810 20.97 34.731 20.59 22.01 34.790 22.35 34.727 150 19.21 34.760 19.61 34.779 19.57 19.80 34.755 20.75 34.738 200 18.31 34.801 18.37 34.798 18.50 19.08 34.790 19.16 34.794 250 17.31 34.755 17.33 34.754 17.38 17.97 34.783 18.18 34.788 300 16.19 34.679 16.22 34.677 16.58 17.02 34.732 17.19 34.745 400 12.94 34.430 13.55 34.486 14.47 14.54 34.557 14.39 34.549 500 10.16 34.256 10.09 34.266 10.96 11.67 34.362 11.17 34.328 600 7.53 34.145 7.41 34.151 8.09 8.08 34.181 8.95 34.214 700 5.77 34.183 5.89 34.153 6.14 6.06 34.165 6.72 34.155 800 4.84 34.286 4.73 34.245 5.04 34.221 5.42 34.202 900 4.15 34.366 4.02 34.327 4.37 34.291 4.60 34.290 1000 3.76 34.429 3.75 34.373 3.84 34.361 4.00 34.341 1200 5.63(760m) Date 2009.9.24 2009.9.25 2009.9.25 2009.9.25 JST 22:36 7:58 15:17 23:40 St.No. 16 (XBT) 17 18 19 (XBT) Lat. 27-00.00N 28-00.00N 29-00.09N 29-59.97N Long. 132-23.51E 131-49.9E 131-18.02E 130-45.09E
Temp. (°C) Sal. (psu) Temp. (°C) Sal. (psu) Temp. (°C) Sal. (psu) Temp. (°C) Sal. (psu)
0 27.78 28.17 26.96 10 28.14 28.13 34.234 28.04 27.22 20 28.14 28.13 34.378 28.17 34.338 27.10 30 28.16 28.14 34.378 28.17 34.379 25.40 50 28.13 28.14 34.378 28.12 34.385 24.05 75 24.03 25.69 34.410 27.06 34.389 22.91 100 22.68 24.15 34.631 24.41 34.598 20.45 150 20.94 21.75 34.725 21.05 34.727 16.61 200 19.75 20.26 34.746 19.33 34.761 13.64 250 18.75 18.87 34.786 17.85 34.738 12.60 300 17.76 17.85 34.770 16.84 34.688 11.59 400 15.67 16.32 34.685 14.76 34.571 9.35 500 12.65 14.18 34.532 12.13 34.419 7.81 600 9.64 10.76 34.317 8.72 34.288 8.07 700 7.63 8.52 34.249 6.70 34.202 8.15 800 7.00 34.327 5.32 34.315 900 4.67 34.350 4.18 34.378 1000 3.87 34.368 3.54 34.399 1200 6.74(760m) 8.11(760m)
8 Mem. Fac. Fish. Kagoshima Univ., 59 (2010)
Appendix
Date 2003.9.21 2003.9.22 2003.9.22 2003.9.22 2003.9.22 JST 19:01 1:45 7:45 17:42 23:43 St.No. 1 2 3 4 5 Lat. 12-00.10N 13-00.02N 14-00.10N 15-00.10N 16-00.10N Long. 133-59.90E 133-59.98E 133-59.90E 134-00.00E 133-59.90ETemp. (°C) Sal. (psu) Temp. (°C) Sal. (psu) Temp. (°C) Sal. (psu) Temp. (°C) Sal. (psu) Temp. (°C) Sal. (psu) 0 29.67 34.171 29.49 29.81 33.942 30.49 30.30 34.384 10 29.53 34.166 29.48 34.154 29.74 33.935 29.73 34.051 30.28 34.383 20 29.36 34.156 29.23 34.129 29.65 33.935 29.66 34.060 29.99 34.362 30 29.33 34.155 29.21 34.153 29.68 34.000 29.62 34.057 30.01 34.396 50 29.30 34.159 29.21 34.189 29.60 34.305 29.61 34.106 29.92 34.417 75 28.87 34.451 28.21 34.556 28.83 34.474 28.61 34.561 28.42 34.657 100 26.63 34.694 26.37 34.845 26.95 34.767 27.10 34.796 27.10 34.802 150 20.13 34.883 21.73 34.930 22.84 34.952 23.79 35.089 23.00 35.038 200 15.67 34.621 16.32 34.673 18.79 34.831 18.74 34.819 19.57 34.885 250 12.18 34.429 13.28 34.482 14.64 34.566 14.64 34.559 16.79 34.692 300 10.30 34.403 10.23 34.361 11.71 34.401 11.93 34.365 14.29 34.522 400 8.41 34.489 7.96 34.384 8.72 34.333 8.54 34.211 10.51 34.314 500 7.35 34.509 7.03 34.454 6.92 34.394 6.91 34.276 7.67 34.286 600 6.52 34.516 6.21 34.507 6.07 34.453 5.92 34.391 6.16 34.321 700 5.89 34.521 5.52 34.504 5.47 34.489 5.35 34.456 5.46 34.430 800 5.37 34.529 5.11 34.537 4.88 34.519 4.85 34.490 4.83 34.480 900 4.85 34.541 4.65 34.539 4.40 34.538 4.35 34.523 4.45 34.518 1000 4.33 34.555 4.23 34.553 4.12 34.548 3.99 34.539 4.07 34.536 1200 Date 2003.9.23 2003.9.23 2003.9.23 2003.9.24 2003.9.24 JST 5:50 15:16 22:10 4:27 10:50 St.No. 6 7 8 9 10 Lat. 17-00.30N 17-59.99N 19-00.00N 19-59.90N 21-00.00N Long. 133-59.90E 134-00.02E 134-00.00E 134-00.00E 133-59.80E
Temp. (°C) Sal. (psu) Temp. (°C) Sal. (psu) Temp. (°C) Sal. (psu) Temp. (°C) Sal. (psu) Temp. (°C) Sal. (psu) 0 29.83 29.76 29.04 34.419 28.92 29.38 10 29.83 33.977 29.59 29.06 34.418 28.92 34.558 29.32 34.748 20 29.64 33.956 29.56 29.06 34.417 28.92 34.558 29.31 34.768 30 29.59 33.958 29.52 29.13 34.478 28.92 34.560 29.29 34.813 50 29.66 34.116 29.47 29.21 34.610 28.87 34.595 28.53 34.838 75 29.21 34.399 28.53 26.94 34.866 25.80 34.889 25.13 35.014 100 27.98 34.613 27.62 23.83 35.000 23.14 34.929 23.75 35.026 150 24.55 35.011 24.87 21.08 34.935 20.66 34.917 21.30 34.962 200 21.37 35.002 21.84 19.19 34.857 19.28 34.864 19.13 34.856 250 18.17 34.783 18.53 17.85 34.775 18.04 34.791 18.12 34.796 300 15.09 34.574 15.81 16.76 34.708 16.62 34.700 16.98 34.721 400 10.62 34.284 11.52 13.19 34.463 14.00 34.520 14.08 34.528 500 7.97 34.217 8.41 9.21 34.208 10.89 34.309 10.81 34.287 600 6.39 34.294 6.72 7.06 34.171 7.92 34.165 8.04 34.162 700 5.67 34.410 5.95 5.35 34.235 6.06 34.175 6.40 34.182 800 5.12 34.477 5.30 4.84 34.365 5.08 34.277 5.32 34.247 900 4.67 34.507 4.77 4.44 34.440 4.52 34.386 4.63 34.335 1000 4.21 34.527 4.30 3.98 34.496 3.85 34.413 4.03 34.392 1200
150 22.31 35.038 22.04 35.028 20.34 34.896 18.81 34.836 19.33 34.871 200 20.54 34.956 20.55 34.953 18.80 34.833 18.01 34.791 18.44 34.833 250 19.12 34.858 19.14 34.856 17.80 34.779 17.19 34.739 17.88 34.796 300 18.16 34.786 18.01 34.775 16.95 34.725 16.16 34.679 17.15 34.745 400 16.11 34.665 16.01 34.661 14.58 34.579 13.45 34.498 15.03 34.604 500 12.68 34.423 13.13 34.455 11.48 34.367 10.79 34.317 12.36 34.420 600 9.59 34.213 9.85 34.230 8.53 34.195 8.10 34.178 9.83 34.252 700 7.34 34.168 7.30 34.158 6.85 34.163 6.32 34.160 7.51 34.160 800 5.86 34.214 5.90 34.205 5.65 34.198 5.28 34.192 5.69 34.177 900 5.02 34.276 5.05 34.295 4.70 34.281 4.36 34.274 4.67 34.256 1000 4.41 34.368 4.42 34.375 4.11 34.341 3.93 34.356 4.10 34.309 1200 Date 2003.9.26 2003.9.26 2003.9.26 2003.9.27 2003.9.27 JST 6:28 13:10 20:33 6:24 14:27 St.No. 16 17 18 19 20 Lat. 27-00.10N 27-59.99N 28-59.90N 29-59.90N 30-59.93N Long. 133-59.60E 134-00.15E 134-00.10E 133-59.70E 133-59.93E
Temp. (°C) Sal. (psu) Temp. (°C) Sal. (psu) Temp. (°C) Sal. (psu) Temp. (°C) Sal. (psu) Temp. (°C) Sal. (psu) 0 29.03 27.19 27.66 26.80 27.51 10 29.02 34.847 27.16 34.610 27.67 34.586 26.80 34.553 27.51 34.554 20 29.02 34.847 26.72 34.618 27.42 34.602 26.80 34.552 27.51 34.554 30 29.03 34.847 26.63 34.630 26.85 34.607 26.76 34.550 27.49 34.554 50 26.02 34.938 26.49 34.639 22.46 34.797 26.48 34.559 24.57 34.729 75 23.00 34.943 25.43 34.741 20.72 34.829 21.18 34.836 21.98 34.862 100 20.97 34.919 21.58 34.891 19.23 34.815 20.01 34.875 20.56 34.886 150 19.40 34.879 19.74 34.898 17.83 34.789 18.57 34.837 19.42 34.875 200 18.56 34.843 19.17 34.874 17.31 34.757 17.81 34.787 18.68 34.828 250 18.03 34.810 18.60 34.831 16.77 34.741 17.04 34.739 18.22 34.817 300 17.42 34.766 18.04 34.796 16.36 34.718 16.40 34.704 17.41 34.751 400 15.99 34.665 16.10 34.675 14.09 34.549 14.08 34.550 16.14 34.694 500 13.60 34.507 13.58 34.511 11.07 34.363 10.95 34.345 13.41 34.499 600 11.13 34.340 10.60 34.310 8.35 34.241 8.48 34.252 10.95 34.348 700 8.06 34.165 8.34 34.250 6.21 34.218 6.43 34.237 8.62 34.232 800 6.41 34.139 6.48 34.234 4.97 34.269 5.26 34.273 6.04 34.197 900 5.09 34.200 5.41 34.278 4.14 34.346 4.46 34.329 4.99 34.267 1000 4.37 34.271 4.37 34.317 3.78 34.394 3.87 34.389 4.30 34.320 1200