An Economic Analysis of Commercial Fish
Landings in the Republic of Palau
著者
TAUFIQ Muhammad, MATSUDA Yoshiaki
journal or
publication title
南海研紀要
volume
8
number
2
page range
206-227
URL
http://hdl.handle.net/10232/15699
An Economic Analysis of Commercial Fish Landings
in the Republic of Palau
Muhammad TAUFIQ* and Yoshiaki MATSUDA*
Abstract
To evaluate the trend of current commercial fisheries landings in Palau, landing and price patterns, species characteristics, quantity-price relationships, gear, trade
features, and international cooperation aspects were analyzed. Palau's fisheries
have many problems and much potential. The problems include follow-up of
JICA's cooperation, the PFFA's mismanagement and commercial fisheries
development policy including a fixed-price policy, fish handling and grant vessel
management. Potential exists not only in solving these problems, but also in
developing trochus shell factories, removing institutional constraints for the MMDC, and in utilizing potentially valuable shorebased structures such as the Van Camp
facilities.
Key words : Fisheries, Fisheries development, Fisheries economics, Palau, Pacific
islands.
Introduction
The Palau archipelago consists of numerous islands, which are encircled by a 396 kilometers-long barrier reef encompassing a lagoon with an area of 1,449
kilometers (PERRON et al., 1983). The average annual yield from intensive reef
and lagoon fin-fisheries lies between one and five metric tons (MT) per square
kilometer (JOHANNES, 1981). Palau therefore appears to have a potential annual
hervest of somewhere between 2,000 to 11,000 MT of reef fish per year. In addition
there are significant stocks of crustacean, molluscs and pelagic fish outside the
reef.
The total subsistence catch is roughly estimated as 1,628 MT per year (PERRON
* Muhammad Taufiq, feHgW, Slfi&^Jfcjg^SBHI&rS^iftm^SS&
Laboratoty of International Marine Policy, Faculty of Fisheries. Kagoshima University. 50-20, Shimoarata 4-chome, Kagoshima 890, Japan
Mem. Kagoshima Univ. Res. Center S. Pac, Vol. 8, No. 2, 1987 207
et al., 1983). Commercial fish landings in 1985 was 334 MT, comprised of reef
fish (78 %), pelagic fish (21 %) and others. In addition, the average annual catch
of trochus shells range from 100 to 300 MT. There seems to be room for a
great expansion in fisheries. Now, fisheries resources in Palau are regarded as
important, because of its contribution to the national economy.
In the 5 year development plan beginning in 1986, the government decided to invest about 17.3 % of the economic sector's allocations or 1.8 % of the national development ones in fisheries development.
Since the withdrawal of the Van Camp Seafood Company in 1982, an
industrialization of fisheries in Palau has been set back while commercial fisheries
received more attention. The Palau Federation of Fishing Association (PFFA)
and the Palau Fishing Authority (PFA) are closely tied with commercial fisheries
development. Although such commercial fisheries have been greatly promoted
by a recent (1983) grant from the Japan International Cooperation Agency (JICA),
there are some problems.
The purpose of this study is to evaluate the trend of Palau's current commercial fisheries landings from the viewpoints of annual and seasonal fluctuations, fixed price policy, trade potential and international cooperation. To do this, statistical
data were collected from the PFFA and Division of Marine Resources, and the
Office of Planning and Statistics of the Government of Palau, and interviews with
many people concerned with fisheries development in Palau during the period
of November 11-24, 1986.
These data were analyzed mainly by an NEC personal computer N5200 Model 07 along with landing and price patterns, species characteristics, quantity-price relationships, gear, and features of trade.
1. Major Species in Commercial Fish Landings
Over the last ten years from 1976 through 1985, commercial fish landings
at the PFFA's market were dominated by reef fish (Table 1). In 1976, total
commercial fish landings were 102,353 kilograms ( kg.) or $.74,437. Of these, reef fish comprised more than 90% in both weight (90.01 % or 92,183 kg.) and value
(90.42% or $67,303). The portions of pelagic fish were 8.59% (8,791kg.) in
weight or 5.79% ($4,311) in value, while those of invertebrates were 1.40% (1,429 kg.) or 3.79% ($2,818).
In 1985, ten years later, the total commercial fish landings were 333,025 kg.
or $438,119, an increase of 225% in weight and 489% in value. From 1976
to 1985, portions of both reef fish and invertebrates declined from 90.01 % to
77.75 % in weight or from 90.42 % to 79.79 % in value for reef fish and from 1.40% to 1.00% in weight or from 3.79% to 2.97% in value for invertebrates.
On the contrary, the portion of pelagic fish increased from 8.59% to 21.25% in weight or from 5.79 %
Table 1. Commercial fish landings in Palau: 1976 and 1985 (modified from the Division of Marine Resources,
1986 and Perron et al, 1983).
19 7 6 1 9 8 5 Species KG. %ST %T s %ST %T KG. %ST %T $ %ST % T I.Reef fish 92,133 100.00 90.01 67.303 100.00 90.42 258,915 100.00 77.75 349,576 100.00 79.79 Snapper 19,655 21.33 19.20 13,813 20.52 18,56 108,337 41.08 31.93 136,263 38.98 31.10 Parrot fish 11,383 12.36 11.12 8,901 13.23 11.96 42,550 16.43 12.78 48,047 13.74 10.97 Grouper 1,541 1.67 1.50 1,026 1.52 1.38 21,349 8.25 6.41 22,893 6.54 5.23 Rabbit fish 11,508 12.49 11.24 8,867 13.17 11.91 18,513 7.15 5.56 31,998 9.15 7.30 Unicorn fish 8,257 8.96 8.07 6,165 9.16 8.28 37,315 14.41 11.20 46,353 13.26 10.58 Jack 3,002 3.26 2.93 1,677 2.49 2.25 13,119 5.07 3.94 13,620 3.90 3.11 Goat fish 1.009 1.10 0.99 680 1.01 0.91 2,622 1.01 0.79 3,764 1.08 0.86 Wrasse 569 0.62 0.54 414 0.62 0.56 3,435 1.33 1.03 5,313 1.52 1.21 Surgeon fish 337 0.37 0.33 247 0.37 0.33 1,967 0.76 0.59 2,172 0.62 0.50 Squirrel fish 18 0.02 0.02 12 0.02 0.02 530 0.20 0.16 551 0.16 0.13 Sweet lips - - - - - - 1,770 0.68 0.53 1,034 0.30 0.24 Mullet 3,231 3.51 3.16 2,648 3.93 3.56 2,435 0.94 0.73 3,745 1.07 0.85 Silver fish 2,009 2.18 1.96 1,543 2.29 2.07 15,161 0.60 0.47 2,067 0.59 0.47 Dolphin - - - - - - 385 0.15 0.12 580 0.17 0.13 Other reef f. 1,863 2.02 1.80 1,280 1.90 1.72 4,852 1.87 1.46 30,973 8.86 7.07 Assorted reef f. 27,749 30.12 2^.11 20.(135 29.77 26.92 174 0.07 0.05 203 0.06 0.05 2.Pelagic fish 8,791 - 8.59 4,311 - 5.79 70,766 -21.25 75,541 - 17.24 3.Invertebrates 14,290 - 1.40 2,818 - 3.79 3,344 - 1.00 13,002 - 2.97 Total 102.353 - 100.00 74.437 - 100.00 333.025 - 100.00 438.119 - 100.00
Note : KG. indicates kilograms ; % ST, portion of reef fish sub-total; % T, portion of grand total ; and $, US dollars.
The most economically important reef fish are the unicorn fish : um (Naso
unicornis); the snapper: mechur (Lethrinus variegatus), keremlal (Lutjanus gibbus),
udech (Lethrinus nematacanthus), metengui (Lutjanus haematopterus), and kedsau (Lutjanus bohar); the parrot fish : kemedukl (Bolbometopon muricatus) and ngyaoch
(Scarus harid); the grouper : temekai (Anyperdon leucogrammicus/Ephinephelus sp.)
and the rabbit fish : kelsebuul (Siganus gutatus lineatus) and meyas (Siganus
canalicatus). Total landings of these II species in 1985 were 211,172 kg. (81.6%
of reef fish) or $230,750 (66.0%). Other important reef fish include jack, goat
fish, wrasse, surgeon fish, squirrel fish, sweet lips, mullet, silver fish and dolphin.
Economically important pelagic fish include bonito : katsuo (Katsuonus
pelamis) and king mackerel : ngelngal (Scomberomorus commeron). Total landings of these two species in 1985 were 35,882 kg (50.7% of pelagic fish landings) or
$29,168 (38.61 %). Similarly important invertebrates include mangrove crab : emang (Scylla serrata) and lobster: lobster (Panulirus longipes/'Panulirus versicolor). Total landings of these two species in 1985 were 2,158 kg. (64.5% of invertebrates) or
Mem. Kagoshima Univ. Res. Center S. Pac, Vol. 8, No. 2, 1987 209
$ 11,374 (85.48 %).
Thus, total landings of commercially important 15 species comrised 249,213
kg. (74.8% of total fish landings) or $271,292 (61.92%). This paper analyzed
these 15 species mainly.
2. Annual Fluctuations: 1976-1985
Fish landings fluctuate annually. These fluctuations were analyzed in terms
of weight, average price and landing patterns by major species, and quantity-price
relationships. Due to the lack of data for 1982 and January through March
of 1983 and 1984 besides insufficient data for 1985, it is difficult to trace the
exact patterns of landings. However, some trends were clearly observed.
a. Landing patterns in weight
Commercial fish landings at the PFFA market during the 1976-1985 period
are shown in Fig. 1. Total fish landings increased by 111 % from 102,353kg.
in 1976 to 216,061kg. in 1979, then declined to 98,632 kg. in 1981, but again
increased to 333,025 kg. in 1985, equivalent to a 225% increase from the 1976
level. The reasons for both 1978 and 1981 declines were not known, though
the former case was due to the low harvest of reef fish whereas the latter case
WEIGHT
197G 1978
UNIT : METRIC TON
1980 1982 1984 YEARS
REEF FISH
D PELAGIC FISH A - — INVERTEBRATES
X - — TOTAL
Note : Data was not available for 1982 and January through
March 1983 and 1984.
Fig. I. Palau's fish landings in weight: 1976-1985 (modified from the Division of Marine Resources. 1986 and Perron et al., 1983)
was correlated with both reef fish and pelagic fish landings.
With annual fluctuations ranging from 91,133 kg. to 258,915 kg., reef fish
landings followed a similar pattern with the total landings while pelagic species
(8,719 kg.-98,896 kg.) and invertebrates (1,054 kg.-4,2l3 kg.) followed modified ones.
The 1978 decline in reef fish landings was somewhat compensated for by an increase in pelagic fish landings.
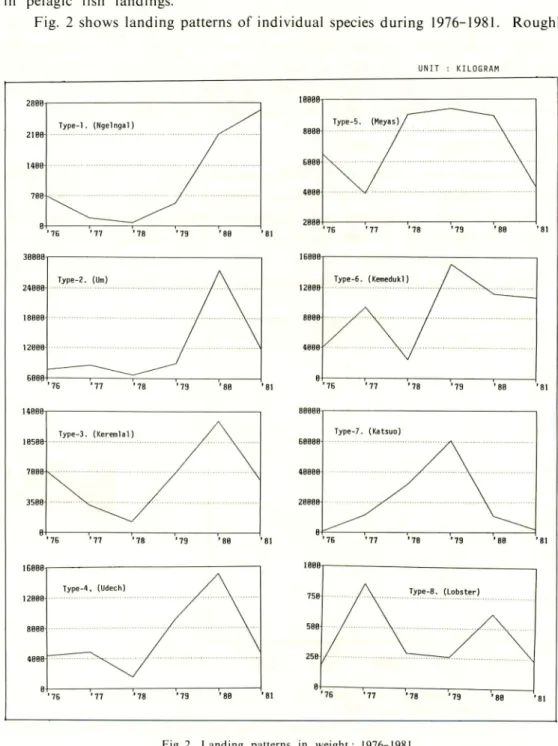
Fig. 2 shows landing patterns of individual species during 1976-1981. Roughly
UNIT : KILOGRAM
Type-1. (Ngelngal)
'76 '77 '78 '79 '86 '81 '76 '77 '78 '79
Mem. Kagoshima Univ. Res. Center S. Pac, Vol. 8, No. 2. 1987 211
speaking, 8 types were indentified. Type-1 is characterized by the peak landings in 1981 and represented by ngelngal with peak landings of about 2,600 kg. Types
2-4 are characterized by the highest landings in 1980. The following differences
were observed : one outstanding peak landings (type-2), two increases over the
previous year's landings (type-3) and 3 increases against the previous year's landings (type-4). Type-2 is represented by um with the highest landings of about 27,500 kg. and includes metengui, sebus (Lutjanus spp.) and keskas (Acanthocybium solandari). Keremlal with the highest landings of about 13,000 kg. represents type-3 which includes ngyaoch, kelsebuul, mechur and emang. Type-4 is represented
by udech with the highest landings of about 15,000 kg. and includes kedsau.
Types 5-7 are characterized by the highest landings in 1979. The following differences were observed : outstanding landings of 3 years or more (type-5), two peak landings (type-6), and one outstanding peak landing (type-7). Type-5 is
represented by meyas with highest landings of about 9,500 kg. while type-6 is
represented by kemedukl with the highest landing 9,500 kg. while type-6 is
represented by kemedukl with the highest landings of about 15,000 kg. and includes
temekai. Type-7 is represented by katsuo with the highest landings of about
60,500 kg.
Type-8 is characterized by the highest landings in 1977 and represented by
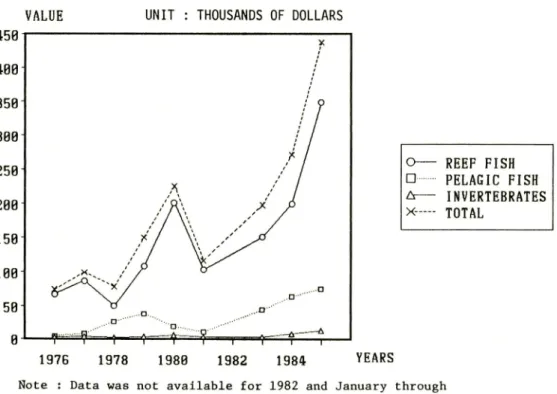
VALUE
197G 1978
UNIT : THOUSANDS OF DOLLARS
198B 1982 1984 YEARS
O — REEF FISH
• PELAGIC FISH
A — INVERTEBRATES
X-— TOTAL
Note : Data was not available for 1982 and January through
March 1983 and 1984.
Fig. 3. Palau's fish landings in value: 1976-1985 (modified from the Division of Marine Resources, 1986 and Perron et al, 1983)
lobster with the highest landings of about 860 kg..
b. Average price patterns
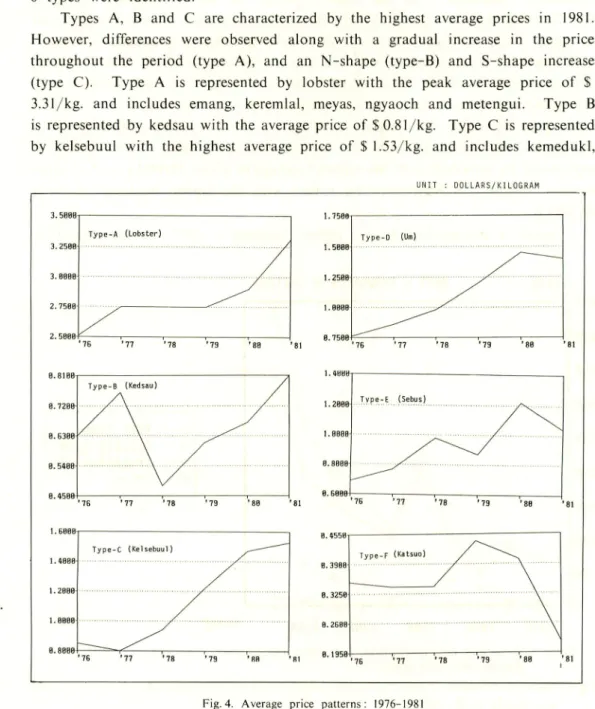
Fish landings in value at the PFFA's market during 1976-1985 are shown in Fig. 3. Patterns are slightly different from the previous weight patterns. Thus, average price patterns were further examined (Fig. 4). Due to the lack of comparable
species data for 1985, the analysis was limited to the 1976-1981 period when
6 types were identified.
Types A, B and C are characterized by the highest average prices in 1981.
However, differences were observed along with a gradual increase in the price
throughout the period (type A), and an N-shape (type-B) and S-shape increase
(type C). Type A is represented by lobster with the peak average price of $
3.31/kg. and includes emang, keremlal, meyas, ngyaoch and metengui. Type B
is represented by kedsau with the average price of $ 0.81/kg. Type C is represented
by kelsebuul with the highest average price of $ 1.53/kg. and includes kemedukl,
Type-A (Lobster) 1.6868 Type-C (Kelsebuul) 1.2B8B 1.8888 8. 8888 76 '"77 ''78 '79 '88 ' UNIT : DOLLARS/KILOGRAM Type-D (Um)
Mem. Kagoshima Univ. Res. Center S. Pac, Vol. 8, No. 2, 1987 213
temekai and udech.
Types D and E are chracterized by the highest average prices in 1980 and
differences were also observed along with the following features: one outstanding peak average price (Type D) and two outstanding peak avearage price (Type E). Type D is represented by um with the peak average price of $ 1.45/kg. and includes keskas, while type E is represented by sebus with the highest average price of $ 1.22/kg. and includes ngelngal. The type F is characterized by the peak average price in 1979 and represented by katsuo with the peak average price of $0.44/
kg-c. Landing patterns by major species
Landing patterns by major species are summarized in Table 2. Identified
types are combinations of landing patterns in weight and average price patterns in the sub-sections a and b of this section.
Table 2. Annual landing patterns by major species: 1976-1981
(modified from the Division of Marine Resources, 1986).
Range in landings Av price range
Categories English name Palauan name Type* (kg.) ($/kg)
min. m a x . min. m a x .
Reef fish Snapper Metengui 2-A 16 9,888 0.56 1.09
Keremlal 3-A 1,271 12,929 0.66 1.32
Mechur 3-A 225 5,287 0.75 1.32
Kedsau 4-B 450 2,335 0.48 0.81
Udech 4-C 1,546 15,154 0.64 1.05
Parrot fish Ngyaoch 3-A 1,166 11,350 0.73 1.32
Kemedukl 6-C 2,444 15,121 0.82 1.46
Rabbit fish Kelsebuul 3-C 2,668 10,575 0.80 1.53
Meyas 5-A 3,898 9,422 0.72 1.32
Grouper Temekai 6-C 861 9,872 0.56 0.82
Unicorn fish Um 2-D 6,725 27,545 0.76 1.45
Pelagic King mackerel Ngelngal 1-E 72 2,642 0.54 1.11
fish Bonito Katsuo 7-F 719 60,679 0.22 0.44
Inverte Mangrove crab Emang 3-A 211 1,186 1.67 3.12
brates Lobster Lobster 8-A 180 860 2.51 3.31
""Combination of landing patterns in weight and average price patterns in the sub
sections a and b (Figs. 2 and 4).
During 1976-1981, reef fish landings ranged from 58,968 kg. to 158,760 kg.
while avarage prices of those ranged from $ 0.48/kg. to $ 1.53/kg. With the annual fluctuations ranging from 3,508 kg. to 45,593 kg. and from $ 0.48/kg. to $ 1.32/kg.,
the snapper fell into 4 types: 2-A, 3-A, 4-B, and 4-C. Type 2-A is represented
type 3-A is represented by keremlal and includes mechur while types 4-B and 4-C are represented by kebsau and udech, repectively. In summary, keremlal
and mechur (Type 3-A) received the highest average prices while kedsau (Type
4-B) received the lowest ones.
Ranging from 5,475 kg. to 31,126 kg. and from $ 0.73/kg. to $ 1.46/kg. the
parrot fish fell into two types: 3-A and 6-C. Type 3-A is represented by ngyaoch while type 6-C is represented by kemedukl. From weight and price points of
view, kemedukl (Type 6-C) seems to be preferable to ngyaoch (Type 3-A).
Ranging from 7,742 kg. to 20.984 kg. and from $ 0.72/kg. to $ 1.53/kg., the
rabbit fish fell into two types: 3-C and 5-A. Type 3-C is represented by kelsebuul
while type 5-A is represented by meyas. The market prefers kelsebuul slightly to meyas.
The grouper (temekai) belongs to type 6-C whereas the unicorn fish (um) to type 2-D. Among reef fish, the grouper (temekai) is one of the least preferable species as compared to the unicorn fish (um) which belongs to the highest demanded fish with high landings in both weight and value.
Palagic fish ranged from 8,791 kg. to 91,227 kg. and from $ 0.22/kg. to $ 1.11/
kg. Major pelagic fish are king mackerel (ngelngal) and bonito (katsuo) belonging
to types 1-E and 7-E, respectively. They received the lowest market prices among
mojor species. In 1979, katsuo alone landed 60,679 kg. However, average prices
of katsuo reached the peak in the same year.
Invertebrates landings ranged from 1.054 kg. to 4,213 kg. and from $ 1.67/kg.
to $ 3.31/kg. in average prices. Major invertebrates, the mangrove crab (emang)
and lobster, belong to types 3-A and 8-A, respectively. These landings are small,
so that their average prices are quite high. d. Quantity-price relationships: 1976-1981
Except for ngelngal, um, kedsau and katsuo, simple regression analyses indicate
very low relationships between average prices and landings (Table 3). Those
with high correlation have the significant level as low as 10%. due to small
numbers of samples. Although normal quantity-price relationships are negative,
our study indicated that most cases had positive realtionships between average
prices and landings.
3. Monthly Fluctuations: 1985
Monthly flutuations of commercial fish landings were analyzed similarly to annual fluctuations. Due to the lack comparable data, this analysis was limited
only to the period of 1985. a. Landings patterns in weight
Mem. Kagoshima Univ. Res. Center S. Pac, Vol. 8, No. 2, 1987 215
Table 3. Quantity-price relationships; 1976-1981.
(Y = aX + b, where Y and X indicate quantity and price, respectively)
Categories English name Palauan name a b r (Sig. level)* cor** Reef fish Snapper Kedsau 3,769.44 1,143.33 0.659(22 10%) High
Keremlal 7,820.18 -1,494.61 0.534(22 10%) Low Mechur 2,078.59 1,051.74 0.230(5 10%) Non
Metengui 9,869.85 -6,576.32 0.559(5:10%) Low Udech 10,778.70 -1,852.71 0.349(2:10%) Non Parrot fish Kemedukl 5,726.46 2,588.16 0.342(2210%) Non
Ngyaoch 8,387.80 -2,931.21 0.528(5 10%) Low Rabbit fish Kelsebuul 5,211.23 -913.92 0.550(5 10%) Low
Meyas -612.89 7,629.70 -0.055(5 10%) Non
Grouper Temekai -15,961.00 16,591.00 -0.474(5 10%) Low Unicorn fish Um 19,559.50 -9,811.45 0.712(510%) High Pelagic King mackerel Ngelngal 3,930.55 -2,046.98 0.797 ( 10%) High
fish Bonito Katsuo 199,267.00 -49,725.80 0.644(510%) High Inverte Mangrove crab Emang 80.22 422.50 0.123(510%) Non
brates Lobster Lobster -31.91 497.42 -0.031 (510%) Non
'Correlation coefficient (Significance level)
"Correlation
WEIGHT UNIT : METRIC TON
ft
A
, I \ X \ ft x'/
X X / 1 X V\v/
p. D p. D - ...n a... a a a a \A~- —A— —A—
T T - \—- 1 -—*t— l - T - T ""?•" =**f— "1 O REEF FISH • PELAGIC FISH A INVERTEBRATES X-- TOTAL 45 48 35 38 25 20 15 18 5 8 Fig-J F M A M Fig-J Fig-J A S O N D MONTH
5. Palau's monthly fish landings in weight: 1985 (modified from the Division of Marine Resources, 1986 and Perron et al, 1983)
Dominated by reef fish, total landings fluctuated between 11,389 kg. in February
patterns of reef fish and pelagic fish were similar with the total landings as compared
to those of invertebrates. Invertebrates landings peaked in June whereas landings
of reef fish peaked in May, July, and November; and pelagic fish landings peaked in July, September, and November. Reef fish landings range from 10,625 kg. in
February to 32,049 kg. in May as compared to pelagic fish landings from 258 kg. in January to 12,459 kg. in November, and invertebrate landings from 43 kg. in
January to 726 kg. in June.
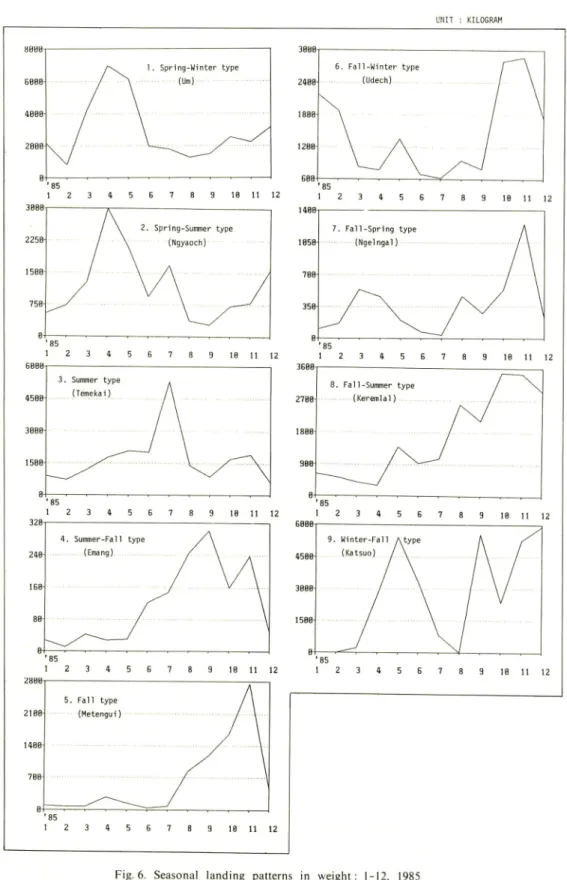
Monthly landing patterns of individual species are shown in Fig. 6. Based
on peak landing patterns, the following 9 types were identified. The Spring-Winter (S-W) type is characterized by an outstanding landing peak in spring with a sub-peak in winter. This type is represented by um with peak landings of 6,961 kg. in April and 3,161 kg. in December and includes kemedukl with peak landings
of 3,771 kg. in April and 2,804 kg. in January. The Spring-Summer (S-Su) type
is chracterized by an outstanding landing peak in spring with a sub-peak in summer. This type is represented by ngyaoch with peak landings of 2,998 kg. in April
and 1,680 kg. in July. This includes meyas with peak landing of 1,630 kg. in
April and 1,300 kg. in July. The Summer (Su) type is characterized by a landing peak in July. This type is represented by temekai with a peak landing of 5,296
kg. and includes mechur with a peak landing of 1,984 kg. The Summer-Fall
(Su-F) type is characterized by outstanding landing peaks in summer with a
sub-peak in fall. This type is represented by emang with peak landings of 301 kg.
in September and 238 kg. in November, and included lobster with peak landings
of 210 kg. in August and 103 kg. in November.
The Fall (F) type is characterized by a landing peak in fall and represented
by metengui with a peak landing of 2,755 kg. in November. The Fall-Winter
(F-W) type is characterized by an outstanding landing peak in fall with a
sub-peak in winter. This type is represented by udech with peak landings of 2,866
kg. in November and 2,176 kg. in January. The Fall-Spring (F-S) type is
characterized by an outstanding landing peak in fall with a sub-peak in spring. This type is represented by ngelngal with peak landings of 1,248 kg. in November
and 538 kg. in March. The Fall-Summer (F-Su) type is characterized by an
outstanding landing peak in fall with a sub-peak in Summer. This type is
represented keremlal with peak landings of 3,480 kg. in October and 2,587 kg. in August. This type includes kedsau with peak landings of 2,443 kg. in October and 1,949 kg. in June.
The Winter-Fall (W-F) type is characterized by an outstanding landing peak
in winter with a sub-peak in fall. This type is represented by katsuo with peak
landings of 5,912 kg. in December and 5,538 kg. in September. This type includes
Mem. Kagoshima Univ. Res. Center S. Pac, Vol. 8, No. 2, 1987 217 9 18 11 12 1 2 3 4 5 6 7 9 IB 11 12 UNIT : KILOGRAM mm 1 2 3 4 5 6 7 8 9 IB 11 1 45BB 9. Winter-Fall (Katsuo) Atype 38BB 15BB-8 1 2 3 4 5 6 7 9 IB 11 12
b. Average price patterns
Mothly fish landings in value at the PFFA's market by month are shown in Fig. 7. As in Fig. 5, the total landing pattern in value ranged from $ 16,791.75 in February to $ 62,775.04 in November and appears to be similar with that in
weight. However, both landing patterns of pelagic fish and invertebrates are slightly
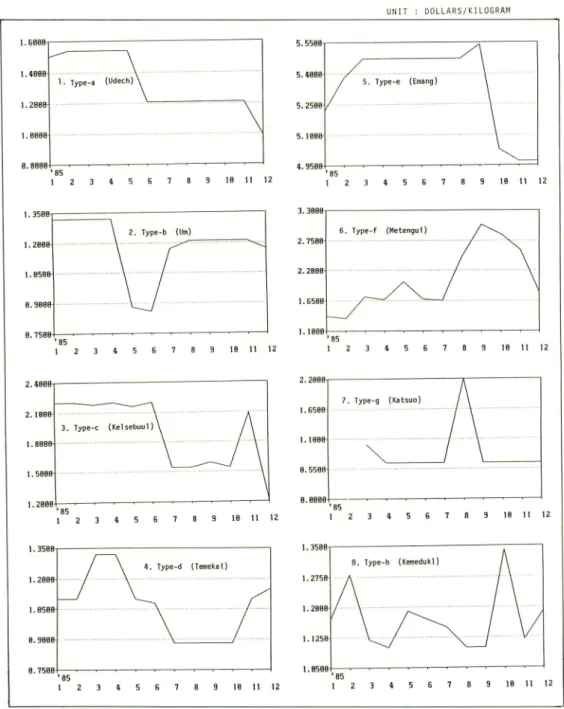
different between weight and value.Monthly average price patterns are further examined in Fig. 8. Eight types
(a-h) are identified.
Types a through d received the highest average prices in
spring as compared to types f through h receiving the highest prices in summer
and/or fall, while type-e was in between.
Type-a is characterized by the highest average prices in spring with a decline in price until December. This type is represented by udech with the highest average price of $ 1.54/kg. and the minimum price of $ 0.99/kg. in December.
Type-b is characterized by the highest average prices in spring with minimum
price in May or June after a sharp decline, and a rapid recovery in July.
This
type is represented by um with the highest average price of $ 1.32/kg. in January through April and the minimum price of $ 0.86/kg. in June, and includes keremlal,
ngyaoch, mechur and meyas.
Type-c is characterized by the highest average prices in spring and fall, with the medium prices in July through October, and the minimum price in December.
VALUE UNIT : THOUSANDS OF DOLLARS
O — REEF FISH • PELAGIC FISH A — INVERTEBRATE X- - TOTAL
1 2 3 4 5 G 7 8 9 10 11 12 MONTH
Fig. 7. Palau's monthly fish landings in value: 1985 (modified from the Division of Marine Resources, 1986 and Perron et al., 1983)
Mem. Kagoshima Univ. Res. Center S. Pac, Vol. 8, No. 2, 1987 219 UNIT : DOLLARS/KILOGRAM 1. Type-a (Udech) 1 2 3 4 5 6 7 8 S IB 11 12 1 2 3 4 5 6 7 9 IB 11 12 j 2 3 4 5 6 7 8 9 IB 11 12 4. Type-d (Temekai) 1 2 3 4 5 6 7 8 9 IB 11 12 5.5588 5. type-e (Emang) | 2 3 4 5 6 7 8 9 IB 11 12 6. Type-f (Metengui) 1 2 3 4 5 6 7 8 9 IB 11 12 7. Type-g (Katsuo) 1 2 3 4 5 6 7 8 9 IB 11 12 8. Type-h (Kemedukl '85 1 2 3 4 5 6 7 8 9 18 11 12
Fig. 8. Monthly average price patterns: 1985
This type is represented by kelsebuul with the highest average price of $ 2.20/kg.
and the minimum price of $ 1.54/kg. Type-d is characterized by peak average
prices in spring and with the minimum price in July through October. This
type is represented by temekai with the highest average price of $ 1.32/kg. and the minimum price of $ 0.88/kg., and includes kedsau.
September with a sharp price decline in fall. This type is represented by emang with the highest average price of $ 5.47/kg. in September and the minimum average price of $ 4,97/kg. in November through December, and includes lobster with the highest average price of $ 5.45/kg. in February through August and the minimum
price of $ 3.40/kg. in September.
Type-f is characterized by a grandual price increase in spring and summer and the highest average price in fall. This type is represented by metengui with the highest average price of $ 3.04/kg. in September and the minimum price of
$ 1.33/kg. in February.
Type-g is characterized by the highest average price in August with low prices
for the rest of the year. This type is represented by katsuo with the highest
average price of $ 2.20/kg. in August and the minimum price of $ 0.66/kg. January
through February are off-season for katsuo.
Type-h is characterized by the highest average price in fall with other peak
prices. This type is represented by kemedukl with the highest average price of
$ 1.34/kg. in October and the minimum price of $ 1.10/kg. in April, August and
September.
c. Landing patterns by major species
Monthly landing patterns by major species are summarized in Table 4. Types
were classified according to combinations of landing patterns in weight and average
Table 4. Monthly landing patterns by major species: 1985
(modified from the Division of Marine Resources, 1986).
Range in landings Av. price range Categories English name Palauan name Type* (kg.) ($/kg)
min. max. min. max. Reef fish Snapper Mechur Su./b 304 1,984 1.10 1.32
Metengui F/f 49 2,755 1.33 3.04
Udech F-W/a 620 2,866 0.99 1.54 Keremlal F-Su/b 301 3,480 1.04 1.32 Kedsau F-Su/d 225 2,443 0.79 1.10 Parrot fish Kemedukl S-W/h 431 3,771 1.10 1.34
Ngyaoch S-Su/b 290 2,998 0.88 1.32 Rabbit fish Kelsebuul W-F/c 156 2,030 1.21 2.20
Meyas S-Su/b 1 1 1,630 1.06 1.54
Grouper Temekai S/d 615 5.296 0.88 1.32
Unicorn fish Um S-W/b 836 6,961 0.88 1.32
Pelagic King mackerel Ngelngal F-S/f 39 1,248 1.46 2.20 fish Bonito Katsuo W-F/g 10 5,912 0.66 2.20 Inverte Mangrove crab Emang S-F/e 11 301 4.97 5.54 brates Lobster Lobster S-F/e 4 210 3.40 5.45
'Combination of landing patterns in weight type and average price patterns types as mentioned in the text: S, Su, F, and W indicate spring, summer, fall and winter (Figs. 6 and 8)
Mem. Kagoshima Univ. Res. Center S. Pac, Vol. 8, No. 2, 1987 221
price patterns in the sub-sections a and b of this section.
The snapper fell into 5 types: Su/b (mechur), F/f (metengui), F-W/a (udech), F-Su/b (keremlal) and F-Su/d (kedsau). Most of them had their peak landings in summer and/or fall. Except for metengui, all received their highest average prices in spring. Ranging from 49 kg. to 2,755 kg. of landings per species, monthly average prices received by the snapper ranged from S 0.79/kg. to $ 3.04/kg. Metengui received the higest average price while kedsau received the lowest price.
The parrot fish fell into 2 types: S-W/a (kemedukl) and S-Su/b (ngyaoch). Both had their highest landings in spring. Although kemedukl received the highest average price in fall, ngyaoch received the higest prices in January through April. Ranging from 290 kg. to 3,771 kg. in landings per species, average prices received by the parrot fish ranged from $ 0.88/kg. to $ 1.34/kg. The prices of kemedukl
were slightly higher than those of ngyaoch.
The rabbit fish fell into 2 types: W-F/c (kelsebuul) and S-Su/b (meyas). Kelsebuul had peak landings in winter and fall while meyas had them in summer and spring. From landings point of view, these two species are completely complementary. Nevetheless, both received their higest average prices in spring. Ranging from 11 kg. to 2,030 kg. in landings per species, average prices received by the rabbit fish ranged from $ 1.60/kg. and $ 2.20/kg. The price response to
kelsebuul was better than that to meyas.
The grouper fell into type S/d with the peak landings in summer and the
higest average price in spring. This is represented by temekai with monthly landings ranging from 615 kg. to 5,296 kg. and average prices from $ 0.88/kg. to $ 1.32/kg. The unicorn fish fell into type S-W/b with peak landings in summer and winter with the highest average prices in spring. This is represented by um with monthly landings ranging from 836 kg. to 6,961 kg. and the same average price range as temekai.
Thus, reef fish were harvested throughout the year and ranged from $ 0.79/ kg. to $ 3.04/kg. in average prices. Metengui in the snapper and kelsebuul of the rabbit fish received the higher prices whereas kedsau of the snapper received
the lowest prices.
Major pelagic fish fell into two types: F-S/f and W-F/g with peak landings in fall and spring. Type F-S/f is represented by ngelngal ranging from 39 kg. to 1,248 kg. in monthly landings and from $ 1.46/kg. to $ 2.20/kg. in average prices.
With peak landings in winter and fall, type W-F/g is represented by katsuo ranging
from 10 kg. to 5,912 kg. and from $ 0.66/kg. to $ 2.20/kg. However, the peak
average price of $ 2.20/kg for katsuo was in August in which the landings were
only 10 kg. As a whole, the average price of katsuo was $ 0.66/kg. in that year while ngelngal received much higher average prices than katsuo.
Major invertebrates fell into Su-F/e type with peak landings in summer and
one or two months exceptions. This type is represented by emang and lobster.
Ranging from 4 kg. to 301kg. of landings per species, monthly average prices
received by the invertebrates ranged from $ 3.40/kg. to $ 5.54/kg. Emang received
higher average prices than lobster.
d. Quantity-price relationships
Results from simple regession analyses between monthly average prices of fish and landings are summarized in Table 5. Out of the 15 most economically important species at the PFFA's market in 1985, only 3 species had high correlations between average prices and landings. Those three species are metengui with the significance
lavel of 1 %, and kemedukl and meyas at the 5 % level. Such correlations of
metengui and meyas were positive while that of kemedukl was negative. Although
mechur, meyas and ngelngal had low correations, 10 out of 15 species had no correlation between average prices and landings.
4. Landing Patterns by Gear
Recent landing patterns by gear are summerized in Fig.9. The upper graph
shows the monthly fish landings at the PFFA's market from January 1985 to
September 1986. Suppliers are categorized into 3 gear groups: fishermen with
grant vessels (grant vessels), individual fishermen(ind. fishermen) and other boat owners (other boats). The lower 4 graphs show the results of simple trend analyses
Table 5. Monthly quantity-price relationships: 1985.
(Y=aX + b, where Y and X indicate quantity and price, respectively)
Categories English name Palauan name a b r (sig. level)* cor** Reef fish Snapper Mechur -3,477.27 5,088.79 -0.536 ( 10%) Low
Metengui 1,141.70 -1,654.63 0.781 ( 1%) High
Udech -341.94 2,028.27 -0.101 (2210%) Non Keremlal -3,859.06 6,425.21 -0.287(2:10%) Non Kedsau -2,672.64 3,602.00 -0.374 (> 10%) Non Parrot fish Kemedukl -8,917.21 12,523.60 -0.616 ( 5%) High
Ngyaoch -523.22 1,777.50 -0.102(2210%) Non Rabbit fish Kelsebuul 262.36 147.37 0.253(2:10%) Non
Meyas 2,166.57 -2,124.99 0.601 ( 5%) High Grouper Temekai -2,492.90 4,367.27 -0.319(2:10%) Non Unicorn fish Um -1,564.26 4,754.46 -0.128(2:10%) Non
Pelagic King Mackerel Ngelngal 586.62 -652.93 0.574 ( 10%) Low fish Bonito Katsuo -408.33 2,915.46 -0.093(2:10%) Non Inverte Mangrove crab Emang -2.38 129.67 -0.005(22 10%) Non brates Lobster Lobster 13.15 1.19 0.120(210%) Non
'Correlation coefficient (Significance level)
Mem. Kagoshima Univ. Res. Center S. Pac, Vol. 8, No. 2, 1987
UNIT : METRIC TONS
35.88 38.88 25. B8 28,88 15. 18, 5. TOTAL BY GEAR
A
/till * AAa pHififl
MA ill 111
wMmk I
BSBI OTHER BOATSIND.FISHERMEN
GRANT VESSELS
JFMAMJJASONDJPMAMJJAS
MONTH
Fig. 9. PFFA's fish landings in weight: 1985-1986
223
based on regression models. Fish landings by grant vessels have a decreasing
trend whereas landings by individual fishmen and other boats have increasing
trends. The total fish landings are increasing. 5. Characteristics of Total Fish Trade
As the economy expands, amounts of both imports and exports increase.
This is true in the case of Palau. At the same time, it is widely recognized
that the import of commodities in Palau is high when compared to export (LlTJENS,
1986). However, the difference is much smaller in the case of fish trade. In
1984, the total imports amounted to $22,237,000, based on FOB-value. Fish imports
to the fish exports of $ 147,000 or 31.7 % of the exports (Office of Planning and
Statistics, 1985).
a. Fish imports
Fish are imported in the form of frozen or canned goods. Between 1975
and 1984, 225 MT of frozen and 9I3.4MT of canned fish were imported. Although
annual fluctuations are observed, no upward or downward trend is recognized
in the import (Office of Planning and Statistics, 1985). On the average, 22.5 MT
of frozen fish and 91.3 MT of canned goods were imported annually. This relative
share of fish in the total imports has been declining.
b. Fish exports
Palau's fresh and frozen fish exports were valued at $ 147,000 in 1984. Exports
of unfinished trochus shells raised another $ 173,000 in foreign exchange, or 37.3 %
of total exports. Taken together, these two commodities accounted for 69 % of
the nation's 1984 export package. While the percentage appears high, the value
is still low in absolute terms (Office of Planning and Statistics, 1985).
In 1985, the PFFA alone exported fresh and frozen fish of 75,369 kg. and
received $ 190,465.70. Destinations were Guam (42,888 kg. or $80,367.50), Saipan
(13,994 kg. or $26,224.20), Hawaii (17,948 kg. or $79,138,00.), and Japan (537 kg.
or $4,736.00). Monthly exports ranged from 2,376 kg. in June to 10,847 kg. in
November. Exports to Japan were only in December. Export to Hawaii were
limited to May and July through December.
In previous years, export earnings from fish were far higher, especially during
the 1964-1981 period, when the Van Camp Seafood Company was actively
transhipping tuna from its Malakal facility. By the end of 1981, shortly before
closing it's operation, the Van Camp Seafood Company exported over 10,000 tons of tuna annually, representing a value of $ 3 million (Goverment of the Republic
of Palau, 1986). 6. Discussion
Over the last decade, fisheries activities in the Republic of Palau began to
move from subsistence to commercial fishing (TAUFIQ et al, 1987). However,
the commercial fish landings in 1985 is regarded as only 20 % of subsistence
catch.
In 1974, to promote commercial fisheries, the PFFA was established as a
Palau Goverment chartered non-profit corporation under the jurisdiction of the
Palau Fishing Authroity (PFA), a quasi-government agency. In 1983, however,
the PFFA was taken over by the national goverment due to mismanagement and
in currently managed by the PFA. These entities oversee the operation of a
Mem. Kagoshima Univ. Res. Center S. Pac, Vol. 8, No. 2, 1987 225
production capacity of 16 tons per day.
Commercial fishing has also been greatly promoted by a recent (1983) grant
from the Japan International Cooperation Agency (JICA). This grant consisted
of eleven 35-foot fiberglass fishing boats, with 70 HP Yanmar engines and ice
plants. These boats and plants were assigned to the villages of Angaur, Peliliu,
Aimeliik, Ngeremlengui, Ngardmau, Kayangel, Melekeok, Nghesar, and Koror
(PERRON et al., 1983). These boats are both to catch fish and transport them
to the PFFA market (the only central fish market in Palau). The added capability
of producing ice in the villages reduced the frequency of trips to market and therefore increased the profit margin obtained by village fishermen. Unfortunetely,
all of the flake ice machines are now out of order.
With this in mind, let's us again look at the annual and monthly fluctuations, preferences, quantity-price relationships, trends in fishery, and trade aspects.
With seasonal as well as annual fluctuations, a growing trend in commercial
fisheries in Palau is not deniable. Although commercially important species in
this study are restricted to 15 species, other species are also important because
their prices are comparable to commercially important species. The reason for
not counting them is due to the low landing volume.
Domination of reef fish at the PFFA's market manifests the marine resource
potential and fishing methods used by Palauan. The most popular fishing methods
in Palau are stationary barrier nets, gillnets, trollinglines, droplines, spearguns,
and illegal dynamite fishing in some cases.
Based on the average prices, there are some differences among species. According
to the promotion policy, the PFFA set fish prices monthly, emphasizing deep sea/offshore species and exportable species fishing. Nevertheless, there was no relationship between quantity and price in most cases. The PFFA's pricing policy
has a limited success in terms of price stability and incentive in some cases such
as metengui and meyas. The problem of the fixed-price policy is that the quality
of the fish is neglected. The same fish receives the same price with no regard
to size, freshness, and damage.
The growing trend of total fish landings is due mainly to increasing landings
by individual fishermen and other contract boats, not by grant vessels. Out of
11 grant vessels, one was not used in 1985. And the role of grant vessels in
transportation has been increasing as out-board engines become popular. As a
result, landings by grant vessels have been decreasing.
Traditional trochus fishing is a seasonally significant source of revenue for
many local fishermen. Average annual catches range from I00MT to 300MT,
with a dockside value of $60,000 to $ 180,000. Although unfinished trochus shells
are currently exported to Japan, foreign exchange will drastically improve if the finished products are exported.
are well sorted and graded. The Micronesian Mariculture Demonstration Center
(MMDC) exported giant clam and trochus seeds to other Pacific islands and received
considerable revenues, but all these revenues were directed to the general fund
despite a pressing need for upgrading of the physical plant and program support
(Government of the Repepublic of Palau, 1986).
In the private sector, potentially valuable shorebased structures such as the Van Camp facilities, the Katsuobushi (smoking) plant, and several cold storage facilities are presently underutilized. Among imports, canned goods are very popular because these are convenient and not perishable. Their tastes have been customarily accepted. Therefore, the reduction of these imports is difficult.
7. Conclusion
Except for industrial fisheries, a growing trend in commercial fisheries in Palau
has been studied. Although they are growing, there are many problems as well
as potential. The problems include follow-up of JICA's assistance, the PFFA's
mismanagement potential and commercial fisheries including the fixed-price policy,
fish handlings and grant vessel management.
Potential do certainly exists not only in improving these problems, but also
in development of trochus shell factories, removal of institutional constraints for
the MMDC, and the utilization of potentially valuable shorebased structures such as the Van Camp facilities.
Acknowledgements
This work is based on the Kagoshima University Research Center for the South Pacific's Fifth Scientific Survey of the South Pacific in 1986, supported
by the special research grant of the Japanese Ministry of Education, Science and Culture.
The authors wishes to ackowledge Messrs. Toshiro G. PAULIS, Michael E.
MOLINA, Paulus J. M. LlTJENS of the Government of Palau; Paul J. SARDINA
at the Palau Fishing Authority ; and Francis M. DERMODY at the Palau Federation of Fishing Association for their kind cooperation in data collection.
References
Division of Marine Resources 1985. Palau Fishing Authority: Fish Purchases by Taxonomic Group April-December 1983 and 1984. 16-18, Division of Marine
Recources, Koror, Palau.
Mem. Kagoshima Univ. Res. Center S. Pac, Vol. 8, No. 2, 1987 227
by Month and by Purchaser. 162 pp., Division of Marine Resources, Koror,
Palau.
Office of Planning and Statistics 1985. Abstract of Statistics 1984. 63 pp., Office
of Planning and Statistics, Koror, Palau.
Government of the Republic of Palau 1986. First Five Year Development Plan
1987-1991 (final draft). 339 pp., Office of Planning and Statistics, Koror, Palau.
JOHANNES, R. E. 1981. Words of the Lagoon: Fishing and Marine Lore in the Palau District of Micronesia. 245 pp., University of California Press, Berkeley. LlTJENS, P. J. M. 1986. Commercial and Government Import of Commodities in Palau in 1983 and 1984: A Short Analysis. 38 pp., Office of Planning and
Statistics, Koror, Palau.
PERRON F. E., NAURO A.M. and PATR1S, S.J. 1983. The Palau Reef Fish Production Study. 55 pp., Division of Marine Resources, Koror, Palau. TAUFIQ, M., PATRIS, T. G., SARDINA, P. J., MATSUDA, Y., KUSAKAWA, T. and
NOMA, T. 1987. The structure of fisheries and commercial fish landings in
the Republic of Palau. In : The Prompt Report of the Fifth Scientific Survey
of the South Pacific (Ed. NAKANO, K. et al), 83-86, Kagoshima University.
Research Center for the South Pacific, Kagoshima.