JAIST Repository: オンライン科学論文からのトレンド発見
95
0
0
全文
(2) Emerging Trend Detection from Scientific Online Documents. by. Le Minh Hoang. submitted to Japan Advanced Institute of Science and Technology in partial fulfillment of the requirements for the degree of Doctor of Philosophy. Supervisor: Professor Yoshiteru Nakamori. School of Knowledge Science Japan Advanced Institute of Science and Technology. March 2006.
(3)
(4) Acknowledgements First of all, I would like to express my deep gratitude to Professor Yoshiteru Nakamori for his supervision. I am very happy to have a supervisor who always has great ideas, one of which helped me to open my research direction. Without his knowledge, perceptivity, I would never have finished. He always gives me his helpful encouragements at the right time and I learnt many things from him. I greatly appreciate the way he kindly treats his students. I would like to thank Professor Ho Tu Bao for his great, continuous help during three years I have been in JAIST. He taught me a lot of experience on doing research. He was always willing to help me to solve difficult things. I also admire the way he guide his students. I am thankful to my examiners, Professor Hiroshi Motoda, Professor Kenji Satou and Professor Takashi Hashimoto, for reading the whole dissertation and giving me a lot of useful comments to improve my work. I would like to say a big ‘thank-you’ to the Japanese Government Scholarship (Monbukagakusho) for supporting me to have a good chance to study in Japan, where I can obtain a lot of knowledge in the professionally-working environment. I thank to all students and colleagues in JAIST for being the surrogate family during the many years and for their supports in difficult periods. I would like to express my greatest thanks to my parents, who have spent whole life for my future. My father, who is too old for working, but still has to do anything for my family. He always encourages and reminds me of trying the best in study and research. I am indebted to my mother for her boundless affection. Mom, you are an. 1.
(5) eternal flame in my heart and I hope you are happy in the heaven to see anything I have done as you expected. I thank to my sister, who takes care of my parents when I have been absent from home. Nothing can compensate for her dolorous caused by the loss of our mother, but I hope she can overcome obstacles and difficulties to continue doing the best for her life with much success and happiness. Finally but very important, I want to thank my wife for her love. She always makes me happy and optimistic in the life. She has made so many sacrifices for me that I can say this research could not be done without her encouragements. JAIST, January 31 st , 2006. Le Minh Hoang.
(6) Abstract The rapid increase in volume of scientific literature has led to researchers overload in their pursuit of knowledge. Staying up-to-date with recently published literature - and actually finding relevant sources - is becoming increasingly difficult, time-consuming, and impossible. Experience varies widely, but the time when every essential journal was held in all major academic libraries has passed. Emerging trend detection is a new challenge and an attractive topic in text mining. With the continued increases in performance of computational technologies, more complex implementations of text-processing techniques are become possible, this has spurred research into the development of more sophisticated methodologies for developing emerging trend detection methods. However, there is no model that is particularly constructed for scientific corpora while existing models do not appear to be appropriate for this especially important kind of text databases. Previous work lack of an appropriate represent scheme for research topics and an effective method to identify emerging trends. Building a model for emerging trend detection in scientific corpora is our major research objective. To this end, we have made the following contributions: 1. A model for emerging trend detection in scientific corpora, which presents various advantages in comparing to existing models. 2. A scheme for topic representation based on the rich information commonly provided in scientific papers, which can adapt to different kinds of scientific corpora and also can be efficiently modified. 3. Methods for topic identification, which are used to extract temporal features from documents. They appear to be more accurate and powerful than others in our experiments..
(7) 4. A topic verification method based on the interest and utility functions. This can be used for classification of emerging trends. 5. A prototype system to evaluate the model, that is used to evaluate if our model can achieve significant results in emerging trend detection..
(8) Contents 1 Introduction. 1. 1.1. The Need for Emerging Trend Detection . . . . . . . . . . . . . . . . .. 1. 1.2. Emerging Trend Detection for Scientific Text . . . . . . . . . . . . . . .. 3. 1.3. Research Objective . . . . . . . . . . . . . . . . . . . . . . . . . . . . .. 4. 1.4. Contributions of This Work . . . . . . . . . . . . . . . . . . . . . . . .. 4. 1.5. Structure of Dissertation . . . . . . . . . . . . . . . . . . . . . . . . . .. 5. 2 Current Models and Methods for Emerging Trend Detection. 7. 2.1. Pioneering Work: The TDT Project . . . . . . . . . . . . . . . . . . . .. 8. 2.2. Semi-Automatic Methods. . . . . . . . . . . . . . . . . . . . . . . . . .. 9. 2.2.1. Technology Opportunities Analysis (TOA) . . . . . . . . . . . .. 9. 2.2.2. Constructive, Collaborative Inquiry-Based Multimedia E-Learning (CIMEL) . . . . . . . . . . . . . . . . . . . . . . . . . . . . . .. 12. Fully-Automatic Methods . . . . . . . . . . . . . . . . . . . . . . . . .. 13. 2.3.1. TimeMines . . . . . . . . . . . . . . . . . . . . . . . . . . . . .. 13. 2.3.2. New Event Detection . . . . . . . . . . . . . . . . . . . . . . . .. 15. 2.3.3. ThemeRiverTM . . . . . . . . . . . . . . . . . . . . . . . . . . .. 18. 2.3.4. PatentMiner . . . . . . . . . . . . . . . . . . . . . . . . . . . . .. 19. 2.3.5. Hierarchical Distributed Dynamic Indexing . . . . . . . . . . . .. 21. 2.4. Other Related Works . . . . . . . . . . . . . . . . . . . . . . . . . . . .. 23. 2.5. Summary . . . . . . . . . . . . . . . . . . . . . . . . . . . . . . . . . .. 25. 2.3. i.
(9) 3 An ETD model for Scientific Corpora and Topic Representation. 27. 3.1. The Model Structure . . . . . . . . . . . . . . . . . . . . . . . . . . . .. 27. 3.2. Building the Topic Hierarchy . . . . . . . . . . . . . . . . . . . . . . . .. 29. 3.3. Topic Representation . . . . . . . . . . . . . . . . . . . . . . . . . . . .. 30. 3.4. Summary . . . . . . . . . . . . . . . . . . . . . . . . . . . . . . . . . .. 33. 4 Topic Identification 4.1. 35. Topic Detection . . . . . . . . . . . . . . . . . . . . . . . . . . . . . . .. 35. 4.1.1. Word Frequency and Word Significance . . . . . . . . . . . . . .. 36. 4.1.2. Topic Counting . . . . . . . . . . . . . . . . . . . . . . . . . . .. 39. 4.1.3. Topic Selection . . . . . . . . . . . . . . . . . . . . . . . . . . .. 39. 4.1.4. Generalization . . . . . . . . . . . . . . . . . . . . . . . . . . . .. 40. 4.1.5. Evaluation . . . . . . . . . . . . . . . . . . . . . . . . . . . . . .. 41. 4.1.6. Computing the Weight of Mentioning a Topic in a Given Year .. 42. Citation Type Detection . . . . . . . . . . . . . . . . . . . . . . . . . .. 42. 4.2.1. Definition of Citation Types . . . . . . . . . . . . . . . . . . . .. 43. 4.2.2. Hidden Markov Models . . . . . . . . . . . . . . . . . . . . . . .. 44. 4.2.3. Maximum-Entropy Markov Model . . . . . . . . . . . . . . . . .. 50. 4.2.4. Citation Type Detection Using Finite-State Machines . . . . . .. 51. 4.2.5. Experiments . . . . . . . . . . . . . . . . . . . . . . . . . . . . .. 55. 4.3. Computing the Influence . . . . . . . . . . . . . . . . . . . . . . . . . .. 57. 4.4. Summary . . . . . . . . . . . . . . . . . . . . . . . . . . . . . . . . . .. 58. 4.2. 5 Topic Verification and a Prototype System 5.1. 5.2. 60. Topic Verification . . . . . . . . . . . . . . . . . . . . . . . . . . . . . .. 60. 5.1.1. The Measure of Growth in Interest . . . . . . . . . . . . . . . .. 60. 5.1.2. The Measure of Growth in Utility . . . . . . . . . . . . . . . . .. 61. 5.1.3. Formulation of Interest and Utility Measures . . . . . . . . . . .. 62. 5.1.4. Classification of Emerging Trends . . . . . . . . . . . . . . . . .. 64. Implementing a Prototype System . . . . . . . . . . . . . . . . . . . . .. 66. ii.
(10) 5.2.1. The Scientific Corpus . . . . . . . . . . . . . . . . . . . . . . . .. 66. 5.2.2. Pre-Processing . . . . . . . . . . . . . . . . . . . . . . . . . . .. 68. 5.2.3. Experiments . . . . . . . . . . . . . . . . . . . . . . . . . . . . .. 68. 6 Conclusions. 73. 6.1. Summary and Contributions of the Thesis . . . . . . . . . . . . . . . .. 73. 6.2. Future Works . . . . . . . . . . . . . . . . . . . . . . . . . . . . . . . .. 74. iii.
(11) List of Figures 2.1. Using an artificial neural network to detect emerging trends . . . . . .. 24. 3.1. An ETD model for scientific corpora . . . . . . . . . . . . . . . . . . .. 28. 3.2. Building the topic hierarchy . . . . . . . . . . . . . . . . . . . . . . . .. 31. 3.3. The tendencies of parameters associated with the topic “Neural networks”. 33. 4.1. The topic hierarchy. . . . . . . . . . . . . . . . . . . . . . . . . . . . . .. 39. 4.2. Computing the probability of an observation sequence . . . . . . . . . .. 46. 4.3. The Viterbi algorithm . . . . . . . . . . . . . . . . . . . . . . . . . . .. 48. 4.4. An outline of the Viterbi training algorithm . . . . . . . . . . . . . . .. 49. 4.5. An outline of the training algorithm of a maximum-entropy Markov model 51. 5.1. User-interface of the prototype system . . . . . . . . . . . . . . . . . .. iv. 65.
(12) List of Tables 1.1. Emergence of XML in the mid-1990s. . . . . . . . . . . . . . . . . . . .. 2. 2.1. Story/event pairs in TDT datasets . . . . . . . . . . . . . . . . . . . .. 9. 2.2. Co-occurrences with “multichip modules” . . . . . . . . . . . . . . . . .. 11. 2.3. Representation of a topic in CIMEL . . . . . . . . . . . . . . . . . . . .. 13. 2.4. Representation of a topic in New Event Detection . . . . . . . . . . . .. 16. 2.5. Representation of a topic in PatentMiner . . . . . . . . . . . . . . . . .. 20. 2.6. Representation of a topic in HDDITM. . . . . . . . . . . . . . . . . . .. 22. 3.1. Parameters associated with the topic “neural networks”. . . . . . . . .. 32. 4.1. The accuracies of Nanba and Okumura’s method, HMMs, and MEMMs. 56. 4.2. The accuracies of two methods using HMMs and MEMMs . . . . . . .. 57. 5.1. Evaluating the level of growths in interest and utility . . . . . . . . . .. 70. 5.2. Evaluating the level of growths in interest and utility without citation information . . . . . . . . . . . . . . . . . . . . . . . . . . . . . . . . .. v. 72.
(13) Chapter 1 Introduction 1.1. The Need for Emerging Trend Detection. The explosive growth of digital repositories of information has been enabled by recent developments in communication and information technologies [PY01]. In this fast changing information age, knowledge of emerging trends in the a particular area of interest is very important for people who want to stay up-to-date with recently published literature, such as research scholars, movie or film producers, fashion designer and follower, etc. For example, a market analyst might want to review technical and news-related literature for recent trends that will impact the companies he is tracking; people who are looking for their research topic have to read many papers in their research domain for reviewing related works, finding relevant sources, advanced techniques supporting for their researches. What is an Emerging Trend? An emerging trend is a topic area that is growing in interest and utility over time [KGP+ 03]. For example, Extensible Markup Language (XML) emerged as a trend in the mid 1990s. Table 1.1 shows the results of an INSPECr database search on the keyword “XML” from 1994 to 1999 in which we can see the trend of XML from 1994 to 1997; by 1998 it was well represented as a topic area. Emerging Trend Detection (ETD) is the process of finding emerging trends in a specific domain in order to provide an automated alert when new developments are 1.
(14) Year 1994 1995 1996 1997 1998 1999. Number of documents 3 1 8 10 170 371. Table 1.1: Emergence of XML in the mid-1990s. happening in an area of interest and utility. It is assumed that a detected trend is an indication that some event has occurred. To detect emerging trends, we have to look at the data to determine the underlying development. Whether the development is important or not is a decision that depends on the situation and the particular information needs of the person evaluating the data. The need to become aware of new developments in science, technology, or business is critical to researchers, decision makers at all levels of a corporation. These people need to stay up-to-date with current development in their daily work. They need data that is complete and available in a timely manner. Traditionally, people have learned about a majority of the new developments by reading various types of text documents or by getting the information from others who have read the documents. As the pace of new developments accelerates and the number of documents increases exponentially, it will no longer be possible for an individual to keep up with what is happening by using manual processes. There is a clear need for new tools and methodologies to bring some level of automation to detect trends and new developments. With the continued increases in performance of computational technologies, more complex implementations of text-processing techniques have become possible, this has spurred research into the development of more sophisticated methodologies for the detection of emerging trends.. 2.
(15) 1.2. Emerging Trend Detection for Scientific Text. One very significant task for ETD is to find emerging research trends in a collection of scientific articles. Imagine that we are researchers, looking for topics that have recently attracted much interest and utility in a particular domain. A manual review of all available articles in this domain would be very time-consuming and virtually impossible. In this situation, the automatic detection of emerging research trends can help researchers quickly understand the occurrence and the tendency of a scientific topic, and thus they can, for example, find the most recent, related topics in their research domain. As a new and challenging problem in text mining, several ETD methods have been developed which takes as input a collection of textual data and identifies topic areas that are either novel or are growing in interest and utility within the corpus. Most of existing researches on ETD work around three main tasks: topic representation, topic identification, and topic verification. Each topic – the ETD central notion – is usually represented by a set of temporal features in the phase of topic representation. These features are then extracted from document databases using text-processing methods in the topic identification phase. After that, the topic verification phase plays the role of monitoring these features over time and classifying the topic by using interest and utility functions [KGP+ 03]. While many ETD models have been proposed, they are still poor in representing research topics [SA00, APL98] and inappropriate for determining and ranking interest and utility [Gev02, HHWN02]. There are two main reasons why these ETD models do not appear to be robust when applied to scientific corpora. First, many features can be extracted from scientific articles but may not be available in other textual data, meaning that these features cannot be integrated into general ETD models. The second limitation lay on the interpretation of interest and utility measures for evaluating research topics. This process is somewhat subjective and requires complex computations in analyzing the features associated with each topic.. 3.
(16) 1.3. Research Objective. The main objective of our work is to build an ETD model for scientific corpora. To this end, we aim to build an appropriate model structure and construct the following model components: Topic representation: The first goal is to find a rich representation scheme for topics, that is reasonable, explainable and appropriate to distinguish emerging and nonemerging trends. Topic identification: The second goal is to identify topics by features extracted from documents. We aim to develop effective methods for automatically extracting features that do not require user-interactions or explicit knowledge. Topic identification: The third goal is to formulate two interest and utility measures. Due to the difficulty of the topic verification task, existing work on emerging trend detection usually detect topic areas that have grown in size and variety at an increasing rate over time. We want to evaluate the growth of a topic in interest and utility separately in order to make the topic verification method more reasonable in classification of emerging trends.. 1.4. Contributions of This Work. In context of scientific emerging trend detection, our work is valuable in that it proposed a more appropriate ETD model and developed effective methods for each model components. The contributions of this work include: 1. A model for emerging trend detection in scientific corpora, which presents various advantages in comparing to existing models. 2. A scheme for topic representation based on the rich information commonly provided in scientific papers, which can adapt to different kinds of scientific corpora 4.
(17) and also can be efficiently modified. Features used for representing topics include topic name, citation information, influence, author reputations, weight of sources. These human-understandable features are extracted from documents and will be used for distinguishing emerging and non-emerging trends as well as providing evidences that indicate whether a topic is truly emerging. 3. Methods for topic identification, which are used to extract temporal features from documents. They appear to be more accurate and powerful than others in our experiments. Our method to detect topics of each document based on concept hierarchy is more accurate that other methods for scientific documents. We have also proposed a method to detect reasons for citations using finite-state machines, which has an appropriate definition of citation types and does not require user-interactions or explicit knowledge. 4. A topic verification method based on the interest and utility functions. We formulated two interest and utility measures for evaluating emerging trends, that enable us to make the topic verification method more reasonable in classification of emerging trends. 5. A prototype system to evaluate the model with some data sets, that is used to evaluate if our model can achieve significant results in emerging trend detection.. 1.5. Structure of Dissertation. This dissertation is organized into six chapters: Chapter 1 Overview and introduction to the need and importance of emerging trend detection in scientific online documents. Chapter 2 The state of the art of emerging trend detection researches. Some emerging trend 5.
(18) detection methods are studied. Techniques required for emerging trend detection are presented. We summarize how other works represent topics, extract features and verify topics. Further, we discuss the advantages and limitations of each method. Chapter 3 This chapter focuses on the structure of an emerging trend detection model for scientific corpora, including the representation of topics using temporal features Chapter 4 Methods for the topic identification task, which are used for extracting temporal features associated with topics, are explained. With details and supportive experimental results, topic detection and citation type detection algorithms will be introduced, followed by the comparison with other works. Chapter 5 This chapter focuses on building the interest and utility measures, which are key components of the topic verification task. An overview of the prototype system to test the model, and some experimental results are also discussed. Chapter 6 Conclusions, importance and significance of this work, future works are presented.. 6.
(19) Chapter 2 Current Models and Methods for Emerging Trend Detection In this chapter, we provide an overview of the status of emerging trend detection research. Although many emerging trend detection models have been proposed, the common components of an ETD model have not, to date, been clearly defined. Most of the related works developed ETD methods that take as input a collection of textual data and identify topic areas that are either novel or are growing in interest and utility within the corpus. Each topic – the ETD central notion – is usually represented by a set of temporal features extracted from document databases using text-processing methods. After that, these features are monitored over time, and emerging trends are detected [KGP+ 03]. The effectiveness of an ETD model completely depends on how appropriately a topic is represented in computers, how well the features associated with a topic are extracted from the documents and how reasonably the method for verifying topics are constructed. Therefore, the approaches taken in these various tasks can be summarized in the three main tasks: Topic representation, Topic identification and Topic verification. Current ETD methods fall generally into two categories: fully-automatic and semiautomatic. The fully-automatic methods take in a corpus and develop a list of emerging topics. A human reviewer then peruses these topics and the supporting evidence found 7.
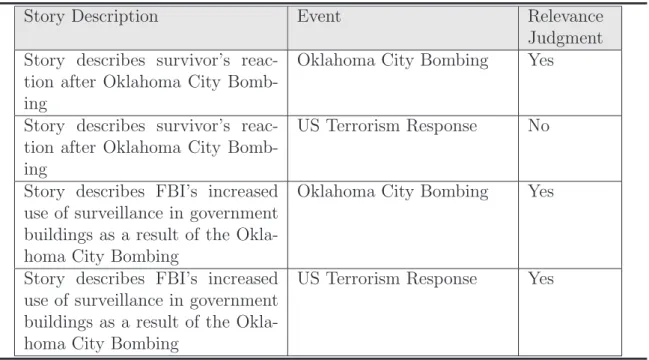
(20) by the method to determine which are truly emerging trends. These methods often include a visual component that allows the user to track the topic in an intuitive manner [DHJ+ 98], [SA00]. Semi-automatic methods [PD95], [RGP02] require user to input a topic and provide the user with evidence that indicates whether the input topic is truly emerging, usually in the form of reports and screens that summarize the evidence available on the topic. In the following sections, we will briefly describe some semi-automatic and fullyautomatic methods. For each ETD method, we will clarify how the work represent topics, extract feature and verify topics in order to compare with our ETD model which is described in further chapters.. 2.1. Pioneering Work: The TDT Project. TDT research began in 1997, that develops algorithms for discovering and threading together topically related material in streams of data, such as newswire and broadcast news, in both English and Mandarin Chinese. Although the TDT project did not directly focus on emerging trend detection, it provided a data repository for many ETD researches. The TDT data sets are sets of news stories and event descriptors. Each story/event pair is assigned a relevance judgment. A relevance judgment is an indicator of the relevance of the given story to an event. Table 2.1 includes several examples of the relevance judgment assignment to a story/event pair. Thus, the TDT data sets can be used as both training and test sets for ETD algorithms. The Linguistic Data Consortium (LDC) [LDC] currently has three TDT corpora available for system development, the TDT Pilot study (TDT-Pilot), the TDT Phase 2 (TDT2), the TDT Phase 3 (TDT3), as well as the TDT3 Arabic supplement. Not all of the ETD methods we describe rely on the TDT data sets. Other approaches for the creation of test data have been used, such as manually assigning relevance judgments to the input data and comparing the system results to the results 8.
(21) Story Description. Event. Story describes survivor’s reaction after Oklahoma City Bombing Story describes survivor’s reaction after Oklahoma City Bombing Story describes FBI’s increased use of surveillance in government buildings as a result of the Oklahoma City Bombing Story describes FBI’s increased use of surveillance in government buildings as a result of the Oklahoma City Bombing. Oklahoma City Bombing. Relevance Judgment Yes. US Terrorism Response. No. Oklahoma City Bombing. Yes. US Terrorism Response. Yes. Table 2.1: Story/event pairs in TDT datasets produced by a human reviewer. This approach is tedious and necessarily limits the size of the data set. Some related works use other databases such as INSPECr [INS], which contains engineering abstracts, or the United States patent database, which allows searching of all published US patents.. 2.2. Semi-Automatic Methods. Semi-automatic methods require user to input a topic and provide the user with evidence that indicates whether the input topic is truly emerging, usually in the form of reports and screens that summarize the evidence available on the topic. Therefore, they focus on each individual topic, not on the complex relations of all topics in a given text database. Semi-automatic methods do not make any decisions on emerging trends, the users have to make decisions based on the evidence provided in the output.. 2.2.1. Technology Opportunities Analysis (TOA). Alan L. Porter and Michael J. Detampel describe a semi-automatic trend detection method for technology opportunities analysis in [PD95]. The first step of the process 9.
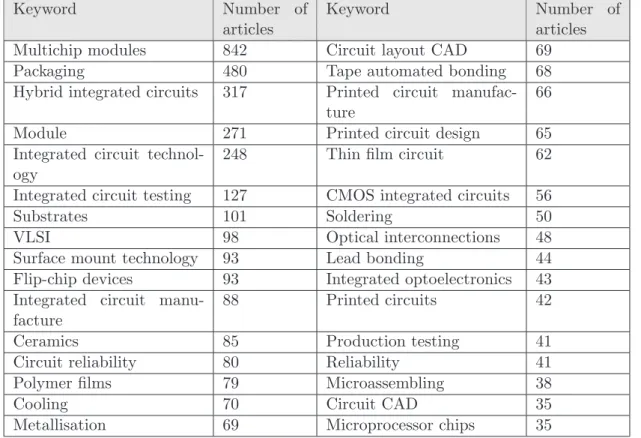
(22) is the extraction of documents (such as INSPECr abstracts) from the knowledge area to be studied. The extraction process requires the development of a list of potential keywords by a domain expert. These keywords are then combined into queries using appropriate Boolean operators to generate comprehensive and accurate searches. The target databases are also identified in this phase (e.g., INSPECr , COMPENDEXr [COM], US Patents [Sit], etc.). The queries are then input to the Technology Opportunities Analysis Knowbot module [PD95] to extract the relevant documents (abstracts) and provides an analysis of the data. Word counts, date information, word co-occurrence information, citation information and publication information are used to track activity in a subject area. TOAK facilitates the analysis of the data available within the documents. For example, it can quickly generate the lists of frequently occurring keywords, the lists of author affiliations, countries, or states. In [PD95], the authors present an example of how TOAK can be used to track trends in the “multichip module” sub field of electronic manufacturing and assembly. Table 2.2 shows a list of keywords that appear frequently with “multichip module” in the INSPECr database. The authors observed that multichip modules and integrated circuits (particularly hybrid integrated circuits) co-occurred very frequently. An additional search using the US Patent database showed that many patents had been issued in the area of multichip modules. Furthermore, the integrated circuits activity was more likely to be US based, while large scale integration activity was more likely to be based in Japan. TOAK is meant to be used by a human expert in an interactive and iterative fashion. The user generates initial queries, reviews the results and is able to revise the searches based on his/her domain knowledge. TOA represents an alternative approach to the time-consuming literature search and review tasks necessary for market analysis, technology planning, strategic planning or research.. 10.
(23) Keyword Multichip modules Packaging Hybrid integrated circuits Module Integrated circuit technology Integrated circuit testing Substrates VLSI Surface mount technology Flip-chip devices Integrated circuit manufacture Ceramics Circuit reliability Polymer films Cooling Metallisation. Number of articles 842 480 317. Keyword. Number of articles 69 68 66. 271 248. Circuit layout CAD Tape automated bonding Printed circuit manufacture Printed circuit design Thin film circuit. 127 101 98 93 93 88. CMOS integrated circuits Soldering Optical interconnections Lead bonding Integrated optoelectronics Printed circuits. 56 50 48 44 43 42. 85 80 79 70 69. Production testing Reliability Microassembling Circuit CAD Microprocessor chips. 41 41 38 35 35. 65 62. Table 2.2: Co-occurrences with “multichip modules” Topic representation TOA uses INSPECr database server as the primary corpus. Each topic is represented by a list of keywords (a single word or multiple words termed n-grams1 ) and their possible combinations using Boolean operators. Each keyword is associated with a number of keyword occurrence and pairwise co-occurrence, which are calculated per year and over all years. Topic identification Because TOA uses a simple representation for topics and the set of keywords is manually generated, the topic identification task is simply a process of counting n-gram occurrence and pairwise co-occurrence over all articles in INSPECr database. 1. An n-gram is a sequence of n words. For example, the phrase ’data mining’ is a bigram (or 2-gram).. 11.
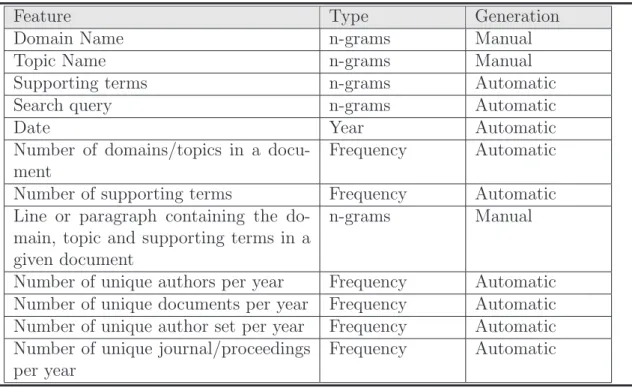
(24) Topic verification TOA does not provide any decision for emerging trends. Instead of making an automatic topic verification module, it uses frequency tables, histograms, weighted ratios, log-log graphs, Fisher-Pry curves, and technology maps to visualize the trend of the input topic, identification of trends is left to users.. 2.2.2. Constructive, Collaborative Inquiry-Based Multimedia E-Learning (CIMEL). CIMEL is a multi-media framework for constructive and collaborative inquiry-based learning. It includes an semi-automatic emerging trend detection method [RGP02] in order to enhance computer science education. With a given input topic, the method identifies the main topic area for research and recent conferences and workshops in this area. After reviewing contents and creating a list of candidate emerging trends, the method verifies each candidate using a database search tool and/or a Web search engine. Topic representation The corpus for this semi-automatic methodology can be any web resource. Each topic is associated with several features as shown in Table 2.3. Topic identification Unlike TOA, CIMEL provides specific parameters for identifying an emerging trend, rather than relying solely on the domain expertise of the user. Most of these features associated with a topic are automatically extracted from the corpus. Like TOA, this method is is restricted by the electronic availability of documentation in a given subject area. Furthermore, the INSPECr query tool is currently based on abstracts that are downloaded to a local database, which must be periodically refreshed.. 12.
(25) Feature Domain Name Topic Name Supporting terms Search query Date Number of domains/topics in a document Number of supporting terms Line or paragraph containing the domain, topic and supporting terms in a given document Number of unique authors per year Number of unique documents per year Number of unique author set per year Number of unique journal/proceedings per year. Type n-grams n-grams n-grams n-grams Year Frequency. Generation Manual Manual Automatic Automatic Automatic Automatic. Frequency n-grams. Automatic Manual. Frequency Frequency Frequency Frequency. Automatic Automatic Automatic Automatic. Table 2.3: Representation of a topic in CIMEL Topic verification Like TOA, the ETD method implemented in CIMEL relies on the user to detect emerging trends. No machine-learning component is employed. Instead CIMEL relies on a precisely defined manual process.. 2.3. Fully-Automatic Methods. Fully-automatic methods do not require user’s topic input, they take in a corpus and develop a list of emerging topics. Therefore, they must consider the complex relations of all topics in a given text database in order to make decisions on emerging trends.. 2.3.1. TimeMines. The ETD method implemented in TimeMines system [SA00] takes free text data, with explicit date tags, and develops an overview time-line of statistically significant topics covered by the corpus. This method employs hypothesis-testing techniques to determine the most relevant topics in a given time-frame. Only the most significant 13.
(26) and important information (as determined by the program) is presented to the user. TimeMines begins processing with a default model that assumes the distribution of a feature depends only on a base rate of occurrence that does not vary with time. Each feature in a document is compared to the default model. A statistical test is used to determine if the feature being tested is significantly different from what the model would expect. If so, the feature is kept for future processing, otherwise it is ignored. The reduced set of features developed using the first round of hypothesis testing is then input into a second processing phase which groups related features together. The grouping again relies on probabilistic techniques that combine terms that tend to appear in the same time-frames into a single topic. Finally, a threshold is used to determine which topics are most important and these are displayed via the time-line interface. The threshold is set manually, and is determined empirically. Like TOA, TimeMines presents a model of the data without drawing any specific conclusions about whether or not a topic is emergent. It simply presents the most statistically significant topics to the user, and relies on the user’s domain knowledge for evaluation of the topics Topic representation In TimeMines, an initial attribute list of all named entities and certain noun phrases is generated. A named entity is defined as a specified person, location, or organization. The documents are thus represented as a bag of attributes, where each attribute is true or false (i.e., whether the named entity or noun phrase is contained in the document or not). TimeMines uses a statistical model based on hypothesis testing to choose the most relevant features. As noted, the system assumes a stationary random model for all features (n-grams and named entities) extracted from documents. The stationary random model assumes that all features are stationary (meaning their distributions do not vary over time) and the random processes generating any pair of features are independent. Features whose actual distribution matches this model are considered to contain no 14.
(27) new information and are discarded. Features that vary greatly from the model are kept for further processing. The hypothesis testing is time dependent, i.e for a specific block of time, a feature either matches the model (at a given threshold) or violates the model. Topic identification In TimeMines, named entities are extracted using the Badger IE system [FSM+ 95] with Noun phrases match the regular expression (N |J) ? N for up to five words, where N is a noun, J is an adjective, | indicates union, and ? indicates zero or more occurrences. Each document has a presence attribute for each named entity and n-gram. A presence is assigned the value ’True’ if the named entity or n-gram occurs in the document, else it is assigned the value ‘False’. Topic verification TimeMines uses an algorithm based on hypothesis testing. Using the reduced feature set, TimeMines checks for features within a given time period that have similar distributions. These features are grouped into a single ‘topic’. Thus each time period may be assigned a small number of topic areas, each represented by a larger number of features. The final determination of whether or not a topic is emerging is left to the user, but unlike CIMEL and TOA, the user need not direct the ETD process. This method is completely automated: given a time-tagged corpus it responds with a graphical representation of the topics that dominate the corpus during specific time periods.. 2.3.2. New Event Detection. New event detection, also referred to as first story detection, is specifically included as a subtask in the TDT initiative. New event detection requires identifying those news stories that discuss an event that has not already been reported in earlier stories.. 15.
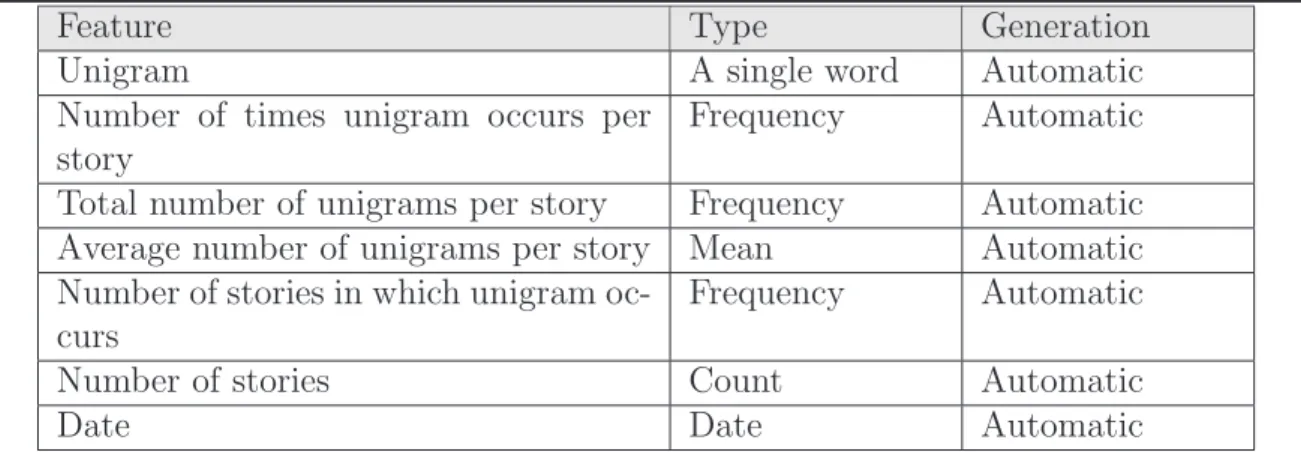
(28) Feature Unigram Number of times unigram occurs per story Total number of unigrams per story Average number of unigrams per story Number of stories in which unigram occurs Number of stories Date. Type A single word Frequency. Generation Automatic Automatic. Frequency Mean Frequency. Automatic Automatic Automatic. Count Date. Automatic Automatic. Table 2.4: Representation of a topic in New Event Detection New event detection operates without a predefined query. Typically algorithms look for keywords in a news story and compare the story with earlier stories. The method taken in [APL98] implies that the input be processed sequentially in date order: i.e., only past stories can be used for evaluation, not the entire corpus. A new event detection algorithm is based on a single pass clustering algorithm. The content of each story is represented as a query. When a new story is processed, all the existing queries (previous stories) are run against it. If the ’match’ exceeds a predefined threshold (discussed below) the new story is assumed to be a continuation of the query story. Otherwise it is marked as a new story. Topic representation All stories in the TDT corpus deemed relevant to twenty five selected ‘events’ were processed. For new event detection, each story (topic) is represented by a set of single words (called unigrams) associated with some features as shown in Table 2.4. Topic identification In [APL98], the n most frequent single words comprise the query, and are weighted and assigned a belief value by the Inquery system [ABC+ 95], indicating the relevance of each word in the story to the query. Belief is calculated using term frequency and inverse document frequency. Term frequency is derived from the count of times the. 16.
(29) word occurs in the story, the length of the story, and the average length of a story in the collection. Inverse document frequency is derived from the count of stories in the collection and the count of stories that contain the word. Topic verification The method of [APL98] is based on a single-pass clustering algorithm that detects new stories by comparing each story processed to all of the previous stories/queries detected. As each incoming story is processed, all previous queries are run against it. If a story does not match any of the existing queries, the story is considered a new event. The system relies on a threshold to match the queries to the incoming stories. The initial threshold for a query is set by evaluating the query with the story from which it originated. If a subsequent story meets or exceeds this initial threshold for the query, the story is considered a match. The threshold is used as input to a function based on the Inquery system described above [ABC+ 95]. Since new event detection implies that documents are processed in order, however, traditional IR metrics that are usually applied to an entire corpus (such as the number of documents containing the term and average document length) are not readily available. To overcome this problem, an auxiliary collection is used to provide this information to the Inquery system to take advantage of the time dependent nature of the news story collection by using a time penalty that increases the value required to ’match’ a story as stories grow further apart in time. Like the TimeMines, the new event detection method described here is completely automated. Given a corpus, it provides a list of new events in the form of news stories that first describe an occurrence of an event. New event detection differs somewhat from ETD in that it is focused on the sudden appearance of an unforeseen event rather than the emergence of a trend.. 17.
(30) 2.3.3. ThemeRiverTM. Similar to TimeMines, ThemeRiverTM [HHWN02] summaries the main topics in a corpus and presents a summary of the importance of each topic via a graphical user interface. The topical changes over time are shown as a “river” of information. The river is made up of multiple streams. Each stream represents a topic and each topic is represented by a color and maintains its place in the river relative to other topics. Topic representation The corpus in the example presented in [HHWN02] consisting of speeches, interviews, articles, and other text about Fidel Castro over a 40-year period. ThemeRiverTM automatically generates a list of possible topics, called theme words, of which a subset is manually chosen as attributes. Counts of the number of documents containing a particular theme word for each time interval provide the input for the method. An alternate count, using the number of occurrences of the theme word for each time interval is suggested but not implemented in this work. Topic identification An automatic method for generating the initial list of theme words was not specified, nor was the procedure for deciding which or how many of the theme words should be included in the subset. Theme word frequencies are computed after these attributes are chosen, effectively making attribute selection a manual process. Topic verification ThemeRiverTM does not provide any algorithm for verifying topics. It only provides a view of the data that an experienced domain expert can use to confirm or refute a hypothesis about the data. ThemeRiverTM begins by converting time-tagged data into time intervals. A set of terms, or themes, that represent the data is chosen and the river is developed based on the strength of each theme in the collection. As noted,. 18.
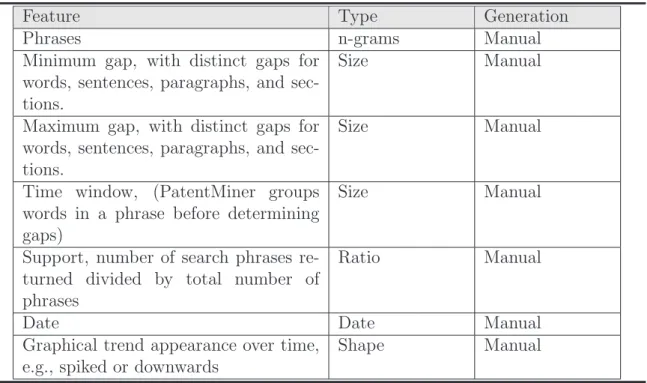
(31) the themes are chosen by automatically developing a list of words that are present in the data and then manually selecting a subset that represent various topics. The number of documents containing the word determines the strength of each theme in each time interval. Other methods of developing the themes and strengths are possible. The visual component of ThemeRiverTM is the most important aspect of this work, particularly as it applies to trend detection.. 2.3.4. PatentMiner. The ETD method implemented in PatentMiner system can discover trends in patent data using a dynamically generated SQL query based upon selection criteria input by the user [LAS97]. This method uses IBM DB2 database which contains all granted US patents as its dataset. There are two major components to the system, phrase identification using sequential pattern mining [SA96] and trend detection using shape queries. Topic representation PatentMiner represents each topics by phrases. A phrase can be any sequence of words, with a minimum and maximum ‘gap’ between any of the words. Gaps can be described in terms of words, sentences, paragraphs, or sections. For example, the minimum sentence gap is one for the phrase “emerging trends” means two phrases “emerging” and “trends” must occur in separate sentences. If the maximum paragraph gap is one, two phrases ’emerging’ and ’trends’ must occur in the same paragraph. Table 2.5 summarizes features associated with a topic in PatentMiner. Topic identification Several procedures prepare the data for the topic identification task. Stop-words are removed. Identifiers are assigned to the remaining words, indicating position in the document and occurrences of sentence, paragraph, and section boundaries. After a. 19.
(32) Feature Phrases Minimum gap, with distinct gaps for words, sentences, paragraphs, and sections. Maximum gap, with distinct gaps for words, sentences, paragraphs, and sections. Time window, (PatentMiner groups words in a phrase before determining gaps) Support, number of search phrases returned divided by total number of phrases Date Graphical trend appearance over time, e.g., spiked or downwards. Type n-grams Size. Generation Manual Manual. Size. Manual. Size. Manual. Ratio. Manual. Date Shape. Manual Manual. Table 2.5: Representation of a topic in PatentMiner subset of patents is specified by category and date range, the Generalized Sequential Patterns (GSP) algorithm [LAS97] selects phrases. Only phrases with support greater than a user-defined minimum are considered. The number of phrases selected can be substantial, given their very open-ended nature. A sub-phrase of a phrase may be ignored if the support of the two phrases is similar. Or, a sub-phrase (general, higher-level) might be preferred over a longer phrase (specific, lower-level) initially, after which specific lower-level phrases could be easier to identify. The topic identification method in PatentMiner takes a different approach compared to other methods which use traditional IR techniques to extract features from the text corpus. It adapts a sequential pattern matching technique that is frequently used in data mining systems. The pattern matching system looks for frequently occurring patterns of words. The words may be adjacent, or separated by a variable number of other words (up to some maximum that is set by the user). This technique allows the system to identify frequently co-occurring terms and treat them as a single topic. Documents in the input data set are binned into various collections based on their 20.
(33) date information. The above technique is used to extract phrases from each bin and the frequency of occurrence of each phrase in all bins is calculated. A shape query is used to determine which phrases to extract, based on the user’s inquiry. The shape query processing is another learning tool borrowed from data mining. In the PatentMiner system, the phrase frequency counts represent a data store that can be mined using the shape query tool. The shape query has the ability to match upward and downward slopes based on frequency counts. The shape query allows the user to graphically define various shapes for trend detection (or other applications) and retrieves the phrases with frequency distributions that match the query. Topic verification The presentation of PatentMiner lacks topic verification component. While it automatically generates and displays potential trends, no claim is made as to the validity of these trends. The visualization is intuitive, but no user study on its effectiveness is reported in [LAS97]. In addition, no metrics are employed to verify that the trends discovered are correctly identified.. 2.3.5. Hierarchical Distributed Dynamic Indexing. The Hierarchical Distributed Dynamic Indexing (HDDITM ) system supports core text processing including information/feature extraction, feature subset selection, unsupervised and supervised text mining and machine learning as well as evaluation for many applications, including an emerging trend detection method. In [PY01], the authors describe an approach to the detection of emerging trends in text collections based on semantically determined clusters of terms. The HDDITM system is used to extract linguistic features from a repository of textual data and to generate clusters based on the semantic similarity of these features. The algorithm takes a snapshot of the statistical state of a collection at multiple points in time. The rate of change in the size of the clusters and in the frequency and association of features. 21.
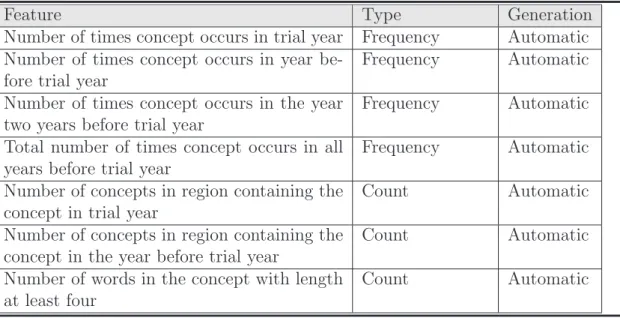
(34) Feature Number of times concept occurs in trial year Number of times concept occurs in year before trial year Number of times concept occurs in the year two years before trial year Total number of times concept occurs in all years before trial year Number of concepts in region containing the concept in trial year Number of concepts in region containing the concept in the year before trial year Number of words in the concept with length at least four. Type Frequency Frequency. Generation Automatic Automatic. Frequency. Automatic. Frequency. Automatic. Count. Automatic. Count. Automatic. Count. Automatic. Table 2.6: Representation of a topic in HDDITM is used as input to a neural network that classifies topics as emerging or non-emerging. Topic representation In HDDITM , a topic is represented by a region of semantic locality which is a group of concepts created using sLoc [BP00]. Each topic is associated with seven features as shown in Table 2.6 Topic identification Initially, topic identification method in HDDITM requires parsing and tagging before extraction. The parser retains only relevant sections of the original documents. The tagger maps a part-of-speech label to each word using lexical and contextual rules [Bri92]. A finite-state machine extracts complex noun phrases (concepts) according to the regular expression:. C? (G|P |J) ∗ N + (I ∗ D?C? (G|P |J) ∗ N +) ∗. (2.1). where C is a cardinal number, G is verb (gerund or present participle), P is a verb (past participle), J is an adjective, N is a noun, I is a preposition, D is a determiner, ?. 22.
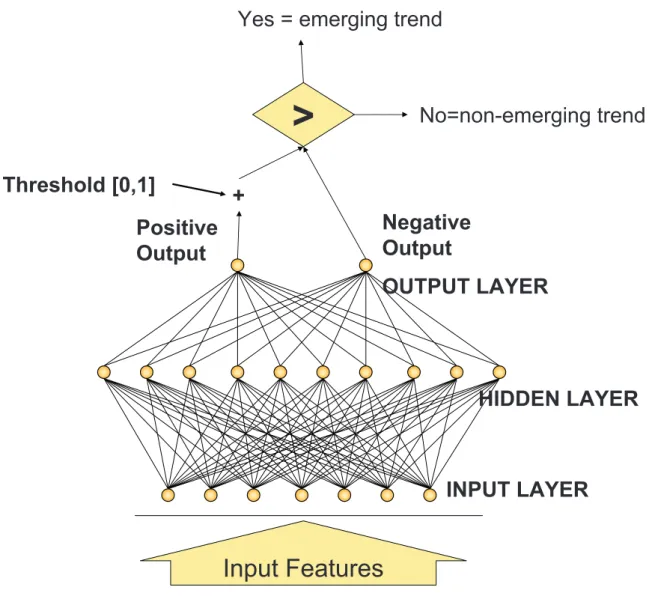
(35) indicates zero or one occurrence, | indicates union, ∗ indicates zero or more occurrences, and + indicates one or more occurrence. Counts of each concept and counts of cooccurrence of concept pairs are recorded at this point. An asymmetric similarity between concept pairs is calculated based on a cluster weight function described in [CL92]. The concepts are then grouped into regions of semantic locality using sLoc, an algorithm described in [BP00]. The maximum, mean and standard deviation of the similarity, along with a parameter α that is a multiplication factor of standard deviations, determine the threshold r used in the first step of the sLoc algorithm. Cluster size is used in the last step, as α decreases, r increases and the number of connections between pairs of concepts decreases, resulting in smaller but more focused semantic regions. Topic verification The emerging trend detection method in HDDITM assumes that an emerging concept have to satisfy two principles: it should grow semantically richer over time and it should occur more often as more items reference it. Using a cluster-based rather than an itembased approach, an artificial neural network model takes seven features and one tuning threshold parameter to classify a concept as emerging or not. The structure of the artificial neural network and the topic verification process were shown in the Figure 2.1.. 2.4. Other Related Works. Feldman and Dagan [FD95] proposed a technique for development of a hierarchical data structure from text databases. This data structure then facilitates the study of concept distributions in text. The authors propose comparing the concept distributions from adjacent time periods. This approach to trend analysis seems promising; however, we were not able to obtain a more detailed description of the approach, or the experimental results, so we are unable to present a more comprehensive summary. The authors 23.
(36) Yes = emerging trend. > Threshold [0,1]. No=non-emerging trend. + Negative Output. Positive Output. OUTPUT LAYER. HIDDEN LAYER. INPUT LAYER. Input Features Figure 2.1: Using an artificial neural network to detect emerging trends. 24.
(37) has also been active in the development of commercial products for emerging trend detection. We have focused on research efforts that identify trends based primarily on the use of words and phrases; however, several research groups are using a different approach. The works in [CC99], [PFL+ 00] and [Ley02] present algorithms that primarily employ citation information for trend detection. Several ETD methods focus more on the visualization of textual data and can be adapted to trend detection at the discretion of the user. For examples, Envision [NFH+ 96], allows users to explore trends graphically in digital library metadata (including publication dates) to identify emerging concepts. It is basically a multimedia digital library of computer science literature, with full-text searching and full-content retrieval capabilities. The system employs the use of colors and shapes to convey important characteristics of documents. For example, the interface uses color to show the degree of relevance of a document. Plaisant et al. describe a visual environment called Lifelines for reviewing personal medical histories in [PMS+ 98]. The visualization environment presented in their work exploits the timeline concept to present a summary view of patient data. Lavrenko et al. develop a method named EAnalyst [LSL+ 00] for analyzing two types of data, textual and numeric, both with time stamps. The system predicts trends in numeric data based on the content of textual data preceding the trend. For example, the system predicts the trend in stock prices based on articles published prior to the appearance of the (numeric) trend.. 2.5. Summary. In this chapter, we have described previous work related to topic emerging trend detection. We described how other works represent topics, extract features and verify topics. In both semi-automatic and fully-automatic methods, the effectiveness completely 25.
(38) depends on how appropriately a topic is represented in computers, how well the features associated with a topic are extracted from the documents and how reasonably the method for verifying topics are constructed. Because these tasks is performed on the text in the corpus, it is difficult to find the best model for any kind of textual data. When applying existing methods to scientific corpora, many features of scientific article (such as citation information, influence, author reputation, journal/proceedings) are not represented and extracted. This makes these methods lack of rich representation for topic and good interpretation for the interest and utility measures. How to build an appropriate ETD model for scientific corpora is the main challenge for our research. The key idea for solving this problem is representing useful features as much as possible, using automatic text-processing techniques effectively and utilizing available knowledge source such as WordNet [Wor]. The technical details will be described in next chapters.. 26.
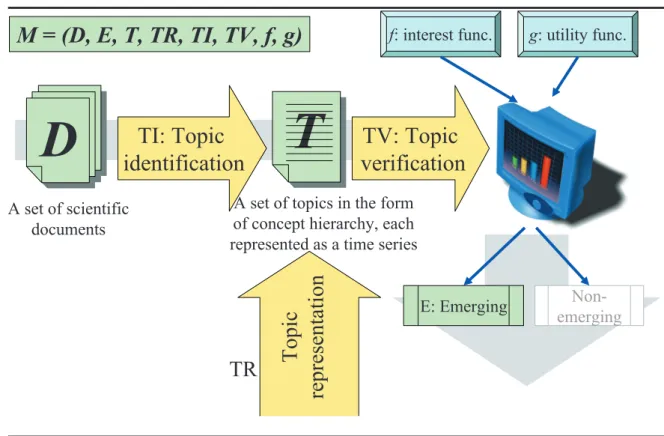
(39) Chapter 3 An ETD model for Scientific Corpora and Topic Representation In this chapter, we present a new model for detecting emerging trends from scientific corpora and its topic representation method. We will discuss details of model components and the reason why we use this representation for topics in the following sections.. 3.1. The Model Structure. Our ETD model is used for developing a fully-automatic emerging trend detection method, which takes a scientific corpus D as the input and produces a set of emerging trends E. The framework can be described as follows: At the beginning of the ETD process, we analyze the input corpus D to extract topics from all documents. After that, these topics are then organized in a concept hierarchy T . Each topic is associated with a time-series of some temporal features defined in the topic representation module (T R) inside the model. These features are extracted from the corpus using text-processing techniques implemented in topic identification module (T I). At the final stage, topics and theirs features is sent to the topic verification (T V ) module to identify emerging trends using two interest and 27.
(40) M = (D, E, T, TR, TI, TV, f, g). TI: Topic identification. A set of scientific documents. T T. g: utility func.. TV: Topic verification. A set of topics in the form of concept hierarchy, each represented as a time series. TR. Topic representation. D D. f: interest func.. E: Emerging. Nonemerging. Figure 3.1: An ETD model for scientific corpora utility functions (f and g). The ETD process in this model is shown in Figure 3.1. In summary, the model structure consists of:. M = {D, E, T, T R, T I, T V, f, g}. where:. 28.
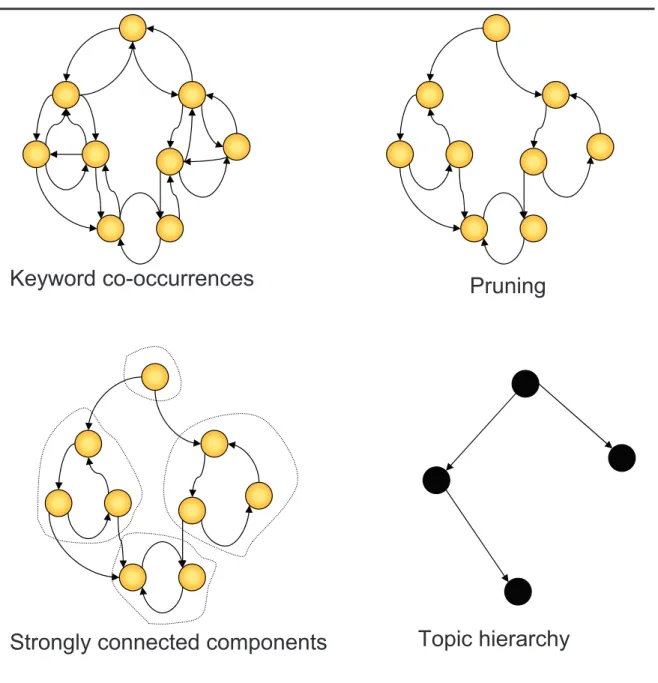
(41) • D = {dj }: The input: a set of scientific articles. • E: The output: a set of output emerging trends • T = {ti }: A set of topics organized in the form of concept hierarchy. • T R: The topic representation module. • T I: The topic identification module. • T V : The topic verification module. • f (.): The measure of growth in interest • g(.): The measure of growth in utility. 3.2. Building the Topic Hierarchy. Given an input corpus D consisting of scientific articles, we want to detect topics that are mentioned in D and organize them in the form of a hierarchy T . The method for building the concept hierarchy T can be described as follows: We extract noun phrases using the method described in [Bri92]. Based on the parts of speech tagging technique, this method includes the use of both lexical and contextual rules for identifying various parts of speech. The noun phrases extracted by the method compose of multiple modifications, including gerund verb forms [PY01]. The tf ? idf measure [SC73] is then used for selecting keywords from these noun phrases. The keywords provided by authors are selected regardless their tf ?idf ranking. We model the keyword co-occurrence by a weighed directed graph, where each node is a keyword and the weight of arc from node kwi to node kwj is the probability of occurrence of keyword kwi in a document containing keyword kwj :. c (i, j) = P (kwi |kwj ). 29.
(42) The algorithm to build the topic hierarchy can be described as follows: Step 1: The weights of all arcs of the graph are normalized. Step 2: Arcs of weights smaller than a certain threshold τ are virtually pruned. Note that an arc from keyword kwi to keyword kwj can be pruned while the arc back from kwj to kwi still remains. Step 3: The Tarjan algorithm [Tar72] are performed on the graph to find strongly connected components. Step 4: Keywords in a strongly connected component are grouped into a topic. Arcs between topics form a directed acyclic graph (DAG). Step 5: For each topic tj . We only keep arcs come from the topic ti that has maximum relation weight to the current topic, i.e, the sum of weights on all arcs from ti to tj is maximum. Step 6: The remained arcs between topic form a hierarchical structure.. 3.3. Topic Representation. Given a trial period of length ∆ years, we represent each topic ti in T by a time series: ¢ ¡ where tki represents ti in the k th year in the trial period. Each tki is ti = t1i , t2i , . . . , t∆ i associated with 6 parameters:. 30.
(43) Keyword co-occurrences. Pruning. Strongly connected components. Topic hierarchy. Figure 3.2: Building the topic hierarchy. 31.
(44) ti =NNs tki (1) tki (2) tki (3) tki (4) tki (5) tki (6). 1998 0.06 0.20 0.41 0.17 0.65 0.33. 1999 0.10 0.33 0.40 0.40 0.55 0.44. 2000 0.08 0.28 0.50 0.06 0.13 0.22. 2001 0.10 0.06 0.12 0.12 0.24 0.33. 2002 0.09 0.11 0.07 0.33 0.67 0.44. 2003 0.06 0.04 0.32 0.02 0.11 0.56. Table 3.1: Parameters associated with the topic “neural networks”.. • tki (1): determines how often the topic ti is mentioned in the k th year • tki (2): the weight of citations in the k th year to ti , in which ti is cited for referring to a theoretical basis, using methods or making comparison. • tki (3): the number of citations in the k th year to ti • tki (4): the influence of ti on other topics in the k th year • tki (5): the weight of author reputations of ti in the k th year • tki (6): the weight of sources (journals/proceedings) talking about ti in the k th year In existing ETD models, a topic is often represented by n-grams, term frequencies, and term co-occurrences [PY01, SA00] associated with date tags, author names, citations [Gev02, RT01], etc. In our model, we do not only consider individual topics, but also view each topic in its relation to other topics in order to examine its change in interest and utility over time. For this purpose, each topic is organized in the concept hierarchy and associated with many features extracted from scientific articles. This gives our model a richer representation scheme for topics so as to compute the growth in interest and utility more reasonably. Table 3.1 shows parameters associated with the topic “neural networks” extracted from our database. The tendency of each parameter is displayed in Figure 3.3.. 32.
(45) Neural network. Weight of mentioning Weight of citations. Normalized values. 1.20 1.00. Number of citations Influence. 0.80 0.60 0.40. Author reputations. 0.20. Weight of sources. 0.00 1998. 1999. 2000. 2001. 2002. 2003. year. Figure 3.3: The tendencies of parameters associated with the topic “Neural networks”.. 3.4. Summary. In this chapter, we have described the structure of an ETD model for scientific corpora, which is used for developing a fully-automatic emerging trend detection method. The model takes a scientific corpus as the input and produces the output as a set of emerging trends. No user interaction is modeled inside the detection process in order to deal with large corpora. We have introduced a method to build the topic hierarchy, which can be independently developed with other model components. Topic representation is an important part of ETD models, which controls the behaviors of all other tasks in an ETD process. However, which features reflect the interest and utility of a topic? There is no perfectly precise definition for those features because evaluation of interest and utility is subjective and depends much on user opinions. How researchers evaluate an emerging research topic? An emerging research topic should be mentioned many times in recent years, its theories and methods must have wide range of applications. Due to its usefulness for the development of other topic areas, it is usually talked/written by influential researchers, in many important scientific resources. According to the above view of emerging research topic, we attempt to model these. 33.
(46) criteria by associating each topic with its weight of mentioning, citation information, influence, author reputations and weight of sources. This representation scheme enables us to compute the interest and utility more reasonably, even if the topic representation module need to be improved, we need not to re-construct the model structure, need not to modify other modules so much because they are partially independent.. 34.
(47) Chapter 4 Topic Identification Topic identification is to fill up the representation of each topic by feature values. This chapters presents methods for extracting features associated with each topic as described in Chapter 3. We will focus on two main issues: topic detection and citation type detection. The computations of other parameters are also discussed.. 4.1. Topic Detection. Topic is the most frequently used, unexplained, term in the discourse analysis literature. In the topic detection research, the definition of topic is usually simplified to discourse topic, which is defined as “what is being talked/written about” [BY83]. The first task of feature extraction is identifying topics of a given document in order to compute the weight of mentioning a topic in a year. In context of text mining, this problem – called topic detection 1 – is a very important part of automatic text processing techniques, such as information retrieval, text categorization, text summarization, etc. Many methods of topic detection have been developed, which can be divided into three groups: statistical methods, knowledge-based methods, and hybrid methods. Statistical methods [SC73, DDL+ 90] infer the topic in the text from term frequencies, term 1. The preferred name of this problem is “topic identification”, but in context of our model, a topic has richer representation and the topic identification task has to do more than identifying the topic name, so we use another name to distinguish them. 35.
(48) locations, term co-occurrences, etc. without using external knowledge bases whereas knowledge-based methods [DeJ82, Leh82, RL94] rely on a syntactic/semantic parser, machine-readable dictionaries, etc. Hybrid methods [LM92, Hea94] combine statistical and knowledge-based advantages to improve the robustness of the identification process. Statistical techniques do not rely on knowledge-intensive resources and parsing are usually faster, more reliable, and more robust than knowledge-based methods. However, their lack of deep understanding results in lower accuracy of the systems. On the other hand, knowledge-based techniques normally require enormous human effort to build the necessary knowledge. Nonetheless, the effectiveness of the invested human effort is demonstrated in the high accuracy over the intended domains. We want to combine the advantages of both statistical and knowledge-based methods to achieve simultaneous high performance and cost-effectiveness. To this end, we describe a method of performing topic counting and generalization. By setting appropriate cutoff values for such parameters as concept generality and child-to-parent frequency ratio, we control the amount and level of generality of topics extracted from the text.. 4.1.1. Word Frequency and Word Significance. Associating word frequency, i.e., word counting, with word significance was proposed in Luhn’s pioneer work in automatic indexing [Luh57] and extracting [Luh58]. His proposal was based on the following assumptions: 1. Writers of a paper often emphasize an aspect of a subject through the repetition of certain words. 2. Writers usually use one sense of a word throughout a text. 3. Only a limited number of words are available to express a particular concept, even though writers might choose different words for the same concept for stylistic 36.
(49) reasons. The first assumption enables one to use word frequency to estimate word significance without resorting to linguistic analysis (such as syntactic or semantic methods) that are expensive to implement and not robust enough even at today’s scale of technology. The second assumption allows the reader not to be confusing of word-sense ambiguities. The third assumption can be addressed by using a thesaurus, which can be automatically acquired if enough sample texts are available. Luhn also recognized that some high frequency words, such as the closed-class words the, a, in, to, were too common to be significant. He set up a high cutoff which filtered out high frequency common words, and a low cutoff which eliminated insignificant low frequency words. Words between these two cutoffs he considered as possessing ”resolution power” (the ability of words to discriminate text contents). The two cutoffs were determined experimentally. Extending Luhn’s idea of insignificant common words to a complete text collection instead of just one document, Sparck Jones [Jon88] proposed a new word significance assignment scheme called inverse document frequency (idf) as follows: µ idf = log. N n. ¶ +1. where N is the number of documents in the collection and n is the number of documents in which the word occurs. The idf is smallest, i.e., most insignificant, for words occur in every document. Such words have no discrimination power over the collection. For words occuring only once in the entire collection, idf is maximal. Documents containing such words can be uniquely identified by the presence or absence of these words. Inverse document frequency is a very simple and useful term significance measure. It has been used in conjunction with Luhn’s original idea of within-document term frequency and in much other Information Retrieval research. Salton and Yang [SC73]’s combined within-document word frequency tf and inverse document frequency idf into a new term weighting scheme, which we now call tf ? idf . 37.
(50) They showed significant performance improvement over within-document frequency alone in information retrieval tasks. They also tried 287 different term weighting assignment methods, and reconfirmed that tf * idf has best performance. Although term weighting schemes such as tf, idf, and tf * idf have been well developed and applied in many practical cases, it has been criticized in the following aspects: First: Underlying the use of word frequency is the assumption that the more a word is used in a text, the more important it is in that text. This method recognizes only the literal word form and nothing else. Some morphological processing may help, but pronominalization and other forms of coreferentiality generally defeat simple word counting. Second: Lexical ambiguity of words undermines word counts. For example, the frequency of the word ”bank” is counted as 3 in “I bank my money in the bank on the bank of the Mississippi” is not really correct. Third: Straightforward word counting can be misleading since it misses conceptual generalizations. For example, “I bought some apples, oranges, and grapes”. What would be the topic of this sentence? We can draw no conclusion by using word counting method; where the topic actually should be: “I bought some fruits”. The problem is that the word counting method does not consider semantic relations among these words. We extend word frequency methods to incorporate knowledge about relations among words recorded in knowledge bases. As mentioned above, a weakness of word counting is that we cannot capture the deeper relations among words: two words may have very different spelling but may be very close semantically. So we need to count not word frequencies but topic frequencies.. 38.
(51) computer. Analog computer. Workstation. PC Personal Computer Microcomputer. Portable computer. Laptop computer. Digital computer. Multiprocessors. Mainframe. Desktop computer. Hand-held computer. Figure 4.1: The topic hierarchy.. 4.1.2. Topic Counting. In our ETD model, the set of topics T is already organized in the form of a concept hierarchy. Each topic is a set of synonymic terms and the hierarchical structure is based on hyponymy relationships between topics. Figure 4.1 is an example of the topic “computer” and its sub-topics. Given a topic ti ∈ T and a document dj ∈ D, we scan the entire document to count how many times a topic is mentioned, whenever a topic is counted, its parent topics are also counted. Let Count (ti , dj ) be the number of times we count the topic ti while scanning the document dj .. 4.1.3. Topic Selection. When scanning a document to count the number of mentioning a topic, we have to match each word (or n-grams) to the set of terms represented for the topic. If the word (or n-grams) matches two or more topics (polysemy mapping), we have to choose the corresponding topic for counting. To this end, when scan to a word (or n-grams) w in which the word-sense ambiguity happened. We add w into a queue for later processing and continue until the entire document is scanned. 39.
(52) For a word w in the queue, we check all topics which have a term matched this word. The word w is then matched to the topic having highest sum of counters along the path from root topic to this topic:. t = arg max w∈ti. X. c (tk , dj ). (4.1). tk ⊃ti. where dj is the document, t is the topic matched the word (n-grams) w that have to be identified, ti is a topic that has a term matched w, tk is a hypernym of ti .. 4.1.4. Generalization. The power of the concept frequency method lies in generalization. For example, we may have the following three sentences in a text: S1: Desktop computer prices fall. S2: Laptop computer prices rise. S3: Hand-held computer prices fall. The word ”prices” appears 3 times; ”fall” 2 times; ”Desktop computer”, ”Laptop computer”, ”Hand-held computer”, and ”rise” once. But if we count topics, the topic ”PC” appears 3 times; ”prices” 3 times; ”change” 3 times. Thus these three sentences could be generalized as: S4: PC prices change. Now a second problem presents itself: though we may find all the times sub topics are mentioned, we would also like to know that these topics can be combined into one topic so that we can identify topic of texts using the generalization rather than the particular. To this end, we define the branch ratio of a topic:. R (t) =. max (weight of all the immediate children) P (weight of all immediate children) 40. (4.2).
(53) where weight is the number of times a topic is mentioned in the text (for a leaf node), or the sum of the weights of all immediate children (for non-leaf nodes). It is obvious that the ratio is 1.0 if only one topic is mentioned in the source; while it is 0.0 for any topic not mentioned in the source. We found that the definition of ratio, R (ti ), is a way to identify the degree of generalization. The higher the ratio is, the less generalization power a parent node has over its immediate children. In our ETD model, the degree of generalization is selected according to the need of users for the degree of generalization of the output emerging trends.. 4.1.5. Evaluation. We designed an experiment, in which we selected 100 topics into the concept hierarchy T . For each article, we identified topics from the full text and from its abstract to compute three counts: hits : number of topics that are identified from full papers and also identified from their abstracts. mistakes : number of topics that are identified from full papers but are not identified from their abstracts. misses : number of topics that are not identified from full papers but are identified from their abstracts. We then borrowed two measures from Information Retrieval: Recall : hits/(hits + misses) Precision : hits/(hits + mistakes) The closer these two measures are to unity, the better the algorithm’s performance. We randomly selected 100 papers for testing and achieved values of 0.52 and 0.58 in Recall and Precision respectively. When we added the keyword provided by the authors to the set of keywords extracted using tf ? idf, the accuracy was much improved: 0.82 in Recall and 0.87 in Precision.. 41.
(54) 4.1.6. Computing the Weight of Mentioning a Topic in a Given Year. The relevance of the document dj to the topic ti is computed as: Count (ti , dj ) r (i, j) = P Count (tk , dj ). (4.3). tk ∈T. To determine how often the topic ti is mentioned in the k th year, we sum up all relevances of documents published in the k th year to ti : tki (1) =. X. r (i, j). (4.4). year(dj )=k. 4.2. Citation Type Detection. Citations appear very frequently in scientific articles and most of digital libraries now organize their papers in the structure of citation indexes [Sma73]. By examining the citations inside an article, we can reveal relationships between articles, draw attention to important corrections of published work and identify significant improvements or criticisms of earlier work [LGB99, KdRH+ 01]. However, this is still very difficult for researchers because the large and increasing number of articles prevents them from reading everything in the published literature. There is a clear need for new tools to identify the types of citation relationships that indicate the reasons for citation in a human-understandable way [Gev02]. The purpose of identifying the reasons for citations (citation type detection - CTD) varies according to the main objective of each research. The method of Nanba and Okumura [NKO00] uses an heuristic sentence selection and pre-defined cue phrases to classify citations into three categories for supporting a system of automatic review articles. To extend the usage of linguistic patterns, Teufel [Teu99] uses formulaic expressions, agent patterns and semantic verb classes instead of cue phrases to determine. 42.
図

+7
関連したドキュメント
Chapter 2 Improvement of fracture toughness of crystalline plastic materials using laminated structure The effect of elastomer lamination on the failure mode of
The main challenge of an effective phytoremediation strategy for the removal of heavy metals from contaminated sites is the choice of a potential plant species
Chapter 2 introduces the coupling degree model and kernel density analysis to analyze the coupling relationship between the spatial distributions of welfare facilities
Keywords: homology representation, permutation module, Andre permutations, simsun permutation, tangent and Genocchi
It is suggested by our method that most of the quadratic algebras for all St¨ ackel equivalence classes of 3D second order quantum superintegrable systems on conformally flat
For X-valued vector functions the Dinculeanu integral with respect to a σ-additive scalar measure on P (see Note 1) is the same as the Bochner integral and hence the Dinculeanu
The explicit treatment of the metaplectic representa- tion requires various methods from analysis and geometry, in addition to the algebraic methods; and it is our aim in a series
We have avoided most of the references to the theory of semisimple Lie groups and representation theory, and instead given direct constructions of the key objects, such as for
