A study of double assembly method for DNA sequences
5
0
0
全文
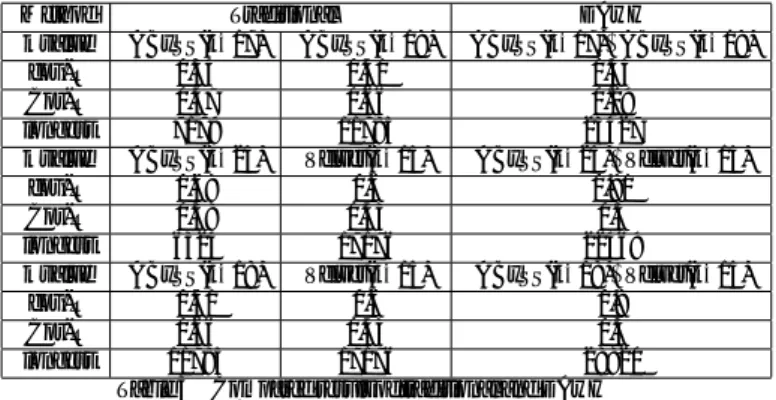
(2) Vol.2013-BIO-33 No.2 2013/3/21. IPSJ SIG Technical Report. Data. 30base 100000reads. k contig Number Max cov-R. 15. c. 17. w. c. 7 9 17176 5123 0.6. 2 8660. 30base 100000reads. k contig Number Max cov-R k contig Number Max cov-R. 15. c 28 6123. c 3 1197. 5 12180 0.16. c 1 1196. 16. w 24 6766 0.55 22. w 1 58808 0.02. c. c. 1 58807 0.01. 23. w. 1 1198. 17. w. 15 11 11150 17178 0.42 23. c 3 3694. 21. w. c. 1 58809 0.01. 25. w. 1 1200. 8 14202 0.01. c. 27. w. 29 51 2831 3922 0.39. c. w. 177 245 422 385 0.37. Assemble effection by k-value for each data(VELVET). Table 1 Data. 19. w. w 1 55131 0.08. Table 2. c 8 7179. c. 18. w. c. 9 17180 0.34 24. w. 6 5 10031 14194 0.48. 19. w. c. 8 4 11785 17182 0.41 25. 1 25. 4 28825 0.0004 26. c. w. c. 17 6324. 12 3331. 38 3292. 0.68. 20. w. w 45 3920 0.49. c 3 1195. 21. w 1 58806 0.02 27. c. w. 120 1508. 126 873. c 2 1197. w 1 58806 0.02 21. c. w. 0.52. Assemble effection by k-value for each data(ABySS). methods(DAwH). In order to keep contig accuracy, we generated contigs based on overlap region with lower limit as follows. ( 1 ) Prepare the whole sequence and read dataset whose base allocation is known. ( 2 ) Obtain contigs from traditional assembly methods for any k-mers. ( 3 ) Determine the combination of the k value and assembly method by mapping them to reference as Fig 1,2. ( 4 ) Generate adjacency graph by all pairs of contigs with longer than 5 base overlap region. ( 5 ) Decide optimal path with high value of overlap region. To confirm the effect of double assembly, we carried out experiments and evaluated contig length, coverage ratio, correct ratio as Table 3.. Fig. 1. Feature of mapping region by difference of k value : ABySS. Abbr cov-R Cor-R Longest. parameter Coverage rate for reference sequence Correct ratio of output contigs Longest correct contig length Table 3 Evaluation values. We determine the combination of k value and assembly method as shown in Table 4 by the feature of mapping region based on Fig 1,2. Table 4. Combinations of k values and assembly method ABySS(k=17)+ABySS(k=18) ABySS(k=25)+Velvet(k=15) ABySS(k=18)+Velvet(k=15). Table 5 shows the compared result of traditional and DAwH. We could generate longer contig and increase cov-R by combining the result of different k-mers and assembly method compared with traditional, however Cor-R was decreased. In other words, incorrect contigs were generated by proposed method. We need more evaluation indexes to improve Cor-R by avoiding occurrence of incorrect contigs. Fig. 2. Feature of mapping region by difference of k value : Velvet. 4. Double Assembly method with Machine Learning:(DAwML) If we can discriminate correct combining and incorrect combining in advance, we can escape the occurrence of incorrect contigs output and improve accuracy of the assembly result. Jeong-. c 2013 Information Processing Society of Japan ⃝. 2.
(3) Vol.2013-BIO-33 No.2 2013/3/21. IPSJ SIG Technical Report. Method k value cov-R Cor-R longest k value cov-R Cor-R longest k value cov-R Cor-R longest. Traditional DAwH ABySS(k=17) ABySS(k=18) ABySS(k=17)+ABySS(k=18) 0.34 0.41 0.55 0.47 0.66 0.29 7179 11785 23427 ABySS(k=25) Velvet(k=15) ABySS(k=25)+Velvet(k=15) 0.68 0.6 0.91 0.58 0.43 0.5 6324 17176 22469 ABySS(k=18) Velvet(k=15) ABySS(k=18)+Velvet(k=15) 0.41 0.6 0.8 0.66 0.43 0.3 11785 17176 28820 Table 5 Compared result of traditional and DAwH. Hyeon[14] applied machine learning and predicted short reads and contigs containing read-error by use of p-value of k-mer’s coverage value for each contig. Generally, contig is composed by k-mers. Additionally, each kmers has coverage value shown as Fig 3 and we can get (l − k + 1) number of k-mers from a l length contig.. We can apply p-value of k-mer’s coverage value to deal them evenly. In addition, we defined the weight of overlap region about a pair of former and latter contigs by use of each contig’s base coverage(basecov) and overlap length lovlp with geometric mean as follows. ∑l−k+1 basecov =. i=1. coverage value lcontig. √ ovlp_cov = lovlp × basecov f orm × basecovlat. (1) (2). As for the parameters that have relationship with discriminant, we had contig’s distribution value of k-mer’s coverage and base coverage for each former and latter contig as shown in Table 6. We used C4.5[15][16] as decision tree to derive discriminant rules. Decision tree construct effective rules from training data by weighting for accuracy of classifiers and output useful characteristic parameter for discriminant rule. Abbr. Fig. 3. Contig is constructed by k-mer. For the parameters that have relationship with the discriminant, we had each paired contig’s k-mer’s coverage value and distribution of it. For deciding discriminant rule from these parameters, we focused on machine learning technique, especially on the supervised learning. In order to obtain training data, we generated artificial contig data by use of all pairs of contig with overlap region more than 5 bases and determined them consistent or inconsistent by comparing to the original sequence. Finally, we obtained the discriminant rules by applying training data to machine learning. Actual procedure for getting discriminant rule is as follows. ( 1 ) Prepare the whole sequence and read dataset whose base allocation is known. ( 2 ) Obtain contigs from traditional assembly methods for some k-mers. ( 3 ) Determine the combination of the k value and assembly method by mapping them to reference as Fig 1,2 ( 4 ) Generate contigs by all pairs of contigs with longer than 5 base overlap region. ( 5 ) Distinguish restored sequences consistent or inconsistent by comparing to original sequence. ( 6 ) Obtain the parameters ( 7 ) Derive discriminant rules from C4.5 with the training data that consists of above parameters value and consistency judgement. Coverage value depends on read coverage and k value. When the k value is larger, k-mer’s coverage value decrease overall.. c 2013 Information Processing Society of Japan ⃝. Charactristic parameter p value of overlap length ovlp_cov of all overlap region in graph ovlp_weight (p value of overlap length) × ovlp_cov mean_cov(form and lat) mean of coverage m_cov(form and lat) minimum of coverage 25_cov(form and lat) 25 quartile p value point of coverage 50_cov(form and lat) 50 quartile p value point of coverage 75_cov(form and lat) 75 quartile p value point of coverage M_cov(form and lat) Max of coverage SD_cov(form and lat) standard deviation of coverage Table 6 Characteristic parameters. We prepared the Herpesvirus sequence packaged SSAKE and generated combined sequence with combination as shown in Table 4. With the consequent discriminant rule from C4.5 for training data, we applied to the training data itself and observed learning ability. Table 7 shows discriminant result form and we defined learning accuracy as follows. Le − R = 1 −. num2 + num3 num1 + num2 + num3 + num4. (3). Table 8 shows the discriminant result of each double assembly combination and learning accuracy. Fig 4 shows a decision tree by the combination of ABySS(k =18)+ABySS(k=15).. Table 8. ABySS(k=17)+ABySS(k=18) correct incorrect Le-R consistent 7 1 0.975 inconsistent 0 32 ABySS(k=25)+Velvet(k=15) correct incorrect Le-R consistent 15 1 0.875 inconsistent 3 13 ABySS(k=18)+ABySS(k=15) correct incorrect Le-R consistent 5 4 0.878 inconsistent 0 24 Discriminant results of each combination’s training data. 3.
(4) Vol.2013-BIO-33 No.2 2013/3/21. IPSJ SIG Technical Report. consistent inconsistent. correct incorrect num1 contigs judged as correct for ”consistent” num2 contigs judged as correct for ”inconsistent” num3 contigs judged as wrong for ”consistent” num4 contigs judged as wrong for ”inconsistent” Table 7 Discriminant result form. performance for each case by evaluation value as shown in Table 3. We prepared experimental datasets as follows. Reference length 60000 read length 30base number of reads 150000reads packaged SSAKE Table 9 Experimental datasets. Fig. 4. Decision tree constructed by training data with ABySS(k =18)+ABySS(k=15). We could find that rules by machine learning could discriminate consistent and inconsistent contigs although with a little discriminant error from Table 8. The derived number of correct rule was greater than that of incorrect rule and k-mer’s coverage with upper quantile was often regarded as effective parameter. Because we can derive rule for collect assembly and incorrect assembly, we assigned each rule to generate the result of k-mers and assembly method, about two cases as follows. case1 Eliminate combined contigs that don’t satisfy the rule of correct assembly. case2 Eliminate the combinations that satisfy the rule of incorrect assembly. From the above, we proposed DAwML (Double Assembly method with Machine Learning) as follows. step1 Prepare the whole sequence and read dataset whose base allocation is known. step2 Obtain contigs from traditional assembly methods for each specified k-mer. step3 Determine the combination of the k value and assembly method by mapping them to original sequence. step4 Generate contigs by all pairs of contigs with longer than 5 base overlap region. step5 Distinguish restored contigs ’consistent’ or ’inconsistent’ by comparing to original sequence. step6 Calculate characteristic parameters for all pairs of contigs with longer than 5 base overlap region. step7 Obtain the discriminant rules those are correct and incorrect rules from C4.5 with the training data that consists of above parameters value and consistency judgement. step8:case1 Eliminate combined contigs that don’t satisfy correct rule and output contigs. step8:case2 Eliminate the combinations that satisfy incorrect rule and output contigs.. 5. Comparative study To confirm the effect of our proposed method, we carried out comparative experiments of traditional assembly method with specified k value , double assembly with heuristic approach (DAwH) and double assembly with machine learning(DAwML). As described in the previous section, since we could obtain correct and incorrect rule for each training data, we compared the. c 2013 Information Processing Society of Japan ⃝. Method Traditional DAwH DAwML k value 17 18 17,18 case1 case2 cov-R 0.34 0.41 0.55 0.53 0.2 Cor-R 0.7 0.6 0.2 0.5 0.5 longest 7179 11785 23427 23427 23427 Comparative result of Traditional, DAwH and DAwML Table 10 in the case of ABySS(k=17)+ABySS(k=18). Method Traditional DAwH DAwML k value 15 25 15,25 case1 case2 cov-R 0.6 0.68 0.98 0.5 0.89 Cor-R 0.44 0.58 0.51 0.78 1 longest 17176 6324 22469 6752 22469 Comparative result of Traditional, DAwH and DAwML Table 11 in the case of ABySS(k=25)+Velvet(k=15). Method Traditional DAwH DAwML k value 15 18 15,18 case1 case2 cov-R 0.6 0.42 0.8 0.54 0.27 Cor-R 0.43 0.57 0.3 0.13 0.6 longest 17176 11150 28820 28820 11800 Comparative result of Traditional, DAwH and DAwML Table 12 in the case of ABySS(k=18)+Velvet(k=15). We found that Cor-R has improved with keeping cov-R and maximum length by comparing DAwH and DAwML-case1 from Table 17, especially about Table 18, we could remove all incorrect contigs with keeping maximum length by comparing DAwH and DAwML-case2. In Table19, we could generate longer contig but lost many correct contig by comparing DAwH and DAwMLcase1 and we improved Cor-R but lost longest and many correct contigs by comparing DAwH and DAwML-case2.. 6. Conclusion In order to get longer and accurate contig independent of k value and assembly method, we proposed Double Assembly method with Heuristic approach (DAwH) and Double Assembly method with Machine Learning (DAwML). From comparative experiments, we found that we can generate longer contig by combining the result of k value and assembly method with DAwH. However, since the result of DAwH contains many incorrect contig, discriminant rule of machine learning with DAwML is used to improve the accuracy of the assembly result. We regarded upper quantile of k-mer’s coverage for contig as high usable characteristic parameter. 4.
(5) IPSJ SIG Technical Report. Vol.2013-BIO-33 No.2 2013/3/21. References [1] [2] [3] [4] [5] [6] [7] [8] [9]. [10] [11] [12]. [13] [14]. [15] [16]. Rene L. Warren , Granger G. Sutton , Steve J. M. Jones and Robert A. Holt : Assembling millions of short DNA sequences using SSAKE, Bioinformatics, vol.23 no.4, pp.500-501, (2007) Hernandez D, Francois P, Farinelli L, Osteras M, Schrenzel J. De novo bacterial genome sequencing: millions of very short reads assembled on a desktop computer. Genome Res. 2008;18:802―9. Daniel R. Zerbino and Ewan Birney : Algorithms for de novo short read assembly using de Bruijn graphs, Genome Research, vol.18, pp.821- 829, (2008) ”Jared T. Simpson, kim Wong, Shaun D. Jackman, et al”ABySS: A parallel assembler for short read sequence data, Genome Research, vol.19, pp.1117- 1123, (2009) Li R, Li Y, Kristiansen K, Wang J. SOAP: short oligonucleotide alignment program. Bioinformatics. 2008;24:713―4. Zhenyu Li, Yanxiang Chen ”Comparison of the two major classes of assembly algorithms: overlap― layout―consensus and de-bruijngraph ”Briefings in Functional Genomics (2012) 11 (1): 25-37 Jason R. Miller, Sergey Koren, and Granger Sutton : Assembly Algorithms for Next-Generation Sequencing Data , Genomics 95 pp315327(2010) Lin Y, Li J, Shen H, Zhang L, Papasian CJ, Deng HW : Comparative studies of de novo assembly tools for next-generation sequencing technologies, Bioinformatics. 2011 Aug 1;27(15):2031-7 Steven L. Salzberg1,7, Adam M. Phillippy2, Aleksey Zimin3, Daniela Puiu1, Tanja Magoc1, Sergey Koren2,4, Todd J. Treangen1, Michael C. Schatz5, Arthur L. Delcher6, Michael Roberts3, Guillaume Marais3, Mihai Pop4 and James A. Yorke:GAGE: A critical evaluation of genome assemblies and assembly algorithms ,Genome Res. 2012. 22: 557-567 “ Guohui Yao. Liang Ye, Hongyu Gao, Patrick Minx, Wesley C. Warren, George M. Weinstock ” (2012) Graph accordance of nextgeneration sequence assemblies, Vol. 28 no. 1, pp13-16. “ Jurgen Nijkamp, Wynand Winterbach, Marcel van den Broek,JeanMarc Daran, Marcel Reinders, and Dick de Ridder ” Integrating genome assemblies with MAIA ”Vol.26 ECCB 2010, pp433―439 “ Yu Peng, Henry Leung, S.M. Yiu, Francis Y.L. Chin ”: ”IDBA - A Practical Iterative de Bruijn Graph De Novo Assembler ”, Research in Computational Molecular Biology, 14th Annual International Conference, RECOMB 2010, Lisbon, Portugal, April 25-28, 2010. Volume 6044/2010, 426-440, Jared T. Simpson and Richard Durbin : ”Efficient de novo assembly of large genomes using com- pressed data structures ” Genome Res. 2012 22: 549-556 originally published online December 7, 2011 Jeong-Hyeon Choi1,*, Sun Kim1,2, Haixu Tang1,2, Justen Andrews1,3, Don G. Gilbert1,3 and John K. Colbourne1:’A machinelearning approach to combined evidence validation of genome assemblies’ Vol. 24 no. 6 , pp. 744―750,(2008) J. Ross Quinlan Morgan Kaufmann, San Mateo,CA: ”C4.5:Programs for Machine Learning”(January 1993) Thomas G. Dietterich:’Machine-Learning Research Four Current Directions’ (AAAI) AI Magazine Volume 18 Number 4 (1997). c 2013 Information Processing Society of Japan ⃝. 5.
(6)
図
関連したドキュメント
We show that a discrete fixed point theorem of Eilenberg is equivalent to the restriction of the contraction principle to the class of non-Archimedean bounded metric spaces.. We
The importance of our present work is, in order to construct many new traveling wave solutions including solitons, periodic, and rational solutions, a 2 1-dimensional Modi-
In this paper, we apply the modified variational iteration method MVIM, which is obtained by the elegant coupling of variational iteration method and the Adomian’s polynomials
Here we purpose, firstly, to establish analogous results for collocation with respect to Chebyshev nodes of first kind (and to compare them with the results of [7]) and, secondly,
Based on these results, we first prove superconvergence at the collocation points for an in- tegral equation based on a single layer formulation that solves the exterior Neumann
Furthermore, we also consider the viscosity shrinking projection method for finding a common element of the set of solutions of the generalized equilibrium problem and the set of
To derive a weak formulation of (1.1)–(1.8), we first assume that the functions v, p, θ and c are a classical solution of our problem. 33]) and substitute the Neumann boundary
We provide an efficient formula for the colored Jones function of the simplest hyperbolic non-2-bridge knot, and using this formula, we provide numerical evidence for the
