Rating Methodology in Structured Finance : Why
Risk Shift Has Occurred in Re-securitization?
著者名(英)
Midori Munechika
journal or
publication title
The economic review of Toyo University
volume
35
number
2
page range
159-183
year
2010-03
東洋大学「経済論集」
35巻2号 2010年3月
Rating Methodology in Structured Finance
Why Risk Shift Has Occurred in Re-securitization?
Midori Munechika
Contents
I. Introduction ll, Evolution ofthe SF markets 皿【. Characteristics ofthe SF products IV. Tranching of Credit Risk V.Moody’s BET Model VI. Concluding Remarks1. lntroduction
Innovation and competition are key features of financial markets. Over the last decade, a high level of 行nancial innovation has been seen in the area of structured finance(SF)in the U.S. The market developed globally and experienced exponential growth until July 2007. Turning around, the greater pa宜of resulting global financia川osses triggered by the U.S. subprime mortgage crisis were concentrated in the SF products. Structured finance is receiving far more attention not only from investors and academics, but also from policy makers than it has any time befbre the crisis. Structured finance can be defined a form of financial intermediation that transforms nonmarketable credit assets into marketable securities using securitization tec㎞iques. It is characterized as credit risk transfer activities・ Investors to SF products face relatively high costs in assessing their structures and risk profiles due to asymmetric information. Tb promote the acceptance of new SF products by investors, the issuers wanted them to be rated. Consequently, the SF markets were largely developed as‘‘rated”markets from the beginningi. In addition, with the introduction of Basel II, extemal ratings have entered the廿amework of IMoody’s first rated SF CDO was issued in l998. See Hu[20071, p.44,international regulation of bank capital. Rating agencies have played more of a key role in the SF markets than ever befbre. However, since the advent of the U.S. subprime mortgage crisis, confidence to the SF rating agencies has been undermined. This article provides an overview of how the rating agencies assign credit ratings on SF products. The purpose of this article is to highlights the process of why a collateral debt obligation(CDO)can offer high rated of Aaa trances from risky subprime mortgage bonds. The second section traces the evolution of the SF markets up to the subprime crisis in 2007. The third section sets out the characteristics of SF products and the process of re-securitization. The fourth section illustrates the tranching of credit risk which is the es- sence of SF products. The fifth section is devoted to analyzing the Moody’s CDO rating methodology, so-called BET model. The final section summarizes the key points of this article and offers a few conclud- ing remarks on model risk.
H. Evolution of the SF markets
The subprime mortgage loan market has grown in the U.S. since the mid l 990s. The originations ofsub- prime loans sharply increased from 2003 to 2005、 Over these three years, the origination grew from about $335billion to$625 billion and the share of securitized originations to subprime mortgage backed securities (SMBS)rose from 60.30/e in 2003 to 81.1%in 2005(Figure l). The issuance of SF CDOs sharply increased 廿om 2003 to 2006, which was coupled with considerable changes in the distribution of its underlying assets (Fig・・e 2). SF CDO・ar・・e-・ecu・itizati・n・f・xi・ti・g CDO t・an・hes2.1・p・rti・ul・・, i・1・t・2005, th・ groWth of subprime origination drove a tremendous increase in the SF CDO issuance through repacking SMBS tranches. It was a spiral:The issuance of residential mortgage backed security(RMBS)increased demand for subprime assets for their collateral pool, which, in turn, encouraged fUrther subprime origination to meet new demand as can be inferred f「om the fact that a substantial portion of collateral pool of SF CDOs has concentrated to a single asset sectoらmainly RMBS(Figure 3). The close integration among loan origi- nation, issue of RMBS, and repacking CDOs has become crucial to the mortgage industry, which makes it highly dependent on the SF markets. As a consequence of an‘‘originate to distribute”business model of some of large banks and insurance companies, numerous SF CDO tranches dominated by Aaa-rated tranches had linked to risky subprime mortgage loan3. The long origination-securitization-repacking chain had ac- celerated risk exposure of SF products to the subprime mortgage market. 2They are also known as ABS CDOs or resecuritization. 3Credit risk transfer activity using SF products is motivated largely by regulatory arbitrage in order to better aligri regula- tory and economic capital, Basel ll increases incentive for banks to sell higher-risk assets. See IMF[2006],p.58.Rating Methodology in S tructured Finance Figure1 Subprime Origination and Securitization
㎜旭鍋㎜姻蜘加mO
In billiens ef U.S.dollars % ・60.3 625
50.0 507
335 戸190 202
、F
Fu ミ
95
、X…
漂芸 難; i舞 2001 2002-SuわP血e Origi瓜ation8
2003 2004 2005 2006 睡S1》[BS →-Share of Subprime SecuritiZed 90.0 80.0 70.0 60.0 50.0 40.0 30.0 20.0 10.0 0.0 Source:Author’s compilation based from Gordon[2008]. p.6. Figure 2:Growth of SF CDO lssuance and its Rating Distribution O==拍⇔萌⊃00
W0
U0
S0
Q0
O0
W0
U0
S0
Q0
O
2 」1 1 T f f
ロ<=Baa口A
口Aa
ロA8a
1998
1999
2000
200↑ 2◎02 20X}3 Year Of lecuence㎜
2005
2006
<嘔:3.7% A:3.8% As:75% Aaor:e5%i
Note:The data do not inc]ude non-U.S. dollar denominated tranches and wrapped tranches. Source:Hu[2007], p.45,Figure 3 Distribution ofAsset Types Backing Cash and Hybrid SF CDOs
100%
go%
80%
γ0%60%
oos6
40%
30%
20%
10%
0%200t 2002 2003
Yea「of lssua轟C● ぽlOth合r8口RE「r
口CDO8
口CMBS{excl CRE
¢DOs)口Commg「ぴal A8S
口MH
口prime&Alt-A只MBS
口Subpパme RMBS
Note:The share by asset type is calculated by summing up the collateral par amount belonging to a given asset type but from all transactions and dividing it by the total collateral par amount of all transactions. CRE CDOs and synthetic SF CDOs are not included in this figure. The share of subprime mortgage related SF CDOs would be higher if synthetic deals were included. Source:Hu[2007], p.47. Figure 4:Share of U.S. ABS CDOs Downgrade, by lnitial Rating and Vintage Percent 35 Vintage Note: Data as of25 November 2007 from Standard and Poor’s. Source:BIS[2008], p.48. The majority of the SF CDOs issued until 2005 did not experience rating changes, but those issued in 2006 and 2007 have experienced significant negative rating changes due to their concentrated exposure to sub- prime MBS and other non-agency RMBS(Figure 4). The most significant rating downgrade occurred in lower rated(Le., mezzanine)tranches of recent vintage CDO deals. The largest investors in mezzanine tranches were insurance companies and asset managers. However, virtually every investor class, includingRating Methodology in Structured Finance Aslan-and European banks, pension funds, and hedge fUnds had invested in the mezzanine tranches, which tend to rely on credit ratings. For example, insurance companies and pension fUnds use credit rating in their internal guidelines, and banks use it in the f\amework of international regu】ation of bank capitaL According to the IMF[2008B], tota川osses of the subprime crisis in globa団nancial sectors amounted to $L4 trillion as of October 2008(Table l), an amount equal to the 10%ofthe U. S. GDP, and the costs spread quickly and broadly across dif1セrent countries and institutions. Banks shoulder about halfofthe total losses and nonbank financia川nstitutions bear the remainde仁 Losses of$425 billion stems from loans, with the worst hit assets being subprime loans(17%10ss on outstanding). Related securities account fbr more than twice that amount,$980 b川ion, with the worst hit securities being ABS CDOs(73%loss). ABS CDOs are SF products created as a result of securitization chain. To get to the heart of the subprime crisis, a deep understanding ofstructured f]nance, especially SF CDOs is required. Table 1:Estimates of Financial Sector Potential Losses (Inbillions of U.S. dollars) Base Case Estimates of Writedown on U.S. Loan8 Writedown on U.S. Loans April OctOber Estimated Estimated mark・to-market mark-to-market Outstandings losses losses Banks Subprime Alt・A Prime Commercial real estate Consumer loans Corpo「ate Ioans Leveraged loans Tota】fOr Ioans 300 600 3、800 2、400 1,400 3,700 170 12,370 45 30 40 30 20 50 10 225 50 35 85 90 45 110 10 425 Base Case Estimates of Mark-tO Market Los8es On Related Securities 35・40 20-25 25・30 60-65 30・35 80・85 5-10 255・290 Other Pensions/ GSEs and (hedge Insurance Savings government funds, etc) 0-5 0・5 0’5 5-10 0・5 0・5 0・5 5・40 0・5 0・5 0・5 0・5 0-5 0・5 0-5 0・35 5 5 5 4 ‥ } 一 } . , 噺 5 5 5 4 Los8es on Securities 10-15 5-10 0-5 10・20 10・15 25-30 0・5 60-100 April October Estimated Estimated mark・to-market mark-to・market Outstandings losses losses Banks Other Pensionst GSEs and (hedge Insurance Savings govemment funds, etC)
ABS
ABS CDOs Prime MBSCMBS
ConsumerABS High・grade corporate debt High・yield corporate debt CLOs Total for securities Tbtal for loans and securities 1,100 400 3,800 940 650 3,000 600 350 10,840 23,210 210 240 0 210 0 0 30 30 720 945 210 290 80 正60 0 130 80 30 980 1、405 100-110 145・160 20・25 80・90 65・75 45・50 15・20 470’530 725・820 40-45 55・75 10・15 20-25 20・30 10・15 0-5 155・210 160-250 35・55 30・45 10-20 15・35 20・35 15・20 0-5 125-215 125-250 10・15 15・20 20・25 10・20 55・80 100^135 10-25 15・30 0・5 15・20 5-20 5・15 5・10 55・125 115-225 Note:The prime residential loans category includes a portion of GSE-backed mortgage securities. ABS=asset-backed security;CDO;collateralized debt obligation;CLO=collateralized loan obligation;GSE=govemment-sponsored enter- prise;CMBS=commercial mortgage-backed security;MBS=mortgage-backed security. Source:IMF【2008B], p.15.皿【. Characteristics of the SF products
Securitization is a process of distributing risk by aggregating debt instruments in a pool, and then issuing new securities backed by the pool4. It diversifies risks by pooling instruments and the cash flows are origi- nally provided to investors of securitized instnlments on a pro rata basis. The process of pooling debt in- struments such as bonds, loans, or mortgage backed securities involves aggregating multiple risks underlying those instruments(such as market, credit and liquidity risks). The structuring and the ability to embed various risks into fUnded capital market instruments fbr investors’and institutions’needs are called structured 行nance. Therefbre, a SF product entans aggregating those risks and transfering the credit risk associated with a pool of underlying collateraL The universe of SF products is wide-ranging and is o且en related to credit derivatives. The IMF[2008A] categorizes stnlctured finance products as shown in Figure 5. Securitization began in the l 970’s with crea- tion of structured financing fbr pools of mortgages. In the process of securitization, the mortgage loan has been transferred廿om the bank’s balance sheet to a standalone special purpose vehicle(SPV)which fUnds these assets by issuing securities. The securities are the obligation ofthe SP~C not the obligation of the bank that originated the mortgage, and are collateralized by the cash flows fXom a pool of underlying the assets (i.e., de-1inking of credit risk). Asecurity collateralized by the cash flows from a pool of underlying assets, such as loans,1eases, and receivables is called an asset-backed securily(ABS). An ABS-type securltlzatlon with an‘‘originate to distribute”business model has grown since 2005, which has led to diversi丘cation ofthe SF products and their complexity in the process of the re-securitization chain. When the cash flows are collateralized by real estate, the security is called a mortgage-backed security(MBS). A residential mort- gage backed security(RMBS)is an MBS that is backed by residential mortgage loans, and a commercial mortgage-backed security(CMBS)is an MBS backed by loans on commercial properties、 Securitization techniques were extended to other asset classes such as auto loans, and credit card receivables. Credit derivatives are financial contracts that transf>r defined credit risks in a credit product(or a pool of credit products)to the counterparty, without transferring the ownership of the underlying assets. They emerged around l 993-94 as a part of the over-the-counter(OTC)derivative market. Credit default swaps are default-triggered credit derivatives, which are instruments that give the holder the right to sell a bond fbr its飴ce value in the event of a default by the issuer. Credit derivatives are o丘en closely connected with SF products through the process of securitization by the counterparty. Commoditization of credit risk has 4See Downes, J. and J. E. Goodman[1998】.Rating Methodology in Structured Finance Figure 5:Universe of Structured Finance Products Source:IMF[2008A】,p.57. accelerated through securitization, coupled with credit derivatives5. A collateralized debt obligation(CDO)is a structured credit security backed by a pool of securities, loans, or credit default swaps, where the credit risk of a portfblio of underlying exposures is segmented into tranches of varying seniority and risk exposures6. The meaning of creating tranches is the differentiation of risks. Therefbre, more precisely, a CDO can be considered as a technology designed to distribute risks more efficiently to a broader base of investors to meet their various combinations of risk/retum profiles7. ABS CDOs are collateralized debt obligations(CDOs)backed by pools of asset-backed securities(ABS)including tranches of residential and commercial mortgaged-backed securities(RMBS and CMBS)and other CDOs. For example, a pool ofBBB-rated RMBS was converted(repackaged)into new securities(ABS CDOs)with tranche ratings from AAA down to unrated. The ABS CDO is an example of a‘‘two-layer”securitization (i.e., the second level ofsecuritization in Figure 6). The BIS[2005B]pointed out three key characteristics of structured finance:(1)pooling of assets,(2) tranching of liabilities that are backed by these collateral assets8, and(3)de-linking of the credit risk of the 「「6
78
See Kothari[2009】pp.3・5 in more detail about credit derivatives and the securitization. The term CDO had its origin in the collateralized mortgage obrigation(CMO), which is an instrument developed ln US mortgage securitization market ACDO is a generic name fbr collateralized loan obligations(CLOs)and collateral bond obligations(CBOs), whose co1[ateral pools consists of corporate loans and corporate bonds, respectively. In l 990, the first rated CDO came to the market. See Kothari[2009], p.167-168 and Carron[2003],pp.10-11. A CDO does not necessariry mean an asset class. See Yan, Ustun and Jiang [2008], p.2. The resulting cash flows from the collateral pool are divided into slices paid to different investors, which is called “tranches,,.〈NOロO∨ ︻﹀向口] ●■●●● 〈OqOoo自NNΦΣ〉 ︻﹀らロ。] ︿O自Ooo自Φ号閃﹄O垣仙=]﹀ 【〉氏oカ一 ●●● ・“ ● ■ ●
4
」
一 一 一 一 一 一 一 一 ●■■●●■●■●●■●■■■●■■■■●■ .吟﹃ら、[o◎OON]ロo官2︶ロo唱o。ーd£口oロ雲且日oot‘㌔o日田く60﹂ヨooり “■・ l I 〈ooβoΣばΦ日唱工∨ [﹀エロQ一▲」
〈oりqo一5る日〔包自ロ自〉 【〉向ロ。一一一一一一一一一
〈-。已頃q日Φ匂ρ句bρ七〇芝〉 で句ロ リ弓20で80
きら2属畠 Lρw High Borrower Down Payment Φ」コ一〇コ」↑ω》石⑩αΦ匡ムワムOO筥」閃⊂O=句N≡」コOΦω・Φ匡 ⑩Φ」コ亘」 ・Rating Methodology in Structured Finance collateral pool from the credit risk of the originator, usually through use of a standalone financing vehicle, referred to as a special purpose vehicle(SPV). The second characteristic of credit-tranched structure dif二 飴rentiates structured finance from traditional pass-through securitizations while the first and third character一 ゆ の Istlcs are common to both types. There are at least fbur speci行c o句ectives of making SF products:yield enhancement, credit enhancement, providing a desired payoff profile, and facilitating asset/1iability manage- ment needs ofthe client. The credit risk profile of CDO tranches can be divided into three slices:senior, mezzanine and equity. Each tranche has unique risk and retum characteristics, but all tranches of the CDO are backed by the same pool of collateral assets. The tranches are formed by the risk level in them, not by class動ng the rating of th・i・und・・lyi・g・・11・t・・al assetsg. Th・CDO d…n・t d・飴・1t i・th・・am・・en・e a・ac・印・・at・b・nd d…. In rating CDOs, the definition of default is designed to capture credit events that result in impairments to bondholders’contractual claims, in other words, shortfalls in distribution of principal or interestlo. Hence, the rating of the CDO tranche is based on its ability to service debt with the cash flows generated by the un- derlying assets and determined by the priority of payments(principal and interest)during defauhs. The tranches are collectively refヒrred to as the producピs‘‘capital structure”(Figure 7). The senior part consists of tranches rated above AAA, including super-senior AAA. The mezzanine part consists of tranches rated between AA and BBB, which are still rated investment grade. The equity part is either rated below investment grade or not rated at alL For example, the equity tranches entail the greatest credit risk since they are the first to absorb losses when losses are realized on the underlying portfblio, The mezzanine Figure 7:CDO Capital Structure Average Subprime MBS
AAA
79.3% AA;6.6%Average
Alt-A MBS
Sourcel Author’s Compilation based on BIS【2008], p9, and Ashcraft&Schuermann[2008],p.30. 9 See Neftci[20081, pp514-515, p548, 1° l・・dy’・se・k・t・id・ntify・nly th・se ec・n・mi・1・sse・th・t・・e・the・e・u[t・fac・edit・v・nt See K・th・・i[200gl, P」4.tranches enta川ess credit risk because they absorb losses only ifall equity tranches subordinate to them have already been exhausted. The least credit risk tranches are the senior tranche.
1V. Tranching of Credit Risk
Credit risk of a CDO can be assessed by probability de fau lt(or expected loss)in the underlying collateral pool11. In statistical analysis ofthe probability of default ofthe pool, the number ofassets has an impact on the probability distribution. Although a CDO is an ABS-type securitization, one of the striking differences is the number of assets in the pooL The collateral pool of the traditional ABS consists of 1arge numbers of relatively homogeneous individual holdings(e.g., severaいens of thousands of consumer-and corpo- rate-related assets such as credit cards, etc.)while the pool of CDOs has much fewer and heterogeneous debt i。、t。、m,nt、(typically、・nsi・ti・g・f 50 t・150・f・blig・・s), whi・h・i・・reflect・d i・th・g・an・1・・ity・fth・p・・112・ As the granularity of the pool increases, the probability distribution tends to become normal. The probabil- ity of default of the pool of ABSs tends to exhibit behavior suggested by a normal distribution, whereas the probability distribution of the pool of CDOs tends to be similar to a binomial distribution, whose shape is more left-heaVy, and has a longer and thicker tail13. Thus, the individual assets’ default in the collateral pool can be considered as a binomial experiment:each asset results in only two possible outcomes(default, no default). Hence, the probabilities of default of one or more assets in a collateral pool are evaluated using the fbrmula of binomial distribution. Suppose that a collateral portfolio of the CDO$100 million, consisting of l OO assets. For simplicity, it is assumed that individual collateral assets have the same notional value($l million), the common default P,。b・bility(5%),…ec・v・ry・i・the ev・nt・fd・fa・1t・nd th・i・d・fa・lt・ar・i・d・pend・nt14・Alth・ugh・・m・・f these assumptions may be unrealistic, we can grasp how a collateral pool consisting of mezzanine tranches gets transfbrmed into more highly rated securities with the concept of a probability distribution. At maturity, there are only two outcomes that one of the l OO collateral assets may or may not have de一 faulted. The formula of binomial distribution can be used to calculate the probability乃that scenario ノ(∫defaults of the N assets)could hapPen・ 11 Pn general, the risk of loss due to inability or unwillingness by a counterparty to pay on its financial obligations is called credit risk, which leads to a default, Actual credit losses depend on collateral, more precisely, on recoveries by liqui- dating collateral after defaultS. 12 ree BIS[2008】, p.4 and Kothari[2009]、 p.171-172 in more detail about featUres ofCDOs. 13The shape of the binomial distribution is the very essence of tranching of the risk, ln other words, differentiation the risk. 14 cefaults are highly correlated to the business cycle.ri
」き》 .. タ ご. .{「- 「「|. ・「iさ7穿 ミ… … ….. {撒. き」」 .ぐ 1 16、◎0% 14.00% 12.00% 10.00% 8、00% 6.00% 4,00% 2、00% 0.00% Probab釦Uty O.00% ・・i-一…...…・.一...一・・. 18.00% ’ム』... .. Rating Methodology in Struc如red Finance Figure 8:Binomial Distribution ……….…㎝m脚….……’…….’…….………….”“””wwt………ぺ… “tny’pm’pt’t’ny…… “P
寸 tt・…一・一一・一一 Equlty Probabi.lity 20、00Ψ・6 18、{}o% 】6.00% iil,OO% .t2.00% 10,00% 8,00% 6.o{}% 4.ooe/0 2.00% 0、00% .1.3・96%05101520253035
L________一一
1・6%. ミ6{%「1.1 0.00% 茎O Il 12.13 14 且5 16 1718.192021 No. ofAsset8 in I)efa Ult40 45 50 55 60 65 70 75 80 85 90 95 100
No. of a88et8 in default…
F‘,ブ ミ、 ド )〆 ”{ ← 、 〕F’ F 」-畳. 菜(〃. 、-《、..」 ∈ { … 萎「 ’ … =… 了{」 ∠… … … ー ー …ξ 1ρF.、 O「・ {「《 |___m一
Source:Author’s compilationひ一
kヴ〕〆(1-P)n-・=ノ!(畏ノ)!〆(1-P)”一・
where p represents the weighted average probability of default of the pool. Under this fbrmula, de faults among individual assets in the pool must be independent. Figure 8 shows the binomial distribution fbr the pool in question. Given 5%of the probability of default of each asset, there is a very small probability(0.59%)of none of the assets defaulting. The probabilities rise up fbr one, two, and three assets defaulting. For example, the probabilities ofone, three, and five assets in default are 3.12%,13.96%, and 18%, respectively、 Beyond a certain default leve1(i.e., five assets), the probabilities dwindle, until the curves merges with the X-axis. There is only a O.Ol%probability of having aloss of 15assets. The meaning of the tranching is differential risks. Assume, fbr this example, that we create the three tranches ofthe credit risk in the pool of the CDO of$100 million as summarized in Table 2. The loss se- quence is followed from equity to senior. The point at which losses will attach to a particular tranche is called the attachment point. In this case, the unrated equity tranche bears the first$3 million of losses(Le.,Table 2:Tranching of the Credit Risk ofAHypothetical CDO
Tranche
Attachment . @ POInts Detachment ・ @ polntsNotional
`mount
Expected .@ratmg
Equity
0%
3% 3 Not ratedMezzanine
3%10%
7A
Senior
10%
100%
90
Aaa
Entire portR)lio100milhon
A
up to 3%of the notional amount)attached to it. Once the losses exceed 3%, they will be detached from the equity tranche and get attached to the mezzanine tranche. The single A-rated mezzanine tranche bears the next$7 million of losses, and the Aaa-rated senior tranche bears any losses above$10million. The mezza- nine tranche has the benefit of subordination of the equity tranche, which has a totat credit support of 3%. C・nversely,・eq・・nce・f th・P・yment・w・t・・f・ll・f・ll・w・fr・m・eni・・t・・q・ityl5・Th・・ugh t・an・hi・g・f th・ credit risk of a hypothetical CDO, the Aaa-rated senior CDO tranche has been created form the collateral portfoiio with a speculative grade default rate16. Typically, different investors buy each of these tranches corresponding to the risk-return profile they need. Tranching ofcredit risks is the essence of SF products.V. Moody’s BET model
The performance of SF products depend not only on the level of credit risk underlying the collateral pool in the asset side, but also on multiple dimensions of credit-tranched structures in the liability side(Figure 9), Consequently, the process of SF rating can be divided into two steps:(1)assessing the credit risk in the un- derlying collateral poo1(credit risk modeling), and(2)evaluating the distribution of cash flows from the pool to different tranches of note holders(structural analysis). All three major rating agencies(i.e., Moody’s, Standard&Poor’s and Fitch)follow a two-step approach for SF products. This article focuses on Moody’s rating methodology. The purpose ofMoody’s ratings ofCDOs is to assess and classify the expected credit loss of CDO tranches by their final maturity. The method of Moody’s ratings of CDOs is ultimately based on the expected loss 、。ncept.t・d・t・・mi・・th・am・・nt・f・・edit・i・k p・e・ent i・the c・11・t・・al・P・・1|7. Th・Bi・・mi・I E・pan・i・n ts The payments waterfall is the manner of allocation and appropriation ofthe cash flows ofthe SPV, in a certain order of priorities. See Kathari【2009], p.461. 16 `ctually, to protect the CDO tranches issued from the payments shortfalls in cash flows from the collateral pool, various types of credit enhancement, in addition to subordination, are used:excess servicing, residual tranching, over-collateralization, and monocline insurance。 See IMF【20071, p.8.in more details about credit enhancement. t7 The rating agencies do not agree about what exactly is assessed. Fitch and S&P evaluate an obligor’s overall capacityRating Methodology in Structured Finance Figure 9:Key Market Participants and Their Roles
匿羅琵懸≡麗甕醗璽灘≡醗覇羅難羅灘
issue ratings based on credit risk and deal structureAsset
manage「
Arranger
funds
funds
claims
claims
SPV
A鱒et8
Financial
guarantor
iSSues articular tranches Iliabditi8sfunds
tranches
Originator
collectsand makes
payments
Servicer
monltors
complianceTrustee
Senior
Mezzanine
Equity
Investors
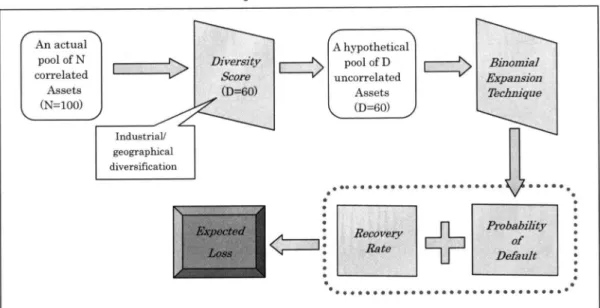
So山℃e:BIS[2005Bl,p,6, Technique(BET)model is Moody’s core methodology for estimating the expected losses ofCDO tranchesi8. In credit risk modeling, three factors drive the loss distribution ofany portfolio:(1)probabilities of default (PDs)of individual obligors in the pool,(2)losses given default(LGD), and(3)default correlations among assets in the collateral pool. In the BET model, these factors correspond to three key parameters:default probability, recovery rate, and diversity score. The expected loss is defined as the product of de fault prob- ability and loss severity given default. Loss severity depends on the recovery value and time of recovely. Recovery rate is a parameter of loss severity given default. The diversity score is the number of uncorre- 1ated assets in a hypothetical pool with the same loss distribution in the actual collateral pool inc]uding cor- related assets. Generally speaking, the actual pool ofcollateral assets ofCDOs consists of heterogeneous assets with cor- related default behavior. To solve this problem, the BET approach introduces the concept of Diversity Score (DS), which is created to map the actual portf()lio of correlated assets into a hypothetical portfblio of D num- ber of uncorrelated, homogeneous assets with the same loss distribution(i.e., identical default probabilities and equal par values)in the collateral pooL In the BET model, the actual pool of N collateral assets(typi- cally a pool ofheterogeneous assets with correlated default probabilities)is reduced to a homogenous poo[of to meet its financial obligation, which is best through estimating its default probability. See Ashcraft and Schuermann [2008],p.37. ts @See CifUentes and O℃omor[19961.Figure 10:The BET Model An actual pool of N correlated Assets (N=100) Indu8tria1/ geographical diversification
嘘㌢⊂⇒
Φ=60)Ahypothetical
。認:認。d⇒
Assets (D=60) ●●●◆●■●舎●..●・.●・●●● … : Rlacbptatア◇皿: 批
… °・..・・.・.●・窃 ●.十
. ・ . … o 命 ■ ■ ● ● ● ● ● ● ■ ■ ● ・ @・・.・..…●舎・ Source:Author’s compilation. Dassets with uncorrelated default probabilities in the hypothetical portfblio via the Diversity Score(Figure 10). The Diversity Score is a measure to estimate the portfolio’s diversification in the context ofa collateralized d,bt。blig・ti・・(CDO), whi・h t・k・・i・t・acc・unt the ext・nt・・whi・h・p・rtf・li・i・diversifi・d by i・d・・try19・ It is based on the assumption that assets in the same industry are positively correlated but otherwise assets are uncorrelated. Industry groups are classified into 33 industries. Technically, under the assumption that the size of every obligation is the same, the diversity score is calculated as follows. In the portfolio, the first obligation included in an industry is given l point. When the portfolio includes second and third obligations in the same industry, the diversity score is increased by half a point for each obligation. As the number of obligations assigned to the same industry increases, one-third a point is assigned for each obligation from numbers 4 through 6, and one-fourth a point for each obligation fヤom numbers 7 through 10. The diversity score is summarized in table 3. For example, if a portfolio consists of ten assets belonging to ten different industries, the diversity score is ten while the diversity score of a portfolio consisting of ten assets belonging to the same industry is f()ur. This means that the ten correlated assets have the same loss distribution as fbur uncorrelated assets. 19 Pn 2000, Moody’s started to use an alternative diversity score(ADS)instead ofthe original diversity score(DS)to ABS CDOs. The score is derived by matching the first two moments(i.e., the mean and standard deviation)of loss distribu- tions associated with the actual collateral pool and the hypothetical homogeneous portfblio used under the BET. See Fender and Kiff【2004], p.4. and http:〃www.investopedia.com/terms/d/diversityscore.aspRating Methodology in Structured Finance Table 3:Diversity Score Table No. ofobligation 奄氏@same industry/region @ X Diversity Score @ (industly) @ G{x Diversity Score iLatin America) 1 1.00 1.00 2
150
1.25 3 2.00 1.504
2.30 1.65 5 2.70L80
6
3.00 2.00 7 3.25 2.13 8 3.50 2.259
3.75 2.3810
4.00 2.50 In emerging market CDOs, Moody’s takes into account geographic diversification by treating each geo- graphic region as an industry, and ignoring industrial diversification within a region20. Moody’s identifies five geographic regions:Latin America(including Dominican Republic), the Caribbean(excluding Domini- can Republic), Eastem Europe, Asia, and Africa&the Middle East. For example, the Latin America diver- sity score is calculated from the following equation2i:LADS=1+(DS-1)×0.5
A pool ofsix EM bonds has a diversity score of two whereas with the same number of US high yield bOnds the diversity score is three. For example, ifaportfblio of l OO assets has a diversity score of 60, this means that the actual portfblio of lOO correlated assets has the same loss distribution as a hypothetical po rt f()1io of 60 uncorrelated assets. Since the default event of each asset is uncorrelated, the probability of/defaults in the collateral pool simply follows binomial distribution:P・一
k7〕PD・(1-PD)D-・=ノ!(畏ノ)!PD・(1-PD)D-・
where D is diversity score and PD is probability of default for each asset. Moodヅs ratings of CDOs are ultimately based on the concept of expected loss, which is a fUnction of the P「°bability°f d・fa・it・・d th・・ev・・ity・f th・d・fa・lt・L・t L、 b・th・1・ss und・・d・fa・lt・cen・・i・ノ・th・t 20 lore recently, Moddy’s has developed methods to mix geographic and industry diversification, as well as a complex, rule-based approach to computing the diversity score of pools of asset backed securities inc}uding CDOs. I am indebted to Professor Robb’s class note ofAdvanced Structured Credit,2008, SIPA, Columbia University, fbr help with this point. 21 oicone[2002], P.29.i・・∫d・fa・lt・・R, d・n・…th・p・・b・bility・f・cena・i・ノ・ccurri・g・Th・n・the expected l°ss(EL)・c°nside「’ ing all possible default scenarios, is computed as follows: D
EL一Σ乃L、.
∫=0 1c.919.)1ugyStd In order to demonstrate how the BET model is used, consider a hypothetical CDO exp[ained in Cifuentes and O℃onnor[1996]. The CDO has the simple two-tier structure summarized in Table 4. The collateral pool of assets has a diversity score of 20, an average probability default of 25%, a recovery rate of 30%・ 6-years maturity, and pays an average coupon of l l%. Senior note and equity receive a coupon of 6%and 12%per year, respectively. The excess cash flow is reinvested at 11%per year. The senior note has prior- ity to receive the cash flows on a semiannual basis from the collateral pooL The defaults are front-loaded; 50%occur at the end of the first year and the remaining 50%are equally distributed l O%at the end of each year fbr the five subsequent years. There are three steps to evaluate the expected loss ofa CDO note: (1)Calculate the probability ofeach level ofloss ofthe coliateral assets (2)Estimate the loss of the CDO note fbr each level of asset loss (3)Evaluate the expected loss by the product of default probability from step(1)and the loss severity given default from step(2). The resulting default scenarios and their corresponding losses of the senior note are summarized in Table 52:. The expected loss of the senior note is O.06744%, which is calculated as weighted averaged losses across all 21 scenarios: 21EJL一ΣちL、-O・31712°/・×0・00%+2・ll414%×0・00%+…+0・00%・45・16288%-0・06744%・
.ノ’=O The rating of the CDO is derived by matching the expected loss of the CDO to that of an appropriate benchmark bond with the same duration. The expected loss that hits the CDO capital structure is mapped ・g・i・・tth・M・・dy・・ldealized・C・m・1・ti・・E・pect・d L・ss R・t・・T・ble2「’. E・pect・d l・ss t・・g・ts sh・wn・i・ Table 6 have extracted the loss rates for ratings of Aaa 一 A3 with average maturity of 6 years from Moody’s 2三@Calculations in detail are prescnted in Appendix. 23 loody’s idealized loss rates were based on Moody’s historical corporate de fauit rates and were determined ill the late 1980s, in which a historical recovery rate fbr all ratings and tenors was 45%. While the Moody寸s Idealized Cumulalive Expected Loss Table is used fbr both corporate asscts and structured f]nallce assets・their default rate and recovery rate assumptions are different. See Ilu l2007】, pp.56-57.Rating Methodo】ogy in Structured Finance Table 4 Two-tier CDO Structure
Assets
$100
Diversity Score=20
Coupon rate=11%
Prob. of default=25%
Recovery rate=30%
Maturity=6years
$80(Senior Note)
Coupon rate=6%
$20(Equity)
Coupon rate
Table 5:Summary of BET estimates No. ofcefaults
Scenario Prob_@abili %
Lossrenior Note%
■ sail Risk(%) 0A一参一≡一一一←一一一0.31712
0.00000
99.68288
一一一一戸一一A-一一一一一一一一一一一〔 一一一一一一一≡一一一一一一一,,●一一一 一一一一一一一一一一一一←〔_一一_ 12.ll414
0.00000
97.56874
≡’一●一一一一一一一一2
一姪一一←’〔←一一一一甲,一=一一’一一 一一一一.一≡一一一一一,,--一一≡≡一 一一一一一一一一≡≡≡一A-一一一一6.69478
0.00000
90.87396
≡≡一コー一一一一一甲一 一≡ラー一一一一一一一一,一一■一台_一一 一,一■一一一一一一一一一一一一一≡一一一 一一一一一-≡一“一一一一一一一一一 313.38956
0.00000
77.48440
⊥ラー一一一一一一一=≡ ≡’一一一一一一一一一’A⇔≡一←一一一一 甲一←一一一一一一一一一A婿≡一一一一一一 一一一,一一一■香一一一一一一一一一4
18.96855
0.00000
58.51585
一一一一一一一一一,一■づ_一一一一一一一__一_一A-一一_一一一 一一一.一一一一一一}一一一一≡一一一一一 一一一,一≡一会香一一一一一一一一一 520.23312
0.00000
38.28273
一一一一一一一一←一≡一 一一一一一一一一P一鍾参㌻一s-一一一一一 一≡一一一一一一一一一≡一=一一一一一一一 一一一一一一≡一’一一一一一一一一一6
16.86093
0.00000
21.42181
一一一一一一一一一一〔一7 一一一一一一一一一一一一一’一一一一一一一 一一一一一 一一←←一一一一一一工←_一 一一一≡-一一一A-一←一一一一一一ll.24062
0.00000
10.18119
一一一⌒一一一,≡≡一←8 一一一一一一一一≡,一≡一一一一一一一一一 ≡≡一一一一一一一一一一一一■≡一会一一一 一一,-一一一一A-一一一一一一一一6.08867
0.00000
4.09252
一一一一一一,,姪一一一 一一一一一A-一一一≡“一一一一一一一一一 ≡ 一 一 一 一 一 一 一 一 , 一 , ● ● 一 ■ 香 一 一 一 一 一一,一一≡.一一一一一一一一一一一9
2.70608
0.00000
1.38644
一A-一一一一←一輪←一 一一一一一}一A“一一一一A-一一一一一一 “←一一一一一一一,一一一≡≡一一一_一一 一一,一≡一一←一一A-一一一一A参
10
0.99223
3.10265
0.39421
一一一一一A-一一一一一 一一一一一一一一一≡-w・香←一一一一一一一 〔一一一一一一一一一合≡≡≡一一一一一一一 一一一一一一’←一一一一一一一←一, ll030068
7.89584
0.09354
一’一一一一一暢一一一一 一一一一P,一一≡一一一“一’一一一一一一 ←一一一一一一一一≡一一≡≡←一一一一一_ 一一一一一一一’一一一一一一一一一一12
0.07517
12.68903
0.01837
“’一一一一一一一一←一 一一一一一一一一一≡≡←←一←←一一一一≡ 一一一一一一一一一一一 一一一≡≡一一一一一一一一一一一一一13
0.01542
17.48221
0.00295
一一一一一一一一≡≡一一 一一一一一一’一一一一一一百百〔一一一一一←一一一一一_一一一
一一一一一一’一一←一一一一一一一一14
0.00257
22.27540
0.00038
←一一一一一一A-一≡一 一一一一,甲一一一一≡≡一一一一一一一一≡ 百一一一一一一一一■一一一÷一’←一一一一 一≡≡≡一一一⇒一一一一一一一一,一15
0.00034
27.06859
0.00004
一一一一一一’姪≡一一≡鴫一一¶一一一一≡一一一一’一一一一__一一 ≡一一一一一一≡一一≡一一一一一一一一一一 一≡一’一一一一一一一一一一,一一一16
0.00004
31.56209
0.00000
一F-一一一一一≡≡一← 一一一一≡≡≡一’婿一一一一一一}一,一一 一一一一一一一≡’〔←←一一一一一一一一一 一一一一一一}一AA-一一一≡≡一一17
0.00000
34.78187
0.00000
一“≡≡一≡一一一一一一 ≡一一一一←一’一一一一’A甲一一≡一一一 一一一一-≡一一一一一一一=一一一一≡一一 一一一一一一≡一≡一一一一一←一一一18
0.00000
38.05309
0.00000
一一一一一一一一,一一≡ 一←一一一一一A-一一一一一一一一一一一一 一一一≡一一一一一一一≡輪’一〔一一一一一 一一一一一一一一一一一一一一一一一,19
0.00000
41.60799
0.00000
参・=一一一一一’一一一 一一一≡≡≡≡一A-一一一一一一一一一一一 ’一一一-一■←一一一一一一一一一一一一■ 一←一一一一一一一一≡一一一一’”20
0.00000
45.16288
0.00000
Expected loss
0.06744
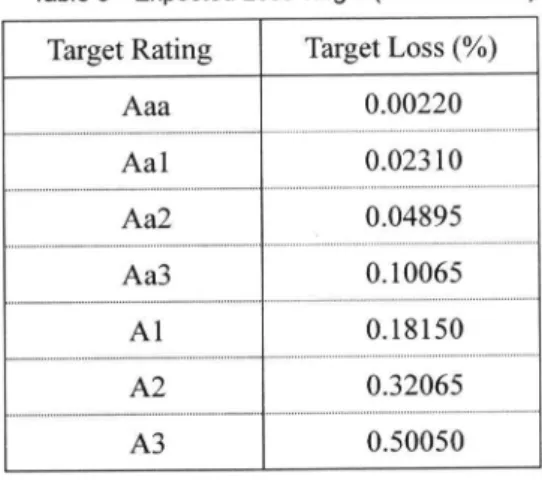
Note:*Tail risk is calculated as(1 一 cumulative default probability). Source:Author’s calculation.Table 6:Expected Loss Ta rg et(6-Year Period)
Target Rating
Target Loss(%)Aaa
0.00220 11111111・.....1「「...,F ,.F.r門.■■■■■■■■■■■■■■■rrr・9999層.層■......,PL.…....,P「,「「「「・@ Aal
FFFFFFFFF.FFFFFF.FFF @ O.02310 「 ......,,,,,r,,,7rr■7r■・rr,・「「・9,.層F..LL「「..-...--幽.幽...P..P,,,,「,「「「@ Aa2
.1...」....LF1」」■■■■■■■■■■1■..r,.「1F...」」」LF..」.....F.FF. @ 0.04895 ■■■■闘,■.「..」L..1..「「「「「F.FLLF.」.... ・..-............PP.P.,.,7■●●●■,r,,,,「「層層.「F・......-.....P,「@ Aa3
F1.FFFF. @ 0.10065 .11.11111. ....,..・・…..・9.......【LrL■■■■■■■■●・■n........,P,,777「「.・.L「..…9n9囲..@ A1
..L.1111.LF...L....」...-F.,,.FFF @ O.18150 ■■■■■■11■1,r1■「F.L」.........「.幽..「「FFFFFF..... .・.層.....P...P,,.77r●r7■」,,P,P,P「99層「層「層層7.L....・・.・・......,.,・@ A2
,F......F @ O.32065 .F...,FFllFF ....rr・r…-・99層........,.7777■■■7●■■■-.〆9.......P.P門7層7・L..「・・.......・〆・...@ A3
...闘闘11.111FF...」FL...・F.幽.幽....層1層1@ 050050
Source:CifUentes&0℃onnor[1996】, p.4. Figure 11:Comparison of EL of the Senior Note to EL Hurdle◎f the Benchmark Bond ア -コ-Ht--Nt thV ロコぽ ttSトへ コ ’へdi-uーざ -nり tV「ぽ - げ - り ヤ’ un tF’t’tttt”t ロロ-t iELH。。dl。R。、。(。) i35’・・.・・.・・.・.・. ・.・・.....・...・.一............ 垂 弓弓 .‘. ’き ・畜- 30.00 25.00 20.00 15.00 10.00 ・’・.H.∀.~.L1げ‘w.1^’w’nv-tPt.一.〔L÷“’馳w’….}.w←}鼎’w’鼎wth-一甲.→.一☆^w.’um-一一Htza-「W’w’酬’一’ew「“’〔〔…Lw←」〔L-L i . . L. ’ . . .. . .. . . . . .. .. . . . t …i
・▲..・一・…・・’t・一・ … … ミ ・葦.… .・..・「.∨. @ @ @ @ @ @ @{ @ @ @ @ @ @ @… @ @ @ @ @ @ @}←
“ @ @ @ @ @ g @ @ @ @ @ v W ( @ @ @ @ @ c @ @ @ @ @ー
▲ ii﹂ー∼トi°°︾°°︿$]さ︷、︽F⋮‘・ト︷ % 0.20 O.15 0.IO 0.05 0.00 …i・・i.・.一』・.一……1 十Hur《Ue Rate(6 year) w}-EL ofSenior Note 」..1F..×.ゴ..馳ヒ.Lヒ.1.馳.L..1「..甲....馳〉.Lヒ....W11「.. @ 「 ...L..A’.、A n.10 @ 「†…
「,」」L門’〈」
@ 0.06744 ・ . . ∩Fへ、「 FP ・ ・ ’. r .ρA「.∨ 「.← ぬ. w.一 F.-.’
0.0δ 0.06744 .〔. ・F’.@ .’¥. 噛 .^「 P馳・ 噛 ’LY「 .F^L「^、「〔.‥T.〔 馳1「1..^ 「^噛^噛1、L. @ < ∨.一...“w‘〔.mL.〔1。L「…「‘ 〔’.’噛...Aaa
Aa1
A.a 2国
Al
5.001雛彊雛雀:鎧鑛晶:蕊鑛撫讐:繋;磯il}:1懸1墓{豆㌢lill
B3 i Caa ; 一.…一..・..・狽煤E・@. .i 響}:O i..2i『・6 i ⊇r-き. ’< 」そ 」づ .ヤ ’毛、 ミ さ ’」 ’.ー へ》「さ へ〉 } 撒 i. ξ、」. 撒「「 馳 /馳ミ ー 」 .‘ 「) Σ ; 》.,. - 《{}.- {〜〉 、きート 〜 … {, .., i 「〔 〕 ‘ .$. 是 Source:Author’s compilation。 Cumulative Expected Loss Rates Table. For example, fヤom a collateral with average maturity of 6 years, the maximum amount of cumulative expected loss f()r a Aaa senior note with the same matUrity must not be greater than O.0022%(i.e., the expected loss hurdle rate). According to Table 5, the senior note with the expected loss of O.06744%most closely resembles an Aa2- rated benc㎞ark, which has a hurdle rate of O.04895%. However, the expected loss is greater than the Aa2 hurdle rate. The senior note would be rated Aa3, whose hurdle rate is O.10065%(Figure l 1).Rating Methodology in Structured Finance As mentioned above, Moody’s general rating approach to CDOs is based on the evaluation of expected loss fテamework. The core methodology is the BET method. However, the traditional BET model was modified and various approaches have been introduced corresponding to innovations in the SF markets. For example, the variant of the BET such as the double binomial method(Cifuentes and Wilcox[1998]24), the lognormal approach(Mazataud and Yomtov[2000]), the structu±ed note methodology(Sun and Araya [2004]) for evaluating CDO repacks(i.e., ABS CDOs)are introduced. In August 2004, Moody’s introduced a new modeling approach, the Correlated Binomial Method(the CBM)25. The CBM is an extension of the BET method. The share of RMBS in the collateral of the SF CDOs has sharply increased since 2003. The highly concentrated collateral pool on a single asset sector raises the default correlation among collateral assets, which leads to a fat-tailed loss distribution, i.e. larger probability associated with high multiple de- faults scenarios. The purpose of the CBM is to capture this fat-tail effect more accurately.
Vl. Concluding Remarks
Financial innovation can often produce unexpected results. During the Iast decade, we have seen a rapid expansion in the range of SF products fbr which credit ratings have been assigned. This article has traced the evolution of the SF markets and has described characteristics of SF products. To estimate and manage complex risks involved in these products, it is inevitable that advanced financial engineering skills develop. The SF markets have been growing in parallel with the reliance on sophisticated quantitative modeling. Moody’s has been one of the leaders in rating SF products. The heart of its SF rating methodology is to review the potential loss distribution of a specific collateral pool and assess the sufflciency of the credit en- hancement that supports the promised cash flows from the poo1. Among Moody’s rating models of SF products, the core methodology is the BET method. This article has shown how to determine the rating of a CDO tranche underlying a hypothetical collateral pool through the BET approach. Generally speaking, in terms of valuation methodology, the quantitative methods used are closely related to the liquidity spectrum of financial instruments involved. The SF markets are choppy or icy markets that are less deep and less liquid. The products are tailored, pricing is mark-to model, and risk calculations are mainly loss modeling. Marked-to-model is the process of valuing a product based on mathematical models rather than market prices. Tb a greater of lesser extent, model risk is a problem that any quantitative model 241t was used to the case of a collateral pool consisting oftwo highly uncorrelated groups of assets, in which each group is a[ow diversity collateral pool(e.g., a pool consisting of emerging market assets and U.S. high-yield bonds). 25 Pn the CBM, the parameter of default correlations among assets in the collateral pool is modified from diversity score in the BET model to the number ofrepresentative assets and Moody’s asset correlation. See Xie and Witt【20051.、㎝。。t、v。id. M。d,1,i、k i・th・・i・k・fp・t・・ti・l err・r rel・ti・g t・th・u・e・fm・d・126. Alth・・gh m・d・1・i・k can arise廿om many different sources, we fc)cus on incorrect model speciflcation related to pricing the CDO tranches. This can manifest itself in many ways:missing risk factors, incorrect assumptions, misspecified relationships, ignoring ofmarket, crisis and liquidity factors27. As discussed in Section 3, SF products such as ABS CDOs are complex instruments since they are created by two layer securitizations. Asmall amount of uncertainty about expected losses of subprime mortgage loans causes a large amount of uncertainty on valuations.of ABS CDO tranches. In the middle of 2007, when the quality of ABS CDOs came into question, the market f()r CDO tranches became illiquid. Al- though market risk are complex and multidimensiona1, estimates of it are inevitably su句ect both to liquidity risk and model risk. Moody’s rating models are marked-to-model, in which valuing CDOs are based on a mathematical models rather than market prices. They do not take account of any potential loss ofthe mar- ket value(Le., market risk)of CDO tranches. As the market becomes iUiquid, marked-to-model risk emerges28. The actual value ofthe CDO is not realizable as predicted by the modeL Another important model risk can arise from correlation risk. Correlation assumptions are a critical component of the CDO rating models. One of the main reasons why a CDO can normally offer tranches with a wide range of risks from Aaa to Caa伽m the collateral pool with the low level ofcredit quahty comes 廿om the assumption of imperfect default correlation ofcollateral assets. The assumption about correlated risk among collateral assets in portfblio is a key in rating CDOs. Risk shift that has occurred in the process of re-securitization is closely related to the correlation assumptions in the models. The concept of correla- tion is statistically the average comovement of two assets over time. For senior CDO tranches, the worst-case comovement(Le., downside correlation)is more crucial for evaluating their performances because they only incur losses when the losses on the collateral pool are huge. It is di伍cult to incorporate the dif二 ference between average and worst-case correlation into rating models. In addition, fbr ABS CDOs, there is li廿le empi・i・al d・t・・fd・fa・lt・・π・1・ti・n d・・t・・el・ti・・ly・h・曲i・t・ry・fth・・ubp・im・RMBS29・ Rating of SF products relies heavily on a fbrecast of economic conditions since the key parameter of the rating model is default probability. In assigning subprime RMBS ratings, uncertainty about the loss level of subprime mortgage pool is detemined by changes in economic conditions such as the housing cycle and the 261n the context ofrating SF products, there are two principal components]the quantitative models the rating agency use to estimate credit risk of the collateral, and deaLspecific, structural model risk such as the arrangeピs proprietary struc- turing techniques and deal structure. See BIS[2008], pp.17-18. 27See Dowd[2005], p.16-17, and pp.353-356, in more detail about model risk. 28Banks and Dunn[2003]defined marked-to-model risk as the risk of loss if the actual value of the product or transaction is no realizable predicted by the mode1. 29 BIS[2008】, p.17-18.
Rating Methodology in Structured Finance unemployment rate. For example, a fall in the unemptoyment rate and a rise in home prices improve the ability of a borrower to avoid default and improves the recovery rate in the event of de fauit, and vice versa. Apro-cyclical rating in which upgrades concentrate during a housing boom and downgrades concentrate during a housing bust tends to amplify the housing cycle through encouraging credit and asset price bubbles on the upside and accelerating to severe credit crunches on the down side. When markets become less liq- uid, pricing of SF products should, to some extent, shifi to judgemental methods伽m mark-to-model valua- tion, and to control their risk more attention has to be paid more to issues ofliquidity and unrealized Iosses. It is important to note that, with regard to investments in CDO tranches, identical credit ratings do not im- ply identical risk characteristics(Le. severity)because extemal ratings tend to fbcus on expected losses or expected outcomes such as probability default, which may not provide a comprehensive measure of the risk associated with a CDO tranche. Consequently, the market pricing of investments in CDO tranches with similar extemal ratings can involve substantial differences in the associated yields. BIS[2005A]argues that investors in SF products should seek to develop a sound understanding ofthe credit risks involved and not to rely solely on rating agency assessments.