South East Asian Studies,Vol. 15, No.1, June 1977
Growth Accounting or the Philippines:
The DelDand-ror-Output Side
Mitsuo EZAKI*
I
Introduction
The first and main account in national income statistics (NIS) is the gross national product and expenditure account which gives GNP estimates from both factor income and expenditures. Itis a framework for the national economy to account for level of output (i.e., value added) from both sides of inputs (i.e., factor income) and demands (i.e., expenditures). This means that growth of output(s) also can be accounted for from both sides: growth of inputs and growth of demands. In other words, there can be, for the national economy, an accounting framework in terms of growth rates which may be called growth accounting (in the broad sense).
The growth accounting from the input side based on national income statistics (i.e., NIS basis) is well-established in relation to the concept of production function and identical with the measurement of total factor productivity. In the previous paper (Ezaki [1976]), the author has presented a framework for growth accounting from the input side based on the input-output (10) tables (i.e., 10 basis) and provided a measurement on the Philippine economy comparing the 1965 and 1969 input-output tables (i.e., measurement of the 10 basis) as well as using the NIS data (i.e., measurement of the NIS basis). In this paper, we will discuss the growth accounting from the demand side under the 10 framework and provide a corresponding measurement on the Philippine economy using mainly the 1965 and 1969 input-output tables.!) A measurement of the NIS basis will also be provided for comparative purposes.
Section II deals with methodology. Section IIIprovides measurement on the Philippine economy.
II
Growth Accounting from the Demand Side - Methodology
There may exist several alternative approaches to the growth accounting from the demand side, because we have no dominant theoretical basis for the demand side such as
*
iIJ1ffij:Jlt~, The Center for Southeast Asian Studies, Kyoto University.1) The 1961 input-output table will not be used in principle, because it is said that the table contains a mis-leading data compilation for the capital formation. (In other words, it is said that the data on investments in each industry are compiled there instead of the data on output of each industry delivered to capital formation.)
production function for the input side. Here we try to combine the analysis of import substitution (Chenery [1960]) and the constant-market-shares (eMS) analysis of exports (e.g., Richardson [1971]) consistently from the point of view of the latter.2) We divide total market for domestic outputs into two parts: domestic market and world market, and de-compose growth of domestic outputs into two effects: (i) proportional growth effect (P.G.E.) which corresponds to growth of total demands in both markets and (ii) competitive effect
(C.E.) which corresponds to increase in shares in both markets, providing thus an accounting framework for the sources of growth from the demand side.
Let us begin with the CMS analysis applied to world market, which is the ordinary and well-known case. First, let us define Philippine share in world market of commodity i as
where Ei=Philippine exports of commodity i, and Wi=worlcl imports of commodity t.
Then, differentiating with respect to time (denoted by dot (.) ), we get
from which we can see that increase in (or growth of) exports is caused by the two effects: increase in (or growth of) world imports with no change in market share, and increase in (or growth of) market share with no change in world imports. The former is, of course, proportional growth effect (P.G.E.) while the latter is competitive effect (C.E.) which may also be called share effect.
There have been not a few criticisms on this CMS analysis for exports.3) Yet, we can
raise an important criticism which has been hitherto overlooked. That is to say, the world imports(Wi) may not be an appropriate measure to indicate the size of world market so that the increase in market share (fJi) may not reflect competitive power in the proper manner. Take the U.S. market as an example. In the case of light industry products, the Philippines must compete in the U.S. market not only with other developing countries but also with the U.S. itself. In the case of automobiles, Toyota (Japanese automobile industry) must increase its share in the U.S. market competing not only with Folkswagen (German automobile industry) but also with Ford (U.S. domestic industry). In many cases, therefore, total domestic demands in each country may be better than imports only to be used as a measure for the size of world market.4 )
2) For the analysis of import substitution, see Shionoya [1968, Section IVJ (Japan), Liang and Lee [1974, Section VJ (Taiwan), N arongchai Akrasanee [1975J (Thailand), etc. For the CMS analysis of exports, see Balassa [1971, Chapter 2J (seven developing countries), Naya and Udom Kerdpibule [1973J (Southeast Asia), Liang and Lee [1974, Section VIJ (Taiwan), Naya and Akrasanee [1976J (Thailand), etc.
3) See Richardson [1971J, for example.
4) Total domestic demands include intermediate demands as well as final demands so that, in order to allow for this criticism in the actual measurement, several input-output tables are needed for each importing country in the world. In this paper, we will follow the ordinary eMS analysis of exports due to the limited availability of appropriate 10 tables in the importing countries.
M.EZAKI: Growth Accounting of the Philippines, The Demand-far-Output Side
This criticism suggests that the CMS analysis is applicable also to the domestic market, because Philippine industries are competing with foreign ones in the Philippine domestic market also. In fact, we can derive the Chenery measure of import substitution from the point of view of the CMS analysis. First, note that total domestic demands of the Philippines are matched by both domestic and foreign supplies:
where di=total domestic demands of commodity £, zi=domestic outputs of commodity £
delivered to domestic use, and Mi=Philippine imports of commodity £. Then, we can define Philippine share of commodity £ in Philippine domestic market as
Differentiating with respect to time, we get (5) zi=aj"(ii+di·~i or Zi!Zi=di!di+(zi/ai.
It is needless to say that P.G.E. and C.E. in the domestic market are identified with the first and the second terms respectively in the righthand side of each equation above. The C.E. here is identical with the measure of import substitution proposed by Chenery [1961, pp. 639-644].
As to the Chenery's measure of import substitution, Morley and Smith [1970J raised a criticism, and proposed a modified measure which explicitly allows for the interdependency between industries in the analysis of import substitution. It seems, however, to the author that their modified measure is not superior to the original one (see Appendix of this paper), so that we do not employ their analytical method and framework here.
Our next task, then, is to combine consistently both of the foreign and the domestic markets discussed above. It is clear for this purpose that the 10 framework is better than the NIS framework since the latter describes the relationship between value added and final expenditures only, neglecting in a sense the intermediate demands and supplies.5 ) Under the 10 framework, we get the following basic identities for each industry:
(6) )'i+Mi=di+Ei
(7) Zi=)'i-Ei=di-Mi
(8) )'i=Zi+Ei
where }'i=total output of industry £ (or commodity £).6) Equation (6) shows the ex post
identity between supply and demand in each industry, i.e., total supply from both domestic and foreign sources must be equal to total demand of both domestic and foreign origins. Equation (7) is the definitional identity for the domestically used domestic output (Zi).
5) The same was true for the input side of growth accounting. See Ezaki [1976].
6) Capital letters Y, D and Z will be used for the corresponding variables under the NIS framework.
Here it is assumed that imported commodities are not used directly for exports. From this definition of Zi are derived the two identities: equations (3) and (8).7)
N ow we can derive an identity for the growth of output from equations (8), (2) and (5) :
(9)
---.
ZiZi
+-- ---.----
Ei EiYi Zi Yi E i
which shows that growth of output is decomposed into P.G.E. and
c.E.
in the weighted average sense. This is the basic formula for the growth accounting from the demand side. The formula, however, is expressed in terms of continuous time so that we need a correspond-ing discrete approximation in the actual measurement. The discrete expressions for equations (5) and (2) are:(10) LJZi/Zi=LJd ifd i+LJaifai+(LJdifd i)'(LJaifai)
(11) LJEifEi=LJ Wif Wi+LJfJiffJi+(LJ W ifWi)'(LJfJiffJi)
where LJ means increase between two (i.e., base and succeeding) periods. Note that the third terms appear in addition to P.G.E.'s and C.E.'s in the above identities. They are caused by the changes in both total demands and market shares and called z'nteractz'on effect (I.E.). The discrete expression for the basic formula (9), therefore, consists of three effects in the weighted average sense:
(12) LJ..Jl.i = Zi . LJzi + Ei LJEi
Yi Yi Zi Yi Ei
;ii (LJt+
LJa~i_+~i .-~~~~) +i/-(LJ;i+4t+4~i.
4t
i)=P.G.E.+C.E.+I.E. (in the weighted average sense).
This formula will be applied, in the next section, not only to the seven aggregate sectors (industries) used in the previous paper but also to the disaggregated components industries (though the disaggregation will be made for the manufacturing sector only). It seems, therefore, worthwhile to develop here in general form the relationships between aggregate and disaggregate measures.
Let us consider the world market first. There seems no need of explanation on the following identities for the k-th component industry in the z'-th aggregate sector (industry):
7) In the measurement of Section 3, we estimate firstZiby(Yi-Ei) and thendi by(zi+il1"j). Note that all variables (except for market shares) are measured either at current prices or at constant prices or both, depending on the data availability.
M.EZAKI: Growth Accounting of the Philippines, The Demand-for-Output Side
where ,8ik=Philippine share of commodity k in world market, Eik=Philippine exports of commodity k, and Wik=world imports of commodity k. Then, using
(15) Ei= ~ Eik and Wi= ~ Wik,
k k
we get an identity for the growth of exports in the aggregate industry i:
(16)
which is essentially identical with equation (11). All of the three terms in the right-hand side above are the weighted averages of components P .G.E.'s, C.E.'s and I.E.'s with the export composition as common weights, so that we can interprete them as the measures of pure P.G.E. (denoted by P.G.E. *), pure C.E. (denoted by C.E. *) and pure I.E. (denoted by I.E. *) respectively for the i-th industry. The difference between P.G.E.*, which is based on the disaggregate data, and P.G.E., which is based on the aggregate data, is called commodity
compositional effect(C.C.E), because its sign and magnitude are dependent on the difference
in composition between Philippine exports and world imports as well as on the growth of the latter:8)
(17) C.C.E.=:P.G.E.*-P.G.E.=
~ (~; -~~:) .L1l:~k
where P.G.E.*=~(Eik/Ei)'(L1Wik/Wik) and P.G.E.==L1Wi/Wi. In other words, the stronger is the export concentration on the specific commodities growing fast in world market, the greater will be the magnitude of C.C.E. (and vice versa). Using this concept of C.C.E. and comparing equation (16) with equation (11), we get
(18) C.E. =C.E. *+C.C.E. +(I.E. *-I.E.)
which shows that the competitive effect based on the aggregate data (i.e., C.E.) includes C.C.E. in addition to the pure competitive effect based on the disaggregate data (i.e.. C.E. *).9)
So far was concerned about the world market. As to the domestic market also, we can define commodity compositional effect in the same way as equation (17):
( Zik dik) L1dik
(19) C.C.E.=:P.G.E.*-P.G.E.= ~~--:- -d·~- . ··d·.
k z, , ,k
where Zi= ~ Zik and di== ~ dik. The relationship between C.E. and C.E.* for industry
8) See Richardson [1971], footnote 3, p. 209.
9) (I.E.
*-
I.E.) is the residual under discrete approximation. Itvanishes under continuous time.ican be derived by comparing equation (10) with the counterpart of equation (16), and is the same as equation (18).
III Growth Accounting from the Demand Side - Measurement
In this section, we will provide a growth accounting from the demand side for the Philippine national economy comparing mainly two input-output tables: the 1965 table of National Economic Council (NEC) and the 1969 table of National Economic and Develop-ment Authority (NEDA). For the demand side, we will again aggregate more than fifty industries in the original 10 tables into seven sectors in the same way as for the input side (Ezaki [1976]): (1) Agriculture (Agriculture, Fisheries and Forestry), (2) Mining (Mining and Quarrying), (3) Manufacturing, (4) Construction, (5) Transportation, etc. (Trans-portation, Communication, Warehousing and Storage, and Utilities), (6) Commerce (Trade, Banking, Insurance and Real Estate), and (7) Services (Private and Government Services)'!O) For the manufacturing sector, however, we will show the disaggregate results also based on twenty components industries in order to derive more definite implications on the Philippine industrialization. Furthermore, we will provide here a measurement of the NIS basis using the national income statistics data, though the linkage between NIS and 10 bases for the demand side is neither direct nor clear-cut compared to the case of input side.
Let us begin with the aggregate seven industries, first. Table 1 shows the final results obtained by applying formula (12) to the 10 data (except for T17i) at both current and con-stant prices,!l) As is explained in detail in the Data Appendix of this paper, Wj (world
imports of commodity i) is estimated (or approximated) by the sum of total imports of com-modity i in twenty top trading partners of the Philippines from the point of view of the
Philippine exports such as U.S., Japan, Netherlands, Korea, West Germany, and so on. The share of these twenty countries in total Philippine exports (all commodities) is 98.0% in 1965 and 97.3% in 1969, so that our estimate or approximation of Wi here does not seem to give misleading results. The data source for Wj is UN Yearbook of International Trade
Statistics, in which exports of the Philippine industries are identified, one by one, with
commodities in the world market on the basis of the Standard International Trade Classifi-cation (SITC). However, for the last three sectors of transportation, commerce and services, the corresponding data in world market are not available so that the world imports are assumed to grow at the same rates as the Philippine exports. In Table 1, the results at constant 1967 prices are shown in the second line of each row corresponding to each industry. The basic data for them are obtained by deflation. The deflators forYj andEj are the NIS
10) For the 1969 input-output table, an aggregate 12X12 table is available in theN EDA Stat£stical Yearbook
1976. However, we must be very careful in using it, because this aggregate table contains an erroneous classification of industries for the sectors of transportation, communication and warehousing (9th) and other services (12th).
Table 1 Decomposition of Growth of Outputs (at current and constant prices): 1969/1965 - - - _ . ' - - - -. _ - - - ~.._ - - - ~ ~ -1 2 3 4 5 6 7 8 9 10 11 12 - ' ,. ._ - - - - , - - _..", _ ...._ . _ - - - - _ . _ - - - -2x3+6x7---~- 2x4 2x5 2x4x5 ~ or 4+5+4X5 8+9+8x9 + + + 10+11+12 6x8 6x9 6x8x9 F.lN -~---._--- ---- - - , - - - _.., . , - - - ' ,..._ - - - - _.._ - - - , . , - - - ;..
LJd;fdi LJai/ai LJW;fTVi LJfh/fh ~
Industries LJYi/Yi Z;fYi LJzi/Zi Ei/Yi LJE;fEi P.G.E. CE. I.E.
..
P.G.E. CE. P.G.E. C.E. Q
- - - - -...-_._.._ - - - - _ . _ - - - -..- - - , - -.._ - - - - -- - - _...._-_._---- .., 64.8% 0.6% 0 1. Agriculture 17.5 .836 76.0%25.5 72.0%24.0 2.3%1.2 .164 -22.88.3% 28.429.6% -16.5%-39.8% 65.0%24.7 -0.8%-5.5 -1.6 ~
5->
(") 135.8 225. 7 119.3 48.5 116.8 44.4 50.2 57.4 49.9 28.5 (") 2. Mining 72.0 .174 137. 7 103.0 17.1 . 826 58.2 44.4 9.6 54.6 10.9 6.6 0~ g S" 70.9 74.4 65.8 5.2 40.1 54.4 -9.2 64.6 3.7 2.6 Illl 3. Manufacturing .897 .103 0 50.1 53.3 47.6 3.8 23. 1 42.5 -13.6 47.1 2.0 1.0 ..., 5-CP 4. Construction 50.510.4 1. 000 10.450.5 50.510.4 0.00.0 0.000-
-
-
-
-
10.450.5 0.00.0 0.00.0 "tlg;
-6" '0 5. Transp., etc. 67.5 .891 70. 1 74.0 -2.3 .109 46.3 (46.3) (0.0) 71. 0 -2.0 -1.5 S"CP 43.3 45.5 48.8 (-2.3) 25.2 (25.2) (0.0) 46.2 -2.0 -1.0 ~rn...,
48.1 55.0 0.3 (-25.4) (0.0) 0.3 0.1 ::r 6. Commerce 55.5 -25.4 47. 7 CP 30.5 .909 37.0 36.6 (0.3) .091 -34.3 (-34.3) (0.0) 30.1 0.3 0.1 tj CP S 36.4 50.1 46.4 2.6 -54.2 (-54.2) (0.0) 33.2 2.3 1.0 III 7. Services 8.3 .869 19.2 16.2 (2.6) .131 -63.6 (-62.6) (0.0) 5. 7 2.3 0.4 9-:;l 0-..,:EZi. LJdi_ :EZi. LJai :EEi LJWi :E Ej LJfJj
6
LJy Z :EZi. LJZi Z di Z ai E :EEj.LJEj
----iF
Wi7f'7i
PGE* CE.* I.E.* .g~y y Z Zj Y E Ej . . . g
Total Economya P.G.E.* CE.* P.G.E.* C.E.* Ui
0: CP
58.9% .880 65.4% 61.1% 2.6% . J20 11. 7% 15.1% -3.0% 55.6% 1.9% 1.3% 30.3 .879 36.0 33.4 1.9 .121 -10.6 7.6 -13.9 30.3 -0.0 +0.0
aNotation for total economy: y= :EYi, Z=:EZi, andE= :EEi.
deflators which were used in the previous paper,12) while those for Wi and M iare the price or unit value indexes of world exports of market economies. 13) Again for the last three sectors of transportation, commerce and services, the NIS deflators are used to deflate Wi and Mi
also due to the lack of appropriate data.
Though the table contains some unreliable portions caused by the insufficient data, we can say that, between 1965 and 1969, output in each industry grew almost in proportion to total demands of both domestic and foreign markets, because P.G.E. (column 10) is dominant while C.E. (column 11) is quite small. The exception is the mining industry. Its output growth, which is very large compared to the other industries, receives significant contri-butions from both P.G.E. and C.E. This is mainly due to the rapid increases in production and export of copper during this period (i.e., 255% and 185% respectively in value).14) In the agricultural sector, on the other hand, the competitive effect in the world market (column 9) is not only significant but also negative. The result is also due to a specific reason. In other words, the exports of coconut and copra, whose share in total agricultural exports was almost 50% in 1965, decreased considerably between 1965 and 1969 (i.e., -35.6% in value based on the 10 data), causing a low growth of total agricultural exports and a negative share-increase in world agricultural market. 15) A similar result is obtained for the manu-facturing sector where the import substitution effect (column 5) is moderate and the com-petitive effect in world market (column 9) is even negative. Let us investigate in more detail below the case of manufacturing industry whose performance is closely related to the process of Philippine industrialization.
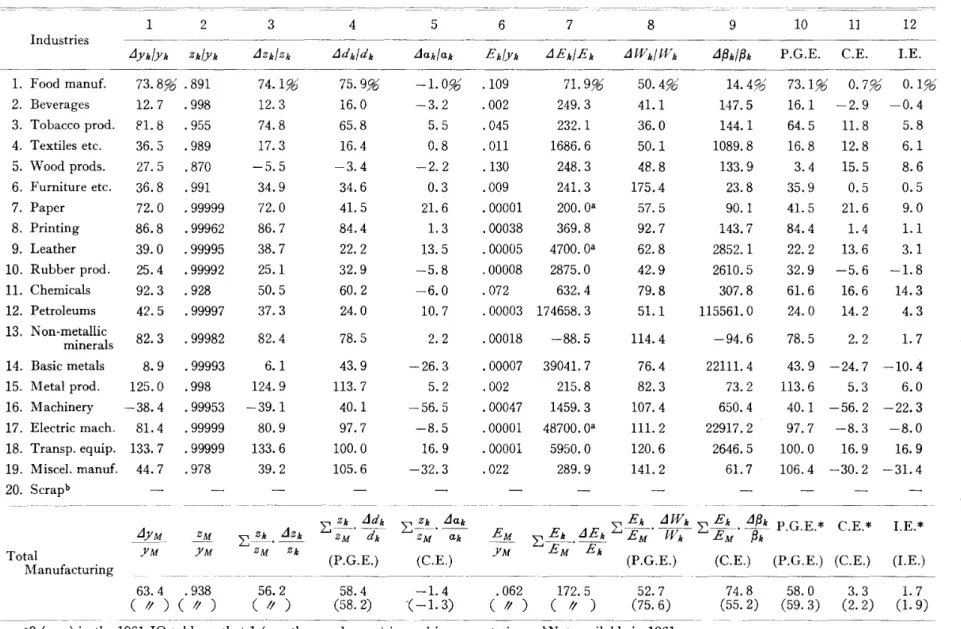
Table 2 shows the disaggregate results for twenty components industries in the manufacturing sector, which are obtained by applying the same formula (12) and expressed only at current prices due to the lack of price data. From the table we can see that, in almost every component industry, P.G.E. (column 10) is dominant while C.E. (column 11) is positive but small. The results on total or average effects (columns 10 and 11) correspond to those on components effects in the domestic market (columns 4 and 5), because the ratio of domestic use to domestic production (column 2) is close to one in many industries (.897 on the average), making the domestic market dominant over the export market. For the domestic market 12) See Table 4 of Ezaki [1976] and the related discussions on the NIS deflators there. The export price
in-dexes should be used to deflateEi if such data are available.
13) See Data Appendix of this paper. The import price indexes of the Philippines should be used to deflate
Mj if such data are available.
14) The value shares of copper production in total metallic production and total mining production are, respectively, 49% and 32% in 1965 while 74% and 54% in 1969. SeePhilz'ppine Yearbook 1975, Tables
XV. 1 and XV. 4 and NEDA Statistical Yearbook 1975, Table 12.6.
15) Precisely speaking, we must allow also for the commodity compositional effect as in the case of manufactur-ing sector discussed below. Balassa [1971, Table 2.6, p. 43] provides the results of eMS analysis for several commodities of the Philippine exports comparing 1950-53 with 1963-66. Judging from our results above, it seems that there occurred in the early 1960's a structural change in the Philippine agri-cultural exports in relation to copra and logs.
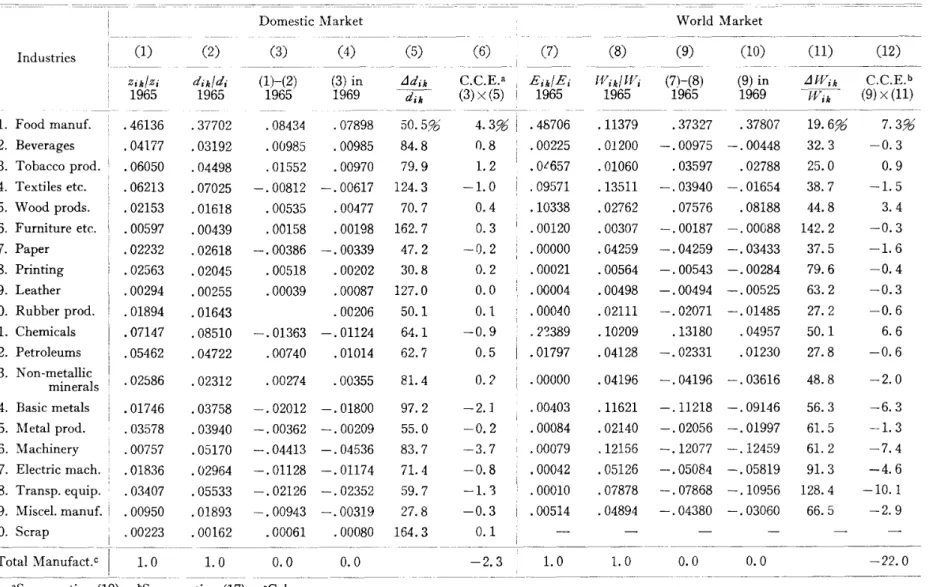
the disaggregate results of Table 2 are quite similar to the aggregate results of Table 1 (which are shown also in the last row of Table 2). That is to say, during the period in question, the effect of import substitution is moderate in most industries except for some of the heavy industries (i.e., basic metals and machineries other than electrical ones),l6) and there exists no big discrepancy between P.G.E.* (63.4%) and P.G.E. (65.8%) or between e.E.* (6.4%) and C.E. (5.2%). For the world market, however, the disaggregate results are conspicuous in that C.E. (column 9) is not only significantly positive but also more important than P.G.E. (column 8) in many cases. l7 ) As a result, the pure competitive effect of total manufacturing sector (C.E. *) is significantly positive (6.0%), explaining 15% of its export growth (40.1 0/0), and there arises a considerable discrepancy between C.E. * (6.0%) and C.E. (-9.2%). As can be seen from equation (18), this discrepancy is caused mainly by the commodity com-positional effect (e.c.E.) for which a large negative value (-22.10/0) is obtained here ac-cording to equation (17).
Then, what is the reason why such a large negative value is observed for the c.e.E. of world market? The answer can be found in Table 3 which shows the breakdown of C.C.E.'s in the manufacturing sector for the world market as well as for the domestic market. A notable fact on the world market is that the Philippine exports concentrate heavily on the products of food manufacturing industry (column (7) to be compared with column (8», while the growth of world demand for the manufactured food is lowest among the products of nineteen industries under consideration (column (11». Therefore, the positive con-tribution to e.C.E. of food manufacturing industry (7.3%' column (12» is small relative to its large compositional gaps between Philippine exports and world imports (.37327, column (9». The same may be true, though to a lesser extent, for the exports of chemical industry whose major component is coconut oil. lS) As a result of this heavy concentration of exports on food manufacturing (and probably on chemicals), the commodity compositional gaps in other industries become negative and large (column (9) ), causing significant negative contributions to e.e.E. (column (12». This is true especially in the case of heavy industries where the world demands for their products are growing quite rapidly (column (11». For 16) Itis needless to say that the effect of import substitution is, more or less, negatively correlated with the level ofa. The data on a in twenty components industries in 1965 are as follows: (1). 890, (2). 951, (3) .978, (4) .643, (5) .968, (6).988, (7). 620, (8) .911, (9) .840, (10) .838, (11) .611, (12) .841, (13) .813, (14) .338, (15) .660, (16) .106, (17) .450, (18) .448, (19) .365, (20) 1.000. Total manufacturing= .764 (the weighted average of components a/sin 1965).
17) The extraordinarily big figures in columns 7 and 9 correspond to the case where exports and market shares are very small in the base year 1965. The data on{3in 1965 are as follows: (1) .0140194, (2) .0006131, (3) .0143846, (4) .0023201, (5) .0122571, (6) .0012752, (7) .0000002, (8) .0001238, (9) .0000271, (10) .0000618 (11) .0075037, (12) .0014261, (13) .0000002, (14) .0001135, (15) .0001248, (16) .0000212, (17) .0000267, (18) .0000043, (19) .0003438, Total manufacturing= .0032752 (the weighted average of components (3's in 1965).
18) The share of coconut and other oils and fats in total chemical exports is 90.7% in 1969 (based on the
Table 3 Breakdown of C.C.E.'s in the Manufacturing Industry (at current prices): 1969/1965
-'~'---~---Domestic Market World Market
- - - - --_...__. - - - ~ . _ - - - _ . - - - _..__._---_.~ _ . _
-Industries (1) (2) - _(3) (4) (5) (6) (7) (8) (9) (10) (11) (12)
.._ . _ - - - . - _...-
a;:
Zik/Zi dik/di (1)-(2) (3) in LJdik C.C.E.a Eik/Ei Wik/Wi (7)-(8) (9) in LJWik C.C.E.b M
1965 1965 1965 1969 ~ (3)X(5) 1965 1965 1965 1969 ?Vik - (9)X(11) N > --_...__..._ - - - -...-_.-...._ - - - - _ . _ - - C 1. Food manuf. . 46136 .37702 .08434 .07898 50.5% 4.3% .48706 .11379 .37327 .37807 19.696 7.3% .. Q 2. Beverages .04177 .03192 .00985 .00985 84.8 0.8 .00225 .01200 -.00975 -.00448 32.3 -0.3 ....0 :;:
3. Tobacco prod. .06050 .04498 .01552 .00970 79.9 1.2 .Ot657 .01060 .03597 .02788 25.0 0.9
5-4. Textiles etc. .06213 .07025 -.00812 -.00617 124.3 -1.0 .09571 .13511 -.03940 -.01654 38. 7 -1.5
>-
("') ("') 5. Wood prods. .02153 .01618 .00535 .00477 70. 7 0.4 .10338 .02762 .07576 .08188 44.8 3.4 0~a
6. Furniture etc. .00597 .00439 .00158 .00198 162. 7 0.3 .00120 .00307 -.00187 -.00088 142.2 -0.3 S' aq 7. Paper .02232 .02618 -.00386 -.00339 47.2 -0.2 .00000 .04259 -.04259 -.03433 37.5 -1.6 0....
8. Printing .02563 .02045 .00518 .00202 30.8 0.2 .00021 .00564 -.00543 -.00284 79.6 -0.4 5-<'I> 9. Leather .00294 .00255 .00039 .00087 127.0 0.0 .00004 .00498 -.00494 -.00525 63.2 -0.3 '"t:J[ 10. Rubber prod. .01894 .01643 .00206 50.1 O. 1 .0004.0 .02111 -.02071 -.01485 27.2 -0.6 .;:;''1j 11. Chemicals .07147 .08510 -.01363 -.01124 64.1 -0.9 .22389 .10209 .13180 .04957 50.1 6.6 S'<'I> 12. Petroleums .05462 .04722 .00740 .01014 62.7 0.5 .01797 .04128 -.02331 .01230 27.8 -0.6 !!'...,
13. Non-metallic ::r<'I>minerals .02586 .02312 .00274 .00355 81. 4 O.? . 00000 . 04196 -.04196 -.03616 48.8 -2.0 U<'I>
14. Basic metals .01746 .03758 -.02012 -.01800 97.2 -2. ] .00403 .11621 -.11218 -.09146 56.3 -6.3 SI\'
::J 15. Metal prod. .03578 .03940 -.00362 -.00209 55.0 -0.2 .00084 .02140 -.02056 -.01997 61. 5 -1.3 0-~ 0 16. Machinery .00757 .05170 -.04413 -.04536 83.7 -3.7 .00079 . 12156 -.12077 -.12459 61. 2 -7.4 ....
6
17. Electric mach. .01836 .02964 -.01128 -.01174 71. 4 -0.8 .00042 .05126 -.05084 -.05819 91. 3 -4.6 ~ -d 18. Transp. equip. .03407 .05533 -.02126 -.02352 59.7 -1.'3 .00010 .07878 -.07868 -.10956 128.4 -10.1 ~ Ul 19. Miscel. manuf. .00950 .01893 -.00943 -.00319 27.8 -0.3 .00514 .04894 -.04380 -.03060 66.5 -2.9 0.: <'I> 20. Scrap .00223 .00162 .00061 .00080 164.3 0.1 --
- - -- -- -- -- _...._ -Total Manufact. c 1.0 1.0 0.0 0.0 -2.3 1.0 1.0 0.0 0.0 -22.0aSee equation(19). bSee equation(17). cColumn sums.
~ ~
the C.C.E. in the succeeding period, say 1969-1973 (though the required 10 data are not available yet), we can expect that a large negative value will be observed again, since the commodity compositional gaps in 1969 (column (10) ) are not so much different from those in 1965 (column (9)). For the domestic market, on the other hand, we can say based on the similar analyses that a strong concentration of domestic supplies on food manufacturing industry is the main reason for the negative C.C.E. (-2.3%). However, the C.C.E. here is small in absolute value because domestic supplies are generally dominant over foreign supplies (i.e., imports) in the domestic market,19) resulting in small compositional gaps between domestic supplies and total domestic demands (column (3) ).
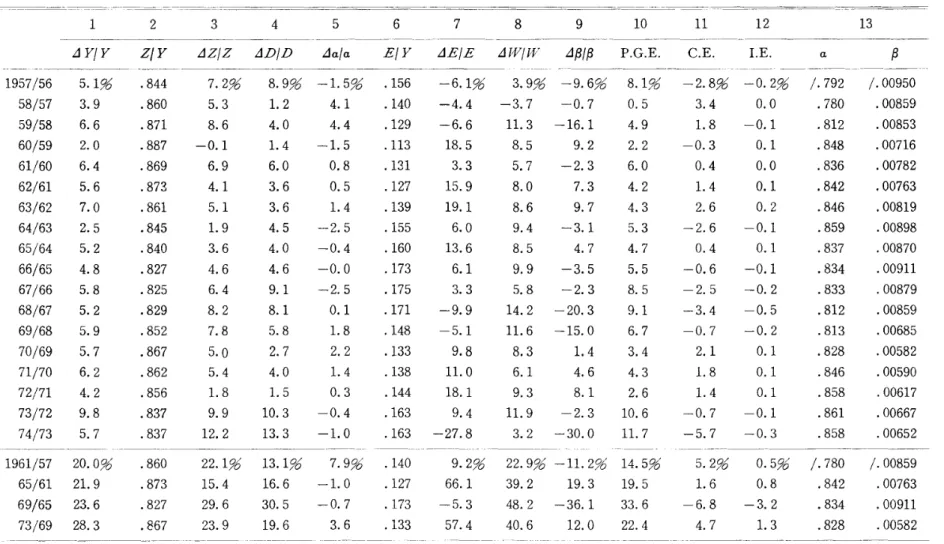
These observations on the performance of the manufacturing sector and its components industries lead us to a somewhat definite conclusion about the Philippine industrialization during the period between 1965 and 1969. That is to say, the Philippine industrialization was successful during this period in the sense that most of the components industries of the manufacturing sector strengthened their competitive powers in both of the domestic and world markets. At the same time, however, the competitive power of the manufacturing sector as a whole was weakened, to a small extent in the domestic market while considerably in the world market, due to the unfavorable effects of commodity composition caused by the heavy concentration on the food manufacturing industry in both markets. As to the Philippine economic growth in the postwar period, it is often argued that the easy phase or exuberant stage in import-substituting industrialization was over by the end of the 1950's.20) Our observations and conclusion above seem to indicate that the second stage of import sub-stitution in the backward linkage industries and the export expansion proceeded smoothly in the second half of the 1960's. The second stage, actually, was more explicit in this period than in the first half of the 1960's since, as is shown in Table 4,21) the effect of import substi-tution (column 5) was negative in general and negatively large in some of the heavy industries during the period between 1961 and 1965. 22)
So far was concerned about the individual sectors and industries. For the total economy, Table 1 (the last two rows) gives a measurement of the10basis derived by aggregating seven components sectors. 23) The result is given, of course, in terms of gross (total) output, so that
19) See the data on a in footnote 16.
20) See, for example, Power and Sicat [1971], Chapter 2.
21) Note that Table 4 is based on the 1961 input-output table which contains an erroneous data compilation on the capital formation (footnote 1). However, its effect on the final results seems to be small judging from the comparison of capital formation between 1961 and 1965 tables.
22) The unfavorable performance of manufacturing industries in the domestic market during 1961-1965, contrasted with the favorable performance during 1965-1969, may reflect the exchange control policies in the 1960's, because the former period can be characterized as the phase of continued decontrol and devaluation while the latter as the phase of return to moderate exchange control after the phase of complete liberalization. See RobertE. Baldwin [1975], Table 1-6, p. 12. The favorable performance in the world market, on the other hand, seems due mainly to the continued devaluation during this period.
Table 4 Decomposition of Growth of Manufacturing Outputs (at current prices): 1965/1961
-I 2 3 4 5 6 7 8 9 10 1] 12
Industries
iJYk/Yk Zk/Yk iJzk/Zk iJdk!dk iJak/ak Ek!Yk iJEk/Ek iJWk!Wk iJ{3k/{3k P.G.E. C.E. I.E.
1. Food manuf. 73.8% .891 74.1% 75.9% -1.0% .109 71.9% 50.496 14.496 73.1% O. 7% O. 1% ~ 2. Beverages 12.7 .998 12.3 16.0 -3.2 .002 249.3 41.1 147.5 16.1 -2.9 -0.4 ~ 3. Tobacco prod. 81. 8 .955 74.8 65.8 5.5 .045 232. 1 36.0 144.1 64.5 11. 8 5.8 N ;.-:5 4. Textiles etc. 36.5 .989 17.3 16.4 0.8 .011 1686.6 50.1 1089.8 16.8 12.8 6.1 5. Wood prods. 27.5 .870 -5.5 -3.4 -2.2 .130 248.3 48.8 133.9 3.4 15.5 8.6 Q.... 0
6. Furniture etc. 36.8 .991 34.9 34.6 0.3 .009 241. 3 175.4 23.8 35.9 0.5 0.5 :s&
7. Paper 72.0 .99999 72.0 41. 5 21. 6 .00001 200.0a 57.5 90.1 41. 5 21. 6 9.0
>-
()()
8. Printing 86.8 .99962 86.7 84.4 1.3 .00038 369.8 92. 7 143. 7 84.4 1.4 1.1 0
c
9. Leather 39.0 .99995 38. 7 22.2 13.5 .00005 4700.0a 62.8 2852. 1 22.2 13.6 3. 1 gS'
10. Rubber prod. 25.4 .99992 25.1 32.9 -5.8 .00008 2875.0 42.9 2610.5 32.9 -5.6 -1.8 Il'q0...
11. Chemicals 92.3 .928 50.5 60.2 -6.0 .072 632.4 79.8 307.8 61. 6 16.6 14.3 & '" 12. Petroleums 42.5 . 99997 37.3 24.0 10.7 · 00003 174658.3 51.1 115561. 0 24.0 14.2 4.3 "tI 13. Non-metallic
g;
82.3 .99982 82.4 78.5 2.2 .00018 -88.5 114.4 -94.6 78.5 2.2 1.7 ii' minerals '1:l S' 14. Basic metals 8.9 .99993 6. 1 43.9 -26.3 .00007 39041. 7 76.4 22111. 4 43.9 -24.7 -10.4 !f''"
15. Metal prod. 125.0 .998 124.9 113.7 5.2 .002 215.8 82.3 73.2 113.6 5.3 6.0 ::ro-:J
'"
16. Machinery -38.4 . 99953 -39.1 40.1 -56.5 · 00047 1459.3 107.4 650.4 40. 1 -56.2 -22.3 U
'"
17. Electric mach. 81. 4 .99999 80.9 97.7 -8.5 · 00001 48700.0a 111.2 22917.2 97.7 -8.3 -8.0 SI"
100.0 ::l 18. Transp. equip. 133. 7 .99999 133.6 16.9 .00001 5950.0 120.6 2646.5 100.0 16.9 16.9 9-... 19. Miscel. manuf. 44.7 .978 39.2 105.6 -32.3 .022 289.9 141. 2 61. 7 106.4 -30.2 -31.4 0....
6
20. Scrapb - - - c -0~~. iJdk ~~. iJak ~E k . iJWk ~_~.iJ{3k P.G.E.* C.E.*
~
iJYM_ ~~. iJzk I.E.*
IJ}
ZM ZM dk ZM ak EM ~ E k . iJEk EM W k EM 13k 0.:
'"
Total YM YM ZM Zk (P.G.E.) (C.E.) YM EM E k
Manufacturing (P.G.E.) (C.E.) (P.G.E.) (C.E.) (I.E.)
63.4 .938 56.2 58.4 -1.4 .062 172.5 52.7 74.8 58.0 3.3 1.7
(11)(11) ( II ) (58.2) .( -1. 3) ( II ) ( II ) (75.6) (55.2) (59.3) (2.2) (1. 9)
~~-.._--_.._--_._.__..- ---_.~---" ---_."._~---
---,.._~.-_._._--~---....
aO(zero) in the 196110 table so that1(one thousand pesos) is used in computation. bNot available in1961. 0.~ ~
Table 5 Decomposition of Growth of GNP (at constant 1967 prices): 1956-1974
1 2 3 4 5 6 7 8 9 10 11 12 13
--~--~-_.__._._.~---- - " . ,
-JYjY Z/Y JZ/Z JD/D Ja/a ElY JEIE JWIW Jf31 f3 P.G.E. C.E. I.E. a f3
---~ - -- - - ~ - _ . - .- --_._---1957/56 5.1% .844 7.2% 8.996 -1.5% .156 -6.1% 3.9% -9.6% 8. 1% -2.8% -0.2% /.792 /.00950 58/57 3.9 .860 5.3 1.2 4. 1 .140 -4.4 -3.7 -0.7 0.5 3.4 0.0 .780 .00859 59/58 6.6 .871 8.6 4.0 4.4 .129 -6.6 11. 3 -16.1 4.9 1.8 -0.1 .812 .00853 60/59 2.0 .887 -0.1 1.4 -1.5 .113 18.5 8.5 9.2 2.2 -0.3 0.1 .848 .00716 61/60 6.4 .869 6.9 6.0 0.8 .131 3.3 5. 7 -2.3 6.0 0.4 0.0 .836 .00782 62/61 5.6 .873 4. 1 3.6 0.5 .127 15.9 8.0 7.3 4.2 1.4 O. 1 .842 .00763 63/62 7.0 .861 5. 1 3.6 1.4 .139 19.1 8.6 9. 7 4.3 2.6 O. 2 .846 .00819 ;.mt 64/63 2.5 .845 1.9 4.5 -2.5 .155 6.0 9.4 -3.1 5.3 -2.6 -0.1 .859 .00898 3m 65/64 5.2 .840 3.6 4.0 -0.4 .160 13.6 8.5 4. 7 4. 7 0.4 0.1 .837 .00870 '-..j,-:" 66/65 4.8 . 827 4.6 4.6 -0.0 .173 6.1 9.9 -3.5 5.5 -0.6 -0.1 . 834 . 00911 '-..j ~ 67/66 5.8 .825 6.4 9. 1 -2.5 .175 3.3 5.8 -2.3 8.5 -2.5 -0.2 .833 .00879 ~ 68/67 5.2 .829 8. 2 8.1 O. 1 .171 -9.9 14.2 -20.3 9.1 -3.4 -0.5 .812 .00859 ~ 01 69/68 5.9 .852 7.8 5.8 1.8 .148 -5.1 11. 6 -15.0 6. 7 -0.7 -0.2 .813 .00685 ~~ 70/69 5. 7 .867 5.0 2. 7 2.2 .133 9.8 8.3 1.4 3.4 2.1 O. 1 .828 .00582 <Jju 71/70 6.2 .862 5.4 4.0 1.4 .138 11. 0 6. 1 4.6 4.3 1.8 O. 1 .846 .00590 72/71 4.2 .856 1.8 1.5 0.3 .144 18. 1 9.3 8.1 2.6 1.4 0.1 .858 .00617 73/72 9.8 .837 9.9 10.3 -0.4 .163 9.4 11. 9 -2.3 10.6 -0.7 -0.1 .861 .00667 74/73 5. 7 .837 12.2 13.3 -1.0 .163 -27.8 3.2 -30.0 11. 7 -5.7 -0.3 .858 .00652 - - - - , . - - _ . _ - -" . _ - - - ' - - - _..-- ~-- ---_._---~---1961/57 20.0% .860 22. 1% 13.1% 7.9% .140 9.2% 22. 996 -11. 2% 14.5% 5.2% 0.596 /.780 /.00859 65/61 21. 9 .873 15.4 16.6 -1.0 .127 66. 1 39.2 19.3 19.5 1.6 0.8 .842 .00763 69/65 23.6 .827 29.6 30.5 -0.7 .173 -5.3 48.2 -36.1 33.6 -6.8 -3.2 .834 .00911 73/69 28.3 .867 23.9 19.6 3.6 .133 57.4 40.6 12.0 22.4 4. 7 1.3 .828 .00582 - - - ~ - - - _ . -- ---_..~- --_._~._--.._. _ . _ . _ '
-Basic identities: Y+M=D+E, Z= Y-E=D-Jll, Y=Z+E, a=Z/D and f3=EIW.
M.EZAKI: Growth Accounting of the Philippines, The Demand-for-Output Side
it seems worthwhile for comparative purposes to provide here a corresponding result in terms of GNP (i.e., measurement of the N1S basis). There exists no meaningful linkage between 10 and N1S bases unlike the case of growth accounting from the input side, mainly because it is not reasonable to compare GNP (total final expenditures) directly with imports in the domestic market. Therefore, our measurement of the N1S basis here is derived only by analogy without any theoretical rationale for the domestic market, replacing y (total output) by Y (GNP or total value added),
z
(total domestic supply to domestic market) byZ (total domestic supply to domestic final market), and d (total domestic demand) by D
(total domestic final demand). The results at constant 1967 prices are presented in Table 5 for the period 1957-1974 annually.24) We must be careful in reading the table that P.G.E.'s and C.E.'s are measured on the basis of the highly aggregated national income data which probably generate high levels of C.C.E.'s in both markets. Though the results shown in Table 5 not only lack their theoretical background for the domestic market but also miss the detailed informations on the components sectors and industries, they are useful to get a rough idea on the sources of GNP growth from the demand side and to supplement the measurement of the 10 basis constrained by the limited availability of input-output tables.
IV
Concluding Remarks
We have presented, in this paper, a methodological framework for the growth accounting from demand side on the basis of the input-output tables by applying the constant-market-shares (CMS) analysis of exports consistently to both of the domestic and world markets. U sing this framework, we have provided a measurement on the Philippine economy in the form of comparing mainly the 1965 and 1969 input-output tables of NEC and NEDA, and investigated in some details the process of Philippine industrialization in the 1960's.
Our measurement and analysis, however, are limited in many respects mainly due to the scarcity of available data. For example, first, various components demands in the domestic market are not distingushed explicitly here so that such demand factors as consumption, investment and intermediate expenditures are treated completely in the same manner. Second, similarly in the world market, differences between components individual markets (countries) are not explicitly allowed for, neglecting the so called market compositional
effect of the ordinary CMS analysis. Third, also in the world market, the role of domestic industry as the competitor in each importing country is neglected by regarding only imports as the measure for the market size. Fourth, the measurement and analysis here are made only for the period between 1965 and 1969, or at most for the 1960's (though the 1957-1974 period is covered in a rough way by the measurement of the N1S basis). Finally, the
com-24) The national income data for 1956-1960 are obtained from Canlas, Encarnacion and Ho [1975], Tablel.
The world imports (TV) are again estimated by the sum of total imports (all commodities) of the same twenty countries. The deflator for W is the price or unit value index (all commodities) of world exports of market economies.
parison between growth accounting of the demand side and that of the input side is possible only for the aggregate seven sectors but not for the detailed components industries.25
)
These limitations, of course, must be lessened and eliminated one by one in accordance with the improved data availability. At the same time, similar analyses must be made on the other developing countries in East and Southeast Asia (Korea, Taiwan, other ASEAN countries, etc.) as well as on Japan, because the international comparison may possibly shed some light on the process of Philippine economic development. The analysis by international comparison on both input and demand sides will be the major topic of the author's future researches.
Appendix. Note on the Morley-Smith Measure of Import Substitution Morley and Smith [1970] criticized the Chenery's measure of import substitution as em-ploying a narrow definition of imports, and proposed a new measure by expanding the concept of imports to include the intermediate demands generated by import susbtitution. In this ap-pendix, we will raise several criticisms against their proposal, from which it may be concluded that their measure of import substitution is somewhat misleading or at least not superior to the ordinary one.
Their analytical framework can be summarized as follows using their own notation and equation numbers:
m*=[I-A]-1m =the vector of redefined imports
Xi+mi fi+ ~ aijXj (£=1. . .n)
where mi=imports, Xi=gross production, /i=final demand, both domestic and foreign, and aij=observed imput-output coefficient
[I- A]x+m
f
(in matrix notation)x+[I-A]-1m= [I- A]-V (2)
(3)
(4) (5)
(6) z*=x+m*=the new vector of total supply.
According to their explanations, m* in equation(5) is the correct concept of imports to be used in the analysis of import substitution, since it values imports on a comparable basis with domestic production by allowing for implicit imports due to the intermediate demands gener-ated by import substitution. In fact, m* seems to be a measure for the equivalent of imports in domestic production, but it is so only in a limited and unrealistic situtaion.
To clarify this, we consider, first, the case of two industries (i.e., n=2) without losing any generalities, and rewrite equation(5)as:
(AI)
M.EZA KI: Growth Accounting of the Philippines, The Demand-far-Output Side
Note that m*l,l and m*2,1 represent the reqiured increases in outputs of both industries to substitute ml completely by domestic production. m*l,l consists not only of direct substitu-tion (i.e., ml) but also of indirect substitusubstitu-tion (i.e., implicit imports), while m*2,1 consisits only of indirect one. The same is true for m*1,2 and m*2,2 except the fact that they correspond to the case of substituting m2 domestically. Now we can see from equation (AI) that ml* (=m*l,l +m*1,2) or m2*( =m*2,1 +m*2,2) consists of these direct and indirect effects in substituting both ml and m2 simultaneously by domestic production. Therefore, ml
*
is not the equivalent of ml in domestic production since (m*l,l m*2,1) is a reasonable one (though under the present context only). Similarly, m2* is not the equivalent of m2 in domestic production since (m*2,1 m*2,2) is a resonable one. Only as the set, m* (the redefined import vector) may be considered as a resonable equivalent of m (the original import vector) in domestic production, so that the meaning of m* is vague or at least not direct. Actually, their illustrative explanations to justify m* (given in second, third and fourth paragraphs at p. 729) are all related to either (m*l,l m*2,1) or (m*1,2 m*2,2) but not both.Even if m* as the vector is not meaningless, it is the concept derived under the unrealistic assumption of constant.f (i.e., unchanged final demand). This can be understood in the following way. Equation (2), which is
(A2) x+m f+Ax
in matrix notation, shows the actual or onserved situation. Suppose that imports are com-pletely substituted by increasing domestic outputs with no change in final demand:
(A3) x* f+Ax*
This is a hypothetical situation. Then, we get (A4) x*-x=[I-AJ-1m=m*
which sows that m* is the required increase in output to replace m domestically with no change in.f. However, it is not possible to increase domestic outputs without using more capitals or without the increase in captial formation which means the change in
f
On the other hand, greater domestic outputs reuire greater labor inputs which may lead to the increase in con-sumption. Therefore, m* is the concept derived by comparing the actual situation (equation (A2» with an impossible or unrealistic hypothetical situation (equation (A3». Furthermore, equation (4) corresponds to the supply-demand equilibrium relations in this hypothetical situ-ation, since its left-hand side is the new vector of total supply with the import component redefined by domestic equivalent while its right-hand side is the vector of total demand re-qureid to sustain the observed.f domestically (See equation (A3». There is no reason why the hypothetical supply-demand relations shown by equation (4) are better than the ordinary and natural ones shown by equation (2) or (A2) which values imports on a comparable basis with domestic outputs as far as the former is competitive with the latter.Data Appendix: World Imports (Wi)
(i) Definition of world market. In this paper, the world market is defined as the group of twenty top trading partners in 1969 which are listed in Table A-I. Note that Indonesia and Malaysia do not belong to this group of top twenties but they are included in our world market in place of South Africa (19th) and Belgium (20th) only by reason of ASEAN countries.
(ii) Identification of commodities between Philippine10tables and UN trade statistics. The data for Philippine exports are those of the input-output tables, while the data on world imports are based on the
UN Yearbook of International Trade Statistics which classifies commodity transactions according to the
Standard International Trade Classification (SITC). Here, the Philippine exports of the10basis are identi-fied one by one with the commodities of the SITC basis by using Foreign Trade Statistics of the Philippines (1969 issue, Bureau of the Census and Statistics) which provides detailed data on Philippine exports based on the SITC. Table A-2 shows this identification in terms of the SITC code numbers. For the sectors of transportation, commerce and services, however, the corresponding SITC data are not available or not identi-fiable so that all of the data in the UN trade yearbook are regarded as concerning the agricultural, mining and manufacturing industries, except for the data carrying the SITC code number 9 which are neglected here completely. The world imports are, of course, obtained by summing imports in the twenty countries listed in Table A-l. For some commodities in some countries, the commodity classification in the UN yearbook is not detailed enough to be compared with Table A-2, so that our data on world imports (Wj) contain some minor approximations which hardly influence the analyses of this paper.
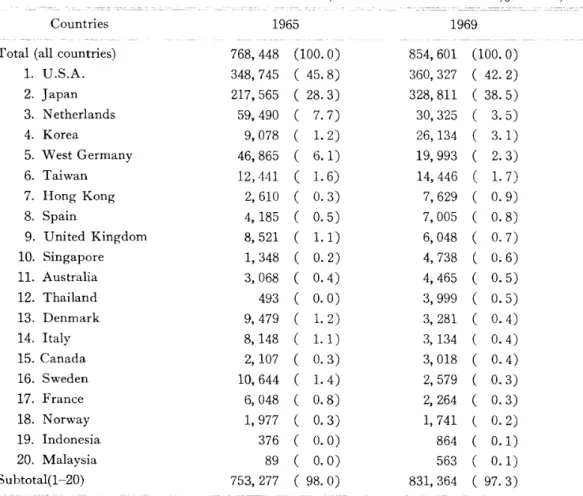
Table A.I Philippine Exports by Destination (All Commodities).
(thousand U.S. dollars and% in total)
Countries 1965 1969
Total (all countries) 768,448 (100.0) 854,601 (100.0)
1. U.S.A. 348,745 ( 45.8) 360,327 ( 42. 2) 2. Japan 217,565 ( 28.3) 328,811 ( 38.5) 3. Netherlands 59,490 ( 7.7) 30,325 ( 3.5) 4. Korea 9,078 ( 1. 2) 26, 134 ( 3. 1) 5. West Germany 46,865 ( 6.1) 19,993 ( 2.3) 6. Taiwan 12,111 ( 1. 6) 14,446 ( 1. 7) 7. Hong Kong 2,610 ( 0.3) 7,629 ( 0.9) 8. Spain 4,185 ( 0.5) 7,005 ( 0.8) 9. U nited Kingdom 8,521 ( 1.1) 6,048 ( 0.7) 10. Singapore 1, 348 ( 0.2) 4,738 ( 0.6) 11. Australia 3,068 ( 0.4) 4,465 ( 0.5) 12. Thailand 493 ( 0.0) 3,999 ( 0.5) 13. Denmark 9,479 ( 1. 2) 3, 281 ( 0.4) 14. Italy 8, 148 ( 1. 1) 3, 134 ( 0.4) 15. Canada 2, 107 ( 0.3) 3,018 ( 0.4) 16. Sweden 10,644 ( 1. 4) 2, 579 ( 0.3) 17. France 6, 048 ( 0.8) 2,264 ( 0.3) 18. Norway 1, 977 ( 0.3) 1, 741 ( 0.2) 19. Indonesia 376 ( 0.0) 864 ( 0.1) 20. Malaysia 89 ( 0.0) 563 ( 0.1) Subtotal(1-20) 753, 277 ( 98.0) 831,364 ( 97.3)
Source: Central Bank of the Philippines, Statistical Bulletin, Vol. XXVI, December 1974, Table 76 (pp. 159-196).
M.EZAKI: Growth Accounting of the Philippines, The Demand-far-Output Side
Table A-2 Commodity Identification Based on the Standard International Trade Classification (SITC).*
Industries Agriculture, Fisheries and Forestry Mining and Quarrying
Manufacturing
1. Food manufactures
2. Beverages 3. Tobacco products
4. Textile manufactures, wearing apparel and made-up textile goods
5. Wood, cane and cork products, except furniture
6. Furniture and fixtures 7. Paper and paper products
8. Printing, publishing and allied industries 9. Leather and leather products, except
footwear
10. Rubber products
11. Chemicals and chemical products
12. Petroleum refineries and other petroleum products
13. Non-metallic mineral products
14. Basic metals
15. Metal products, except machinery and transport equipment
16. Machinery, except electrical
17. Electrical machinery, apparatus and appliances
18. Transport equipment
19. Miscellaneous manufactures
20. Scrap
SITC Code Numbers
00,031,041,042-01,043,044,045,051,052, 054,055,071,22,241,242 28,311,312 (or 28,321,331) 01,02,032,042-02,046,047,048,053,06,072, 073,074,075,08,09 11 12 21,26,65,83,84,85 243,244,63 82 25,64 892 61 23,62 271,29,4,5 313,314 (or 332,334) 272,66 67,68 69 71 72 73 81,86,891,899
* Derived by comparing the1969input-output table with theForeign Trade Statistics of the
PhiHppines-1969 (Bureau of the Census and Statistics).
(iii) Deflators for the world imports. For the aggregate three sectors of agriculture, mining and manu-factur!ng, world imports are deflated by the aggregate price indexes which are weighted averages of the price or unit value indexes for world exports of market economies in the UN Yearbook of International Trade
Statistics. The weights are derived from our estimates of nominal IV;'sin 1965and 1969.
References
Narongchai Akrasanee, "Import Substitution, Export Expansion and Sources of Industrial Growth in Thailand,1960-1972."in P. Sondysuvan (ed.),Finance, Tra& and Economic Development in Thailand,
Bangkok, Sompong Press, 1975,pp. 257-277.
B. Balassa et al., The Structure of Protection in Developing Countries, Baltimore, The Johns Hopkins Press,
1971.
R.E. Baldwin, Foreign Trade Regimes and Economic Development: The Phil£ppines, New York, National Bureau of Economic Research, 1975.
D. B. Canlas, J. Encarnacion and T. J. Ho, "Sectoral Employment, Income Distribution and Consumption: A Macromodel with an Input-Output Structure," IEDR- UPSE Discussion Paper No. 75-16, October 1975.
H.B. Chenery, "Patterns of Industrial Growth," The American Economic Review, Vol. 50, September 1960, pp. 624-654.
M. Ezaki, "Growth Accounting of the Philippines: A Comparative Study of the 1965 and 1969 Input-Output Tables," IEDR-UPSE Discussion Paper No. 76-2, January 1976 (forthcoming in The Philipp£ne
Econo-mic Journal).
K. Liang and T. Lee, "Taiwan," in S. Ichimura (ed.), The Economic Development of East and Southeast
Asia, Honolulu, The University Press of Hawaii, 1975, pp. 269-346.
S. M. Morley and G. W. Smith, "On the Measurement of Import Substitution," The American Economic
Review, Vol. 60, September 1970, pp. 728-735.
S. N aya and N arongchai Akrasanee, "Thailand's International Economic Relations with Japan and the United States: A Study of Trade and Investment Interactions," in L.V. Castle and F. Holmes (eds.),
Co-operation and Development in the AsiafPaczfic Region--Relations between Large and Small Countries,
Tokyo, The Japan Economic Research Center, 1976, pp. 94-141.
S. Naya and Udom Kerdpibule, "Trade Policy and Problems of Export Expansion-The Case of Southeast Asia," in K. Kojima (ed.), Structural Adjustments in Asian-Paczjic Trade, Tokyo, The Japan Economic Research Center, 1973, pp. 151-186.
J. Power and G. P. Sicat, The Philippines: Industrialz'zation and Trade Pol£cz'es, (OECD Report), Oxford University Press, 1971, pp. 1-134.
J. D. Richardson, "Constant-Market-Shares Analysis of Export Growth,"Journal of International Economics, Vol. 1, 1971, pp. 227-239.
Y. Shionoya, "Patterns of Industrial Development," inL. R. Klein and K. Ohkawa (eds.), Economic Growth:
The Japanese Experiance since the j/;feziz' Era, Homewood, Irwin, 1968, pp. 69-109.
Bureau of the Census and Statistics, Foreign Trade Statistics of the Phillipines-1969, Manila.
Central Bank of the Philippines, Statistical Bulletin: Statistical Appendix to the Twenty-Sixth Annual
Report, 1973, (Department of Economic Research), Vol. XXVI, December, 1974.
National Census and Statistics Office, Philippine Yearbook 1975, Manila, 1975.
National Economic and Development Authority, NEDA National Income Series, Number 1-3, Manila, 1973-1975.
, NEDA Statistical Yearbook of the Philippines, 1975 and 1976 issues, Manila, 1975 and
1976.
1969 Input-Output Tables of the Phihppines, Manila, 1975.
National Economic Council, The 1961 Interindustry (Input-Output) Accounts oj the Philippines, (Office of Statistical Coordination and Standard), Manila.
, "The 1965 Interindustry (Input-Output) Accounts of the Philippines," The Statistical Reporter, Vol. XV, No.3, July-September 1971.