Analysis of IO-based Annual Supply and Use Tables for the Development of QNA
30
0
0
全文
(2) 創刊のことば 社会科学の研究と社会的実践における統計の役割が大きくなるにしたがって,統計にかんす る問題は一段と複雑になってきた。ところが統計学の現状は,その解決にかならずしも十分で あるとはいえない。われわれは統計理論を社会科学の基礎のうえにおくことによって,この課 題にこたえることができると考える。このためには,われわれの研究に社会諸科学の成果をと りいれ,さらに統計の実際と密接に結びつけることが必要であろう。 このような考えから,われわれは,一昨年来経済統計研究会をつくり,共同研究を進めてき た。そしてこれを一層発展させるために本誌を発刊する。 本誌は,会員の研究成果とともに,研究に必要な内外統計関係の資料を収めるが同時に会員 の討論と研究の場である。われわれは,統計関係者および広く社会科学研究者の理解と協力を えて,本誌をさらによりよいものとすることを望むものである。 1955 年 4 月. 経 済 統 計 研 究 会. 経 済 統 計 学 会 会 則 第 1 条 本会は経済統計学会(JSES : Japan Society of Economic Statistics)という。 第 2 条 本会の目的は次のとおりである。 1 .社会科学に基礎をおいた統計理論の研究 2 .統計の批判的研究 3 .すべての国々の統計学界との交流 4 .共同研究体制の確立 第 3 条 本会は第 2 条に掲げる目的を達成するために次の事業を行う。 1 .研究会の開催 2 .機関誌『統計学』の発刊 3 .講習会の開催,講師の派遣,パンフレットの発行等,統計知識の普及に関する事業 4 .学会賞の授与 5 .その他本会の目的を達成するために必要な事業 第 4 条 本会は第 2 条に掲げる目的に賛成した以下の会員をもって構成する。 ⑴ 正会員 ⑵ 院生会員 ⑶ 団体会員 2 入会に際しては正会員 2 名の紹介を必要とし,理事会の承認を得なければならない。 3 会員は別に定める会費を納入しなければならない。 第 5 条 本会の会員は機関誌『統計学』等の配布を受け,本会が開催する研究大会等の学術会合に参加すること ができる。 2 前項にかかわらず,別に定める会員資格停止者については,それを適用しない。 第 6 条 本会に,理事若干名をおく。 2 理事から組織される理事会は,本会の運営にかかわる事項を審議・決定する。 3 全国会計を担当する全国会計担当理事 1 名をおく。 4 渉外を担当する渉外担当理事 1 名をおく。 第 7 条 本会に,本会を代表する会長 1 名をおく。 2 本会に,常任理事若干名をおく。 3 本会に,常任理事を代表する常任理事長を 1 名おく。 4 本会に,全国会計監査 1 名をおく。 第 8 条 本会に次の委員会をおく。各委員会に関する規程は別に定める。 1 .編集委員会 2 .全国プログラム委員会 3 .学会賞選考委員会 4 .ホームページ管理運営委員会 5 .選挙管理委員会 第 9 条 本会は毎年研究大会および会員総会を開く。 第10条 本会の運営にかかわる重要事項の決定は,会員総会の承認を得なければならない。 第11条 本会の会計年度の起算日は,毎年 4 月 1 日とする。 2 機関誌の発行等に関する全国会計については,理事会が,全国会計監査の監査を受けて会員総会に報告し, その承認を受ける。 第12条 本会会則の改正,変更および財産の処分は,理事会の審議を経て会員総会の承認を受けなければならない。 付 則 1 .本会は,北海道,東北,関東,関西,九州に支部をおく。 2 .本会に研究部会を設置することができる。 3 .本会の事務所を東京都町田市相原 4342 法政大学日本統計研究所におく。 1953 年 10 月 9 日(2010 年 9 月 16 日一部改正[最新] ). 執 筆 者 紹 介(掲載順) 山 口 幸 三( (独)統計センター) 伊 藤 伸 介(明海大学経済学部) 秋 山 裕 美( (独)統計センター) 櫻 本 健(松山大学経済学部) IRINA ELISEEVA (Dr. Professor, Member−in−correspondence of Russian Academy of Sciences). 支 部 名. 事 務 局. 北 海 道 …………. 062−8605 札幌市豊平区旭町 4−1−40 北海学園大学経済学部 (011−841−1161). 水野谷武志. 東 北 …………. 986−8580 石巻市南境新水戸 1 石巻専修大学経営学部 (0225−22−7711). 深 川 通 寛. 関 東 …………. 192−0393 八王子市東中野 742−1 中央大学経済学部 (042−674−3424). 芳 賀 寛. 関 西 …………. 525−8577 草津市野路東 1−1−1 立命館大学経営学部 (077−561−4631). 田 中 力. 九 州 …………. 870−1192 大分市大字旦野原 700 大分大学経済学部 (097−554−7706). 西 村 善 博. 編 集 委 員 水野谷武志(北海道). 前 田 修 也(東 北). 岡 部 純 一(関 東). 良 永 康 平(関 西) [副]. 山 口 秋 義(九 州) [長]. 統 計 学 №104 2013年3月31日 発行. 発 行 所. 経. 済. 統. 計. 学. 会. 〒194−0298 東 京 都 町 田 市 相 原 町4342. 法政大学日本統計研究所内 発 行 人. TEL 042 (783) 2325 FAX 042 (783) 2332 h t t p : / / w w w. j s e s t . j p / 代 表 者 森 博 美. 発 売 所. 株 式 会 社 産 業 統 計 研 究 社. 〒162−0801 東京都新宿区山吹町15番地. TEL 03 (5206) 7605 FAX 03(5206) 7601 E−mail:sangyoutoukei @ sight.ne.jp 代 表 者 品 川 宗 典 昭和情報プロセス㈱印刷. Ⓒ経済統計学会.
(3) 『統計学』第 104 号 2013 年 3 月. 【論文】. Analysis of IO−based Annual Supply and Use Tables for the development of QNA* Takeshi SAKURAMOTO** Summary This paper reports that it would be efficient for the Economic and Social Research Institute (ESRI) to introduce the Annual Supply and Use Tables (ASUT) and the balancing system of the ASUT to the core system of formulating Annual National Accounts (ANA) in Japan. The core system of the ANA currently depends on the Benchmark Input−Output Table (BIOT) according to SNA1968. However, if the JSNA improves the core system for its quarterly national accounts, the BIOT may be an obstacle in the future. Thus, it is necessary to examine the relation between the ANA and BIOT, which the present study undertakes. The combination of the BIOT and consistent ASUT will be an important choice for the JSNA instead of the European Supply and Use System. There are certain challenges when analyzing the ASUT, including the choice of balancing methods, the consistency of the product−flow method, and the frames of the ASUT. Although many concepts are difficult to estimate accurately in this novel estimation, the ASUT would allow the JSNA to select from many choices to improve actual measurement. This paper includes simple estimations of the ASUT (unbalanced and balanced) and provides a definitive suggestion for future changes. Key Words Annual Supply and Use Tables, Japanese System of National Accounts, Input−Output Table, Supply and Use Tables, product−flow method. *. This paper was revised from Sakuramoto (2012a) and Sakuramoto (2012b) in English. The draft paper of this paper was reported in second poster session of the International Association for Research in Income and Wealth 32nd General Conference, Boston, USA, August 5−11, 2012. The views expressed are those of the author and should not be attributed to the Government of Japan. Errors remaining are my responsibility. ** Faculty of Economics, Matsuyama University, 4−2 Bunkyo−cho, Matsuyama−city, Ehime, Japan 790−8578, E−mail: [email protected]. 16.
(4) Takeshi SAKURAMOTO. Analysis of IO−based Annual Supply and Use Tables for the development of QNA. Introduction***. SUT and for improving the Quarterly National. This paper reports that it would be efficient. Accounts (QNA) and ANA in Japan, it is neces-. for the Economic and Social Research Institute. sary for the Japanese System of National Ac-. (ESRI) of the Government of Japan (GOJ) to in-. counts to search for a breakthrough to maintain. troduce the Annual Supply and Use Tables. the BIOT and to provide consistent SUT for the. (ASUT) and the balancing system of the ASUT. introduction of the SNA1993/SNA2008.. to the core system of formulating Annual Na-. Make and Use Tables (also termed V and U. tional Accounts (ANA) in Japan. Although the. Tables) now depend on the BIOT. A Supply Ta-. System of National Accounts 1993 (SNA1993. ble (unbalanced) is transposed onto the V Table. hereafter) was introduced into the ANA in. using an import matrix, while the Use Table. 2000, the core system of the ANA still relies on. (unbalanced) is mostly a combination of a use. SNA1968. However, as the GOJ can estimate. matrix and the existent tables of the expendi-. the Benchmark Input−Output Table (BIOT) di-. ture series. Briefly, Make and Use Tables are. rectly, the core system of the ANA is now based. old−type SUT according to the framework of. on the application of the BIOT rather than. the SNA1968. The BIOT includes a V Table (a. adopting supply and use tables (SUT). It is. kind of Supply Table), and the ANA depend on. therefore necessary to examine the consistent. the BIOT to provide a benchmark estimation. use of SUT and their balancing system given. every five years. Although SNA1993 was intro-. that the BIOT is available in advance. The. duced into the ANA and BIOT, the ASUT are. SNA1993/SNA2008 doesn t include such a spe-. still based on Make and Use Tables. Moreover,. cial case in the core system of the ANA.. there is only a balancing system in the BIOT in. Given the foregoing, there is no consistent. order to ensure the consistency of accounts, but. system for balancing Benchmark SUT (BSUT). not in the ANA.. with the BIOT in Japan in the short−term. The. The provision of the ANA without the ASUT. detailed BIOT is estimated in the first step in. restricts the performance of the official statis-. order to calculate the ANA as data sources in. tics. Recently, as this statistical discrepancy has. the second step. The JSNA, which can utilize. expanded, it has become necessary to analyze. the BIOT directly, face challenges estimating. the inconsistent numbers in the ANA. Howev-. consistent SUT according to the SNA1993/. er, Japan has neither consistent SUT (balanced). SNA2008. Because the BIOT is an obstacle for. nor a systematic analysis process in a core sys-. ***. List of Abbreviations is as follows. ANA: Annual National Accounts ASUT: Annual Supply and Use Tables BIOT: Benchmark Input−Output Table BSUT: Benchmark Supply and Use Tables CIF: Cost of Insurance Freight ESRI: Economic and Social Research Institute FOB: Free On Board GDP: Gross Domestic Product GFCF: Gross Fixed Capital Formation GOJ: Government of Japan JSNA: Japanese System of National Accounts. JSIC: Japan Standard Industrial Classification IOT: Input−Output Table QNA: Quarterly National Accounts QSUT: Quarterly Supply and Use Tables JSIC: Japan Standard Industrial Classification SNA: System of National Accounts SNA1968: System of National Accounts 1968 SNA1993: System of National Accounts 1993 SNA2008: System of National Accounts 2008 SUT: Supply and Use Tables. 17.
(5) 『統計学』第 104 号 2013 年 3 月. tem of the ANA.. the background of the ASUT in the first section.. By contrast, while the ESRI publishes quar-. The second section deals with the frame and. terly Gross Domestic Product (GDP, Expendi-. simple estimation of the ASUT. Section 3 con-. ture Approach) figures in the QNA in Japan, it. cludes.. no longer includes GDP (Output or Income Approach) and other series (e.g., household sav-. 1. New Features of the JSNA. ings). It is therefore increasingly important to. 1−1 The conflict between the JSNA and. improve the JSNA in order to expand the QNA, and SUT are an effective tool in this regard.. the updated SNA This paper discusses the so−called Japanese. Thus, pairing the ASUT with the existent. contradiction , namely that the ESRI must. benchmark BIOT is an efficient policy choice,. break up its core accounts of the JSNA in order. because this combination would improve the. to introduce the SNA1993/SNA2008. This con-. core system of the ANA and develop a consis-. tradiction implies that it is necessary for the. tent time series for the ASUT.. ESRI to analyze SUT to improve the QNA.. In light of this foregoing, there are three pur-. However, if the ESRI were to actually introduce. poses for developing the ASUT in Japan. First,. SUT in the short run, the existing BIOT would. the ANA would have a system that was capable. be a large obstacle. Although there is consen-. of analyzing the statistical discrepancy with the. sus that the ESRI would improve the key ac-. ASUT. Second, the actual work of the ANA. counts in the long−term according to the rec-. would be vastly improved. For example, the. ommendations of the SNA, the introduction of. ESRI may be able to measure fixed GDP with-. SUT would apply the wrong rules to certain. out any discrepancy over a three−year period.. Asian countries. Further, Japan, South Korea,. Third, the ASUT would be necessary for the. and other Southeast Asian countries still utilize. QNA and the Quarterly Supply and Use Tables. the BIOT according to SNA1968. The BIOT. (QSUT).. thus represents the key accounts for the SNA. This paper principally covers the concept of. instead of SUT.. and issues faced by the development of the. However, this process raises the questions of. ASUT (unbalanced, balanced) and the balancing. who thinks about Asian key accounts in terms. system. There are certain challenges when ana-. of SNA2008 and how Asian countries report. lyzing the ASUT, including the choice of balanc-. their key accounts in line with the SNA1993/. ing methods, the consistency of the product−. SNA2008. This paper thus suggests a new. flow method (commodity−flow method), the. scheme for adapting the core accounts in the. frames of the ASUT, and so on. Although many. SNA1993/SNA2008 according to this Input−. concepts are difficult to estimate accurately in. Output System. The core accounts in SNA1993,. this novel estimation, the new frame of the. SNA2008, and the European System of Ac-. ASUT would improve the measurement of the. counts are the same according to the SUT Man-. JSNA. In this paper, I thus argue in favor of in-. ual (Eurostat (2008)). Importantly, because the. troducing the new core system described here-. Japanese contradiction is a common problem. in into the JSNA.. across Asian countries, this paper concentrates. The paper is organized as follows. I introduce. on the Japanese Input−Output System and SUT. 18.
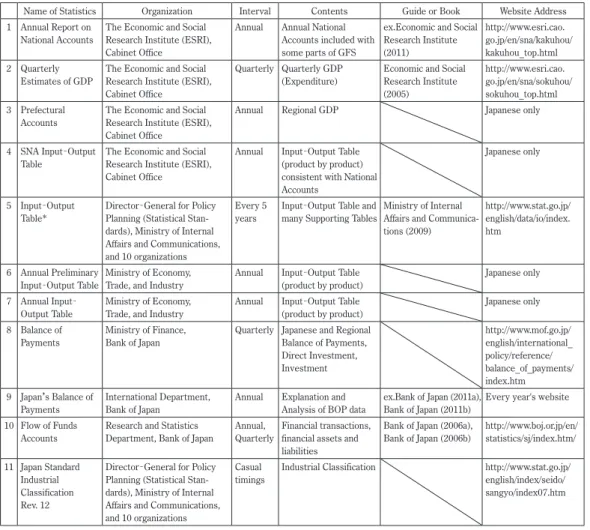
(6) Takeshi SAKURAMOTO. Analysis of IO−based Annual Supply and Use Tables for the development of QNA. Table 1 Japanese Main Statistics in connection with SNA. Name of Statistics. Organization. Interval. Contents. Guide or Book. Website Address. ex.Economic and Social http://www.esri.cao. Annual National go.jp/en/sna/kakuhou/ Accounts included with Research Institute kakuhou_top.html (2011) some parts of GFS. 1 Annual Report on National Accounts. The Economic and Social Research Institute (ESRI), Cabinet Office. Annual. 2 Quarterly Estimates of GDP. The Economic and Social Research Institute (ESRI), Cabinet Office. Quarterly Quarterly GDP (Expenditure). 3 Prefectural Accounts. The Economic and Social Research Institute (ESRI), Cabinet Office. Annual. Regional GDP. Japanese only. 4 SNA Input−Output Table. The Economic and Social Research Institute (ESRI), Cabinet Office. Annual. Input−Output Table (product by product) consistent with National Accounts. Japanese only. 5 Input−Output Table*. Director−General for Policy Planning (Statistical Standards), Ministry of Internal Affairs and Communications, and 10 organizations. Every 5 years. Input−Output Table and Ministry of Internal http://www.stat.go.jp/ many Supporting Tables Affairs and Communica- english/data/io/index. tions (2009) htm. 6 Annual Preliminary Ministry of Economy, Input−Output Table Trade, and Industry. Annual. Input−Output Table (product by product). Japanese only. 7 Annual Input− Output Table. Ministry of Economy, Trade, and Industry. Annual. Input−Output Table (product by product). Japanese only. 8 Balance of Payments. Ministry of Finance, Bank of Japan. Quarterly Japanese and Regional Balance of Payments, Direct Investment, Investment. 9 Japan s Balance of Payments. International Department, Bank of Japan. Annual. 10 Flow of Funds Accounts. Research and Statistics Department, Bank of Japan. Annual, Financial transactions, Quarterly financial assets and liabilities. 11 Japan Standard Industrial Classification Rev. 12. Director−General for Policy Planning (Statistical Standards), Ministry of Internal Affairs and Communications, and 10 organizations. Casual timings. Economic and Social Research Institute (2005). Explanation and Analysis of BOP data. http://www.esri.cao. go.jp/en/sna/sokuhou/ sokuhou_top.html. http://www.mof.go.jp/ english/international_ policy/reference/ balance_of_payments/ index.htm ex.Bank of Japan (2011a), Every year's website Bank of Japan (2011b) Bank of Japan (2006a), Bank of Japan (2006b). Industrial Classification. http://www.boj.or.jp/en/ statistics/sj/index.htm/ http://www.stat.go.jp/ english/index/seido/ sangyo/index07.htm. * This paper calls Number 5 BIOT.. Table 2 The variation of GDP statistics in JSNA QNA. ANA Second Quarterly Estimates of GDP. Delay. About a month and two weeks. About two months and 10 days. About 9 months. About a year and 9 months. GDP (expenditure approach) and Compensation of Employees with some supporting tables. GDP (Expenditure, Production and Income approach), Current accounts, Capital Finance Accounts, Balance sheets. GDP (Expenditure, Production and Income approach), Current accounts, Capital Finance Accounts, Balance sheets. GDP (Expenditure, Production and Income approach), Current accounts, Capital Finance Accounts, Balance sheets. ○. ○. ○. Contents. GDP (Expenditure approach) and Compensation of Employees. GDP (Production Approach). First Annual Report Second Annual Report Third Annual Report on National Accounts on National Accounts on National Accounts. Benchmark revision. GDP statistics. First Quarterly Estimates of GDP. About two years and 9 months. About 5 years. GDP (Income Approach). △. △. ○. ○. ○. GDP (Expenditure Approach). ○. ○. ○. ○. ○. 19.
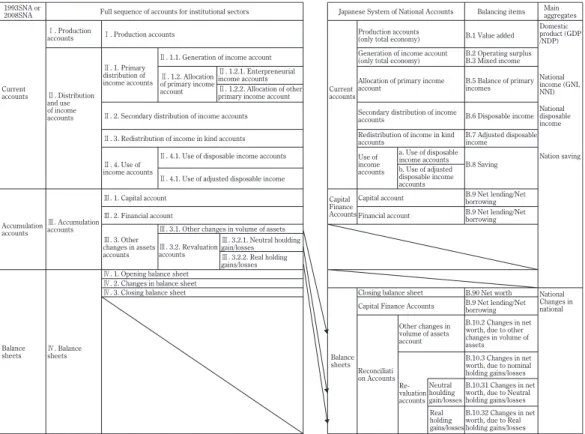
(7) 『統計学』第 104 号 2013 年 3 月. as the international standards.. Because the Japan Standard Industrial Classifi-. Even though the JSNA introduced SNA1993. cation Rev. 12 (JSIC Rev. 12) introduced the In-. in 2000, its core accounts still depend on. ternational Standard Industrial Classification. SNA1968. The JSNA does not include SUT with. Rev. 3 not Rev. 4, the JSIC is expected to be up-. a balancing system according to SNA1993 and. dated by 2015. The BIOT will thus introduce. thus they cannot control statistical discrepan-. SNA2008 in 2015 and the JSNA will follow suit. cies as the BIOT aims to but fulfills inconsis-. a year later.. tently. The JSNA covers Make and Use Tables. Numbers 1 and 2 in Table 1 are National Ac-. estimated from the BIOT instead of SUT based. counts Statistics. The Annual Report on Na-. on SNA1968.. tional Accounts (number 1) represents the. Japanese core accounts are estimated from. ANA, which comprise flow and stock accounts. the BIOT nowadays. This method is the Japa-. with many supporting tables. Table 2 shows the. nese original system. Table 1 shows the main. GDP estimation for the JSNA area. Time series. Japanese statistics in connection with the SNA.. are published five times over five years until. As shown in Table 1, numbers 1−7 and 10. the benchmark revision. The IMF ROSC report. were the accounts that introduced SNA1993.. (see IMF, 2006) recommended that the GOJ de-. 1993SNA or 2008SNA. Full sequence of accounts for institutional sectors Ⅰ. Production accounts. Ⅰ. Production accounts. Ⅱ. 1. Primary distribution of income accounts Current accounts. Ⅱ. Distribution and use of income accounts. Japanese System of National Accounts. Ⅱ. 1.1. Generation of income account Ⅱ. 1.2.1. Enterpreneurial Ⅱ. 1.2. Allocation income accounts of primary income Ⅱ. 1.2.2. Allocation of other account primary income account. Accumulation Ⅲ. Accumulation accounts accounts. Ⅱ. 4.1. Use of adjusted disposable income. Ⅲ. 2. Financial account. B.2 Operating surplus B.3 Mixed income. Redistribution of income in kind accounts a. Use of disposable Use of income accounts income b. Use of adjusted accounts disposable income accounts. Ⅱ. 4.1. Use of disposable income accounts. Ⅲ. 1. Capital account. B.1 Value added. Generation of income account (only total economy). Secondary distribution of income accounts. Ⅱ. 3. Redistribution of income in kind accounts Ⅱ. 4. Use of income accounts. Production accounts (only total economy). Allocation of primary income Current account accounts. Ⅱ. 2. Secondary distribution of income accounts. Ⅲ. 3.1. Other changes in volume of assets. Closing balance sheet Capital Finance Accounts. Balance sheets. Ⅳ. Balance sheets. Other changes in volume of assets account Balance sheets Reconciliati on Accounts. Main aggregates Domestic product (GDP /NDP). National B.5 Balance of primary income (GNI, incomes NNI) National B.6 Disposable income disposable income B.7 Adjusted disposable income Nation saving B.8 Saving. B.9 Net lending/Net borrowing B.9 Net lending/Net borrowing. Capital Capital account Finance Accounts Financial account. Ⅲ. 3. Other Ⅲ. 3.2.1. Neutral houlding changes in assets Ⅲ. 3.2. Revaluation gain/losses accounts accounts Ⅲ. 3.2.2. Real holding gains/losses Ⅳ. 1. Opening balance sheet Ⅳ. 2. Changes in balance sheet Ⅳ. 3. Closing balance sheet. Balancing items. B.90 Net worth B.9 Net lending/Net borrowing. National Changes in national. B.10.2 Changes in net worth, due to other changes in volume of assets B.10.3 Changes in net worth, due to nominal holding gains/losses. Neutral B.10.31 Changes in net Revaluation houlding worth, due to Neutral accounts gain/losses holding gains/losses Real B.10.32 Changes in net holding worth, due to Real gains/losses holding gains/losses. Figure 1 Comparison of Accounts between SNA1993/SNA2008 and JSNA Reference: SNA part is from United Nations (1994) Figure 2.3. Japanese part depends on Economic Planning Agency (2000) Table 2−1.. 20.
(8) Takeshi SAKURAMOTO. Analysis of IO−based Annual Supply and Use Tables for the development of QNA. velop a time series of GDP (i.e., the production. rectly Measured and the Net Capital Stocks. approach) in the QNA. Although the JSNA does. of Fixed Assets classified by Institutional Sec-. not provide GDP figures (i.e., the production. tors and Economic Activities .. and income approach) in the QNA nowadays,. As shown in Table 3, the BIOT represents. the ESRI recently analyzed these series in its. the Input−Output Table (IOT) used in this pa-. QNA review. Figure 1 compares the accounts of. per, which is the formal name for the BIOT. The. SNA1993 with those of the JSNA. The ANA in. basic transaction tables in the BIOT are shown. Japan covers all the areas displayed in the right−. in the form of traditional (product−by−product). 1). hand table of Figure 1 .. tables. Indeed, this table is the largest in the. Japanese data users have been able to adopt. world on which the Director−General for Policy. the new time series as a benchmark revision of. Planning (Statistical Standards), Ministry of In-. 2010 since December 2011. The new data cover. ternal Affairs and Communications, and 10 or-. the Financial Intermediation Services Indi-. ganizations cooperate. Table 3 presents the. Table 3 Benchmark Input−Output Table(BIOT)List Input−Output Table (1) Input Table Basic (2) Output Tables Transaction (3) Transactions Valued at Producers Prices Tables (4) Transactions Valued at Purchasers Prices (1 ) Input Coefficients at Producers Prices (2) Inverse Matrix Coefficients at Producers Prices [I−(I−M)A]−1 (3) Inverse Matrix Coefficients at Producers Prices [I−Ad]−1 (4) Inverse Matrix Coefficients at Producers Prices (I−A)−1 (5) Domestic Production Induced by Individual Final demand Items (6) Domestic Production Inducement Coefficients (7) Domestic Production Inducement Distribution Ratios (8) Gross Value Added Induced by Individual Final demand Items (1) Gross Value Added Induced (9) Gross Value Added Induced by Individual Final demand Items (2) Main Tables Gross Value Added Inducement Coefficients (10) Gross Value Added Induced by Individual Final demand Items (3) Gross Value Added Inducement Distribution Ratios (11) Imports Induced by Individual Final demand Items (1) Imports Induced (12) Imports Induced by Individual Final demand Items (2) Imports Inducement Coefficients (13) Imports Induced by Individual Final demand Items (3) Imports Inducement Distribution Ratios (14) Imports Coefficients, Input Coefficients of Imported Goods and Services, Total Imports Coefficients and Total Value added Coefficients (1) Trade Margins (2) Domestic Freights (3) Imports (4) Scrap and By−products Supple- (5) Value and Quantity mentary (6) Employeess Engaged in Production Activites (by Occupation) Tables (7) Employment Matrix (Employees Engaged in Production Activites) (by Occupation) (8) Fixed Capital Matrix (Fixed Capital formation) (9) Commodity Output by Industry (Make table) (10) Self−transports by private cars. Producers Prices Purchasers Prices Basic Sector Basic Sector Groups Divisions Sections Groups Divisions Sections Classification Classification 190 108 34 190 108 34 520×407 520×407 ○ ○ ○ ○ ○ ○ ○ ○ ○ ○ ○ ○ ○ ○ ○ ○ ○ ○ ○ ○ ○ ○ ○ ○ ○ ○ ○ ○ ○ ○ ○ ○ ○ ○ ○ ○. ○ ○ ○ ○ ○ ○. ○. ○. ○. ○. ○. ○. ○. ○. ○. ○. ○. ○. ○. ○. ○. ○. ○. ○. ○. ○. ○. ○ ○ ○. ○ ○ ○. ○. ○ ○ ○ Case ○. ○. ○ Case. B. A ○. ○ Case. B. CaseA means Basic Sector Classification by Divisions CaseB means Basic Sector Classification by Groups. 21.
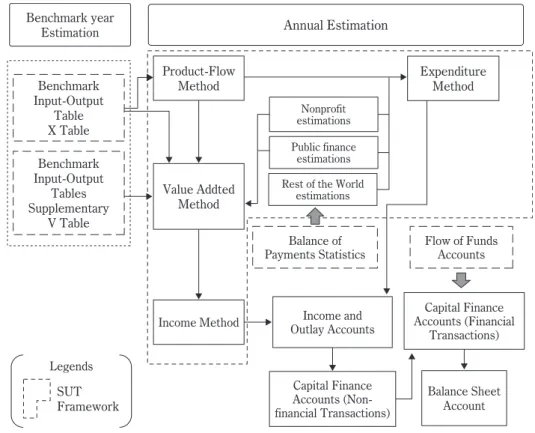
(9) 『統計学』第 104 号 2013 年 3 月. BIOT list. The BIOT has been estimated every. the industry and product classifications in Ja-. five years since 1955 and the JSNA depends on. pan, making it the most important basic statis-. it in the benchmark year.. tic for the JSNA. Thus, the JSNA has long since. Figure 2 depicts a simple flowchart of the es-. developed a system for controlling the BIOT. timation method used by the JSNA and the con-. (termed the Input−Output System in this pa-. nection between the ANA and other statistics.. per). Moreover, South Korea and other Asian. In other benchmark years, the product−flow. countries have introduced this system instead. method would be the most important for the. of the SUT framework of the SNA.. ANA. Because the key accounts in the JSNA. Japanese researchers recently recognized. are of the SNA1968−type, the JSNA excludes. that SUT with a balancing system play an im-. balanced SUT. The BIOT and annual product−. portant role for the Input−Output System, too.. flow method thus play an important role instead. Although the BSUT may not be necessary for. of the balancing system of SUT. However, if the. the Japanese system, the ASUT with a balanc-. JSNA were to introduce the SUT framework to. ing system are more efficient for the JSNA for. the core estimation, there would exist a relation. three reasons. First, the ASUT with a balancing. between the ASUT and BSUT (as depicted by. system improves the consistency of the SNA.. the area within the dotted line in Figure 2).. In the JSNA, huge statistical discrepancies of-. The BIOT as opposed to the SNA controls. ten prevent users from understanding the actu-. Benchmark year Estimation. Annual Estimation. Product-Flow Method. Benchmark Input-Output Table X Table. Expenditure Method Nonprofit estimations Public finance estimations. Benchmark Input-Output Tables Supplementary V Table. Value Addted Method. Rest of the World estimations. Balance of Payments Statistics. Income Method. Flow of Funds Accounts. Income and Outlay Accounts. Capital Finance Accounts (Financial Transactions). Capital Finance Accounts (Nonfinancial Transactions). Balance Sheet Account. Legends. SUT Framework. Figure 2 The JSNA and the Annual SUT(ASUT). 22.
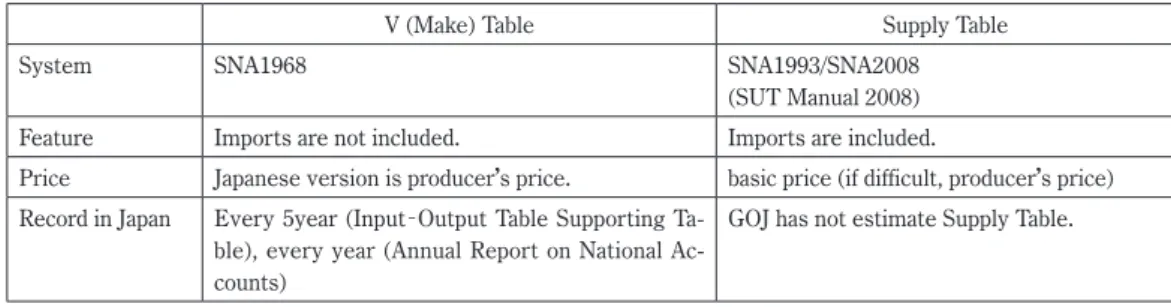
(10) Takeshi SAKURAMOTO. Analysis of IO−based Annual Supply and Use Tables for the development of QNA. al situation. If the ESRI decided to use the. sons: the JSNA has scant experience of estimat-. ASUT and balancing system in the JSNA, this. ing the BSUT and the available financial and. would solve the problem. According to the rec-. human resources are insufficient. If the JSNA. ommendations of the Japanese Statistics Com-. gives up the BIOT to concentrate on the BSUT,. mission, the ESRI analyzed the ASUT with bal-. they would decrease the statistical budget. Fur-. ancing process for the fiscal year of 2012 and. ther, if the JSNA failed to estimate the BSUT. 2013.. accurately, the Ministry of Finance may decide. The JSNA could also supply a consistent an-. to reduce the statistical budget. Thus, it is dan-. nual GDP figure by using the ASUT in the. gerous for the GOJ to allow the JSNA to directly. short−term. This measure would allow the. challenge the BSUT and not to look for other. JSNA to shorten the estimation interval of the. approaches. In Japan, estimating the BSUT calls. balanced time series in the ANA. While JSNA. for the introduction of the SNA1993/SNA2008. users would have to wait five to 10 years to use. for core accounts, which in turn means break-. this consistent and statistically accurate GDP. ing up the key accounts of the JSNA. This paper. value, ASUT users could benefit from annual. calls this problem the Japanese Contradiction.. data without statistical discrepancies within. Indeed, some Input−Output researchers have. three years.. recognized that the JSNA would only introduce. Second, if the JSNA were to introduce the. the BSUT instead of the BIOT as a black joke.. ASUT, the ESRI could publish a consistent. In other words, the introduction of an SNA1993/. GDP figure in advance, namely before the. SNA2008 to core accounts in order to improve. benchmark revision. Therefore, the JSNA. the JSNA would mean destroying the existing. would improve the ANA by adopting the ASUT.. core accounts in the short run. However, in the. As mentioned above, although the time series. long run, both the Japanese Input−Output Sys-. in the JSNA have been published five times in. tem and the SNA1993/SNA2008 as internation-. five years, all the GDP series in the JSNA in-. al standards are crucial for the JSNA. Therefore,. clude statistical discrepancies, including the. to solve the above−described contradiction, we. data in the benchmark year.. must confirm the difference between SNA1968. Third, the ASUT with a balancing system. and the SNA1993/SNA2008 in the SUT frame-. would provide the key infrastructure for the. work.. QNA. If the ESRI were to expand the QNA in the future, the ASUT with a balancing system and the QSUT would be necessary for the. 1−2 The Input−Output and Supply and Use Systems. JSNA. Section 1.2 describes the difference be-. It is important for the estimation of the. tween the Input−Output and the Supply and. ASUT to compare the old frame with the new. Use Systems. Thus, I concentrate on a feature. frame based on SNA1993/SNA2008 and. of the Asian key accounts in the SNA through. SNA1968. Guo, Mark, and BEA (2006) exam-. the JSNA in the next step.. ined the differences in SUT styles between. Instead of introducing the BIOT, the JSNA. SNA1968 and SNA1993. Similarly, Hayashi. could introduce the BSUT, but proceeding with. (1994) compared the Japanese Input−Output. this choice is difficult for the following two rea-. System and Supply and Use System in Japan ac-. 23.
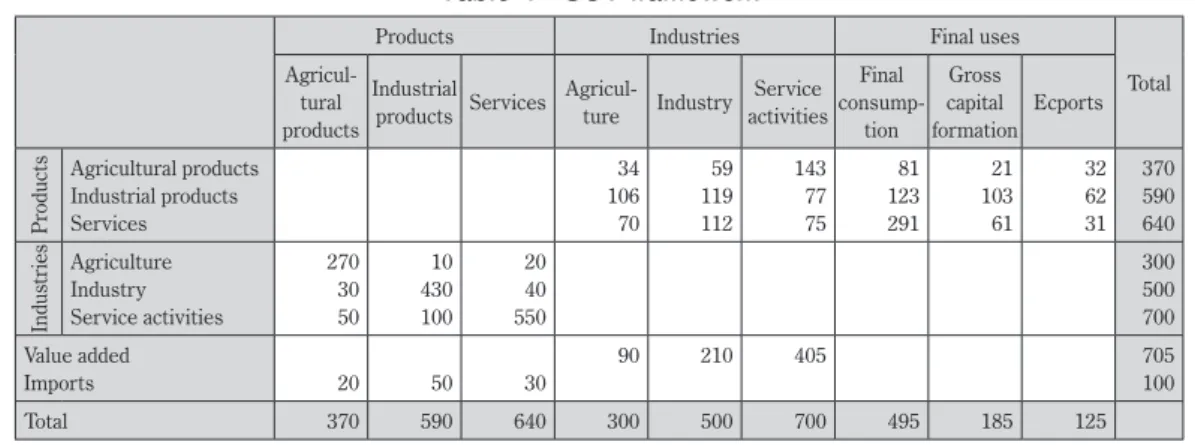
(11) 『統計学』第 104 号 2013 年 3 月. cording to SNA1993 and discussed introducing. SNA1968. Thus, the technical terms can be. SUT without the balancing system. Although. misleading in this area. However, it is important. these two papers are important, it is useful to. to note that there are two kinds of users in the. examine the Japanese Input−Output System. new and old frameworks and that symbols such. and European Supply and Use System further. as X , U , V , and so on are matrixes.. in this section.. It is also useful for us to confirm the differ-. Traditional research has often termed the. ence between SUT in SNA1968 and those in. IOT simply SUT in the SNA1993/SNA2008.. the SNA1993/SNA2008. Table 6 shows that the. Indeed, the United States, Canada, and Japan,. V Table is the inverse matrix of the Supply Ta-. among other countries, still use the old IOT.. ble, which publishes the output (product−by−in-. Many researchers in these countries consider. dustry) matrix. The V and Supply Tables are. the IOT to include the X Table, Make (V) Table,. estimated by the basic price in principle. How-. and Use (U) Table, which are all based on the. ever, if it is difficult to calculate the V Table in. SNA1968 framework. For example, the V Table. terms of the basic price, the producers price is. is an old type of Output (Supply) Table, while. applied. The GOJ estimates the V Table every. the Make (V) and Use (U) Tables are compati-. five years as the supporting table in the BIOT.. 2). ble with the old SUT in SNA1968 .. Further, the ESRI updates the V Table every. Table 4 is called the SUT framework in the. year. Table 7 compares the V and Supply Tables.. SNA1993/SNA2008; however, the SUT frame-. While the former is only an output matrix, the. work was termed the IOT framework in. latter includes an import matrix. In addition, the. Table 4 SUT framework Products. Industries. Final uses. Industries Products. AgriculFinal Gross Industrial AgriculService tural Services Industry consump- capital Ecports products ture activities products tion formation Agricultural products Industrial products Services Agriculture Industry Service activities. Value added Imports Total. 34 106 70 270 30 50. 10 430 100. 20 40 550. 20. 50. 30. 370. 590. 640. 59 119 112. 143 77 75. 81 123 291. 90. 210. 405. 300. 500. 700. Product. Industry. Final Demand. Product. X. U. e. Industry. V. 495. ′means inverse matrix.. 24. Total Output q g. y′ q′. 370 590 640. 705 100. Table 5 IOT framework. Total Input. 32 62 31. 300 500 700. Reference: Eurostat (2008) p.21 Box1.1. Value Added. 21 103 61. Total. g′. 185. 125.
(12) Takeshi SAKURAMOTO. Analysis of IO−based Annual Supply and Use Tables for the development of QNA. Table 6 Japanese Make Table and Supply Table V (Make) Table. Supply Table. System. SNA1968. SNA1993/SNA2008 (SUT Manual 2008). Feature. Imports are not included.. Imports are included.. Price. Japanese version is producer s price.. basic price (if difficult, producer s price). Record in Japan. Every 5year (Input−Output Table Supporting Table), every year (Annual Report on National Accounts). GOJ has not estimate Supply Table.. Table 7 The Comparison between V(Make)Table in SNA1968 and Supply Table in the SNA1993/SNA2008 V Table According to 1968SNA Product 1. Product 2. Supply Table According to 1993SNA or 2008SNA Total Output. Industry A. Industry A. Product 1. Industry B. Product 2. Total Output. Total Output. Industry B. Import. Total Supply. GOJ3) did not estimate the Supply Table in the. JSNA without GFCF (Gross fixed capital forma-. SNA1993/SNA2008.. tion). Therefore, this paper selects the criterion. It is thus necessary to estimate the consum-. that the Supply Table estimation utilized the. er−tax table (a table of a kind of value−added tax. producers price included with consumer−tax.. in Japan) in order to introduce the Supply Table. In other words, the GOJ and this paper neglect. of basic prices. Hayashi (1994) insisted that the. discussions about value−added tax in the area of. GOJ could not estimate the consumer−tax table.. SUT.. However, we argue that users of official statis-. Tables 8 and 9 shows two kinds of Use Ta-. tics can roughly measure the difference be-. bles. The JSNA, rather than the Japanese BIOT,. tween the values with the tax and the values. include the former table in line with SNA1968.. without the tax at the product level. The Minis-. The U Table is the unbalanced Use Table in the. try of Economy, Trade, and Industry tried to es-. SNA1993/SNA2008, which does not agree with. timate the consumer−tax table under a basic. the expenditure side, whose components are. 4). sector classification (520×420) in 2009 . How-. Private final consumption expenditure, GFCF,. ever, this table did not meet the publication s. Government final consumption, Changes in in-. accuracy criterion. Hence, if it is difficult to es-. ventories, Exports, and Imports. The U Table is. timate the Supply Tables of basic prices, the. estimated by the ESRI from the X Table in the. producers price is the next best choice, accord-. BIOT and the V Table in the JSNA using a prod-. ing to SNA1993/SNA2008.. uct−based technology. The GOJ has not esti-. There are two kinds of producers prices.. mated the Use Table in the SNA1993/SNA2008. The GOJ has chosen the producer s price that. and SUT with a balancing system. Thus, the. includes consumer−tax for addition into the. JSNA cannot control the consistency in each. 25.
(13) 『統計学』第 104 号 2013 年 3 月. Table 8 The Variety of Japanese Use Tables U Table. Use Table. System. SNA1968. SNA1993/SNA2008 (SUT Manual 2008). Feature. Final Demand matrix is not included.. Final Demand matrix is included.. Price. purchasers price. purchasers price. Record in Japan. Every 5 years, (Annual Report on National Ac- GOJ has not estimate Use Table. counts). Table 9 The Comparison between U Table in SNA1968 and Use Table in SNA1993/ SNA2008 U Table According to 1968SNA. Use Table According to 1993SNA or 2008SNA. Total Industry Industry Intermediate A B Input. Total The components Industry Industry Total Intermediate of the A B Demand Input expenditure site. Product 1. Product 1. Product 2. Product 2. Total Intermediate Input. Total Intermediate Input. The components of the value addted. The components of the value addted. Total Output. Total Output. GDP perfectly and the BIOT coordinates statis-. lyze the consistency in the SUT framework is. tical discrepancies every five years. Moreover,. necessary. Second, it is important to measure. the JSNA does not include SUT, implying that. the input matrix, and thus the JSNA should con-. the analysis system is not comprehensive.. sider introducing SUT according to the. Figure 3 presents a simple estimation image. SNA1993/SNA2008 to deal with this issue.. of the U Table, which is estimated using the X. Third, the GOJ does not have to introduce a. and V matrixes to use product−based technolo-. new framework to break up the Input−Output. gy every five years in Japan. The BIOT is esti-. System and key accounts in the JSNA since the. mated from many surveys, including the Eco-. former is generally considered to be too big to. nomic Census and Input Surveys. However, it. fail . We rather have to discuss a new frame-. is difficult to measure a product−by−product in-. work to improve the existent system. Fourth,. put matrix directly and thus the BIOT has seri-. the JSNA should introduce SNA2008. Thus, we. ous problems with the accuracy of the input. must consider a new framework that facilitates. matrix.. the introduction of international standards.. Four problems with the JSNA should thus be solved. First, a system that can control and ana-. 26.
(14) Takeshi SAKURAMOTO. Analysis of IO−based Annual Supply and Use Tables for the development of QNA. A Table (Components of X Table) C\C A B e q A 0.1 0.2 3 ** B 0.2 0.3 7 ** F 0.7 0.5 q 1 1. Components of Inverse V Table q C\I Ⅰ Ⅱ A 0.4 0.3 ** B 0.6 0.7 ** 1 1 g’. B Table C\I A B F g’. Use Table C\I A B F g’. Ⅰ Ⅱ 0.16 0.17 0.26 0.27 0.58 0.56 1 1. Ⅰ 3.25 5.25 11.5 20. Ⅱ 5 8 17 30. U=ACg ˆ Make Table I\C A 15 Ⅰ 5 Ⅱ q 20. B g’ 10 25 20 25 30. Figure 3 The Estimation Image of U table. 2. Suggestion for the JSNA. would be able to select plan 2. However, it. 2−1 Provisional Reform: Introduction of an. would need to improve the use matrix and con-. Annual SUT System according to. tinue to estimate the ASUT in that case. The. SNA2008. use matrix would also be a combination of the. This section presents my suggestion for the. product−by−product matrix (X Table) and the. JSNA. Because it would be difficult for the. product−by−industry matrix. This improvement. GOJ5) to introduce the BSUT immediately, this. is similar to the Chinese case. If the GOJ had. paper recommends that the JSNA select two. the courage to formulate the BSUT instead of. solutions from Table 10. Table 10 shows the. the BIOT, plan 3 would be suitable for the. choices available to the GOJ. Although the. JSNA. However, the GOJ has to allocate a suffi-. JSNA has three choices according to this table,. cient financial budget as well as adequate hu-. they cannot choose plans 2 and 3 at once. If the. man resources otherwise plan 3 would be very. JSNA retained the traditional Input−Output. risky and plan 2 would be preferable.. System, plan 2 would be their sole alternative.. Appended figure 1, which is convenient when. Then, the first step would be to introduce the. discussing plan 2, compares Japanese traditional. ASUT matched with the traditional BIOT.. accounts and the country s new accounts based. Moreover, the JSNA would need to overcome. on Figure 5.2 in Eurostat (2008, p.126). This. the many problems to improving the ASUT.. figure shows the European accounts. However,. The second step comprises two choices for. appended figure 1 explains the new Input−Out-. the JSNA. If the JSNA continue to utilize the. put System as opposed to the Supply and Use. Japanese Input−Output System, the GOJ 6). System. The new system is represented by the. 27.
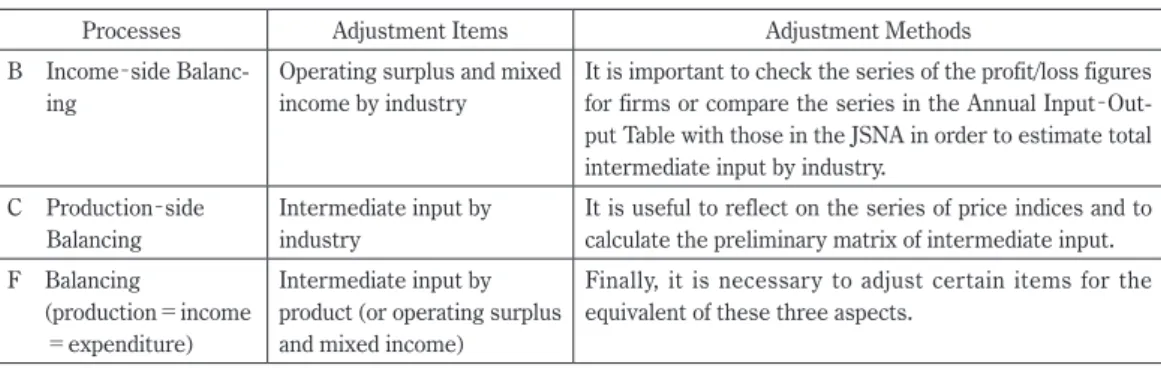
(15) 『統計学』第 104 号 2013 年 3 月. Table 10 Three Choices for GOJ Plan 1: Continue to estimate Input −Output System. Plan 2: Develop New Input− Output System. Plan 3: Change over to Supply and Use System. Target to estimate. Make and Use Tables, and Input− Output table (product by product). Improved BIOT and ASUT. BSUT and ASUT. Standards. Traditional East Asian standard (1968SNA). The original style. International standard (1993SNA or 2008SNA). Advantage. No efforts. JSNA can utilyze ASUT for QNA and the system consistency without the little effort.. JSNA can introduce updated SNA to the core accounts perfectly.. Defect. The core system in JSNA can t JSNA can t include BSUT. But incrudes updated SNA. JSNA can t if JSNA has the BIOT and control the consistency in SNA and ASUT, BSUT is not neccesary. can t explore QNA without SUT.. Without the sufficient resorce, JSNA break the existent Input− Output System.. colored area in the background in appended fig-. Second, the JSNA needs to analyze the sec-. ure 1, namely the ASUT and QSUT. The two. ond main cause of the statistical discrepancy in. kinds of SUT include an unbalanced table and a. the ASUT framework. In order for the JSNA to. balanced table.. strike the right balance, the SUT area must be. Plan 3 may be the best choice for the JSNA in. divided into two areas, namely the production. terms of international standards; however, the. and the income side, to recalculate the prelimi-. choice will be difficult for the JSNA to introduce. nary value of the expenditure side. In each. in the short run. Thus, this paper supposes that. case, it is necessary for balancers7)to unite and. the JSNA will introduce plan 2. Section 2−2 de-. readjust these two areas.. scribes a rough image of the balancing system. In order to estimate the ASUT, I have to omit. in the JSNA according to plan 2 (i.e., a new. steps B and C in Figure 4 and utilize the auto-. Input−Output System).. matic balancing method instead of steps D and E. Appended table 1 shows the (unbalanced and. 2−2 Balancing System in the ASUT. balanced) Supply Tables. I roughly calculated. This section presents my suggestion for the. the CIF/FOB adjustment and decided on the. Japanese balancing system in the ASUT. In Fig-. preliminary value of the product−flow method. ure 4, there are six procedures (A−F) that all. before the calculation of appended table 1. Ap-. aim to balance the unbalanced ASUT with the. pended table 2 is the unbalanced Use Table,. balanced ASUT. Moreover, there are two kinds. while appended table is the balanced Use Table.. of statistical discrepancies. First, the inconsis-. Because this estimation does not use internal. tency between the Cost of Insurance Freight. JSNA data, it cannot cover all ASUT processes.. (CIF) and Free on Board (FOB) is the cause.. Further, the levels of the industry and product. The Japanese product−flow method includes. classifications are only roughly estimated. How-. CIF in its import series; however, Japanese. ever, the purpose of this estimation is purely to. BOP includes the FOB−based series but not. present a simple image of the core accounts for. CIF. If the JSNA were to introduce the ASUT, it. the JSNA.. would need to control the CIF/FOB adjustment. If the ESRI were to introduce a balancing. perfectly.. process to the core accounts of ANA, it should. 28.
(16) Takeshi SAKURAMOTO. Analysis of IO−based Annual Supply and Use Tables for the development of QNA. Ⅱ The area of production and income adjustment B Income-side Balancing 1. Set the preliminary value of operating surplus and mixed income to use the series of Financial Statements Statistics of Corporations by Industry and so on. Total intermediate input. Ⅰ The area of demand and supply adjustment Calculated coefficients. Calcuculation of Operating surplus and mixed income. Calculated the expenditure coefficients. Inform Total intermediate input. A First Demand and Supply Balancing 1. Calculation in the product-flow method for CIF/FOB adjustment. D Expenditure-side Balancing Utilize the coefficients in Annual Input-Output Table, Adjustment Adjust ment of of Intermediate Input, Utilize the distribution statistics, Automatic Distribution Ratio adjustments. E Second Demand and Supply Balancing 2. Calculation in the product-flow method for inventries and margins. C Production-side Balancing 2. Set the preliminary value of intermediate input to utilize the intermediate comsumption, and price indices. Adjustment for Intermediate input. Calculated the expenditure coefficients. 3. Time series check for Household consumption and GFCF, Adjust ment of Devide Ratio. After stepⅠ and Ⅱ, the intermediate input equals to the intermediate comsumption. The JSNA can adjust operating surplus and mixed income in Industries‘Unable to Classify’ , the intermediate input and the intermediate consumption in Products‘Unable to Classify’of Industries‘Unable to Classify’ , The JSNA realizes equivalent of three aspects.. F Balancing (production=income=expenditure). Figure 4 Suggestion for a balancing system for the ASUT in Japan. Table 11 Balancing Processes in the first area of the ASUT Part 1 Processes. Adjustment Items. Adjustment Methods. A First Demand and Supply Balancing. Exports and imports. This step aims to calculate the preliminary values of the product−flow method after using the value of the Second Annual Report on the National Accounts to deal with the CIF/FOB adjustment.. D Expenditure−side Balancing. Domestic final consumption expenditure of households, GFCF, and intermediate consumption. In this step, some kind of automatic balancing is convenient. This step aims to estimate the intermediate input as well as the ratios of domestic final consumption expenditure of households, GFCF, and intermediate consumption in the product−flow method.. E Second Demand and Supply Balancing. Trade and transport margin and total supply. This step aims to adjust the margins and values of the product−flow method.. Table 12 Balancing Processes in the second area of the ASUT Part 2 Processes. Adjustment Items. Adjustment Methods. B Income−side Balancing. Operating surplus and mixed income by industry. It is important to check the series of the profit/loss figures for firms or compare the series in the Annual Input−Output Table with those in the JSNA in order to estimate total intermediate input by industry.. C Production−side Balancing. Intermediate input by industry. It is useful to reflect on the series of price indices and to calculate the preliminary matrix of intermediate input.. F Balancing (production=income =expenditure). Intermediate input by Finally, it is necessary to adjust certain items for the product (or operating surplus equivalent of these three aspects. and mixed income). 29.
(17) 『統計学』第 104 号 2013 年 3 月. develop the third annual report on national accounts, as this will be the best timing for the process of annual balancing. The second annual. Table 13 Secondary Products Ratio by country Country/Year. 2000. 2001. 2002. 2003. report does not incorporate the final publication. Belgium. 11.9. 14.7. 15.2. −. of the Industry Survey (or the Economic Cen-. Slovakia. 16.5. −. 13.6. −. Germany. 5.4. 5.4. 5.4. −. sus) nor the Annual Input−Output Table, which is necessary information for the annual balancing process. In particular, the Annual Input−. Spain. 4.9. −. −. −. France. 1.9. 1.8. −. −. Output Table includes the coefficients of the in-. United Kingdom. 6.1. 6.0. 5.8. 5.5. EU. 6.3. 6.3. 6.8. 7.4. termediate matrix. Even though the JSNA does. Japan. 0.9. 0.9. 0.9. 0.9. not cooperate with the Annual Preliminary Input−Output Table and Annual Input−Output. Reference: Table 11.8 from Eurostat (2008) and Supporting Table 4 from ESRI (2010). Table, it should use comprehensive information in the balancing process, as published by the Ministry of Economy, Trade, and Industry.. Table 14 The Situation of QNA by country Country/Side Canada. 2−3 Improvements to the Input−Output System Many problems related to the JSNA should be discussed here in order to improve the new Japanese Input−Output System. First, the GOJ8) cannot utilize current tax information within its. Production Expenditure ○. ○. Income ○. USA. ○. ○. Japan. ○. △ (3) ○. Australia. ○. ○. New Zealand. ○. ○. Austria. ○. ○ (1). Denmark. ○. ○. Finland. ○ (2). ○. ○. (1). ○ (2). France. ○. ○ (1). ○ (2). Germany. ○. ○. (1). ○ (2). value−added tax system, and even the Ministry. Itary. ○. ○. (1). of Finance cannot measure accurate tax infor-. Netherlands. ○. ○ (1). mation through this simple framework. If the. Norway. ○. ○ (1). GOJ9)were to introduce a national number sys-. Spain. ○. ○ (1). Sweden. ○. ○. Switzerland. ○. ○ (1). Turkey. ○. ○. United Kingdum. ○. ○. calculations. For example, it has adopted a consumer−tax as its simple system rather than a. tem called My number and value−added tax, this information would be necessary for the balancing process of the JSNA. Second, the secondary products ratio in the V Table of the JSNA is unusual. This ratio represents the value of secondary products divided by output (primary products+secondary prod-. ○ (2). ○. (1) Changein Inventories is estimated as the residual. (2) Operating surplus is estimated as the residual. (3) The time series in the income area is the only Compensation of Employees. Reference: OECD (Unidentified) Table 1. ucts). Table 13 compares the secondary products ratios of selected developed countries. The. riously. For example, although many Japanese. Japanese value of only approximately 0.9% im-. companies innovate in the area of electricity. plies that the Japanese Input−Output System. generation, this series cannot follow such tech-. must begin to measure secondary products se-. nology breakthroughs.. 30.
(18) Takeshi SAKURAMOTO. Analysis of IO−based Annual Supply and Use Tables for the development of QNA. Table 15 The Comparison of Human resource in some countries Share of Development Purchasing Formal General Corporations Financial Rest of the Regional Productivity Satellite Other very qualiof special Power Staffs Government Sector Accounts World accounts numbers accounts Activities fied Staff statistics Parities Australia Canada. 54. 2. 1. 4. 1. n.a.. 162. n.a.. n.a.. n.a.. n.a.. n.a.. ○. ○. ○. ○. ○. ○. ○. ○. ○. ○. ○. ○. China. 31. 1. 1. 3. 0.2. 100%. France. 127. 29. 18. 14. 1. 40.2%. Germany. 105. 10.4. 2. 7. 2. 22.3%. ○. Japan. 47. 4.5. 5.5. 1. 0.5. 63.8%. ○. Korea. 90. 5. 2. 9. 2. n.a.. Netherlands. 96. 7. 2. 6. 1. 74.2%. ○. United Kingdom. 107. 16. 11. 14. 16. n.a.. ○. USA. 174. 32. 4. 14. 2. n.a.. ○. ○. ○. ○. ○. ○. ○. ○. ○ ○. ○. ○. ○. Unit: Number of Members Reference: Lequiller and Zorn (2007) Table 1 and Table 3. Third, the only expenditure side in the QNA. this suggestion is only one of a number of. is displayed in the JSNA. Table 14 shows that it. choices available in Japan. Moreover, if the GOJ. faces difficulties keeping up−to−date in the area. elected to combine the ASUT and the BIOT in. of the QNA. Although it has tried to estimate. the future, the next SNA (SNA2023?) would. GDP using production and income approaches. need to cover the new Supply and Use System.. in the QNA, the JSNA does not currently use. There are five principal advantages to the. the ASUT with a balancing process or the. JSNA introducing the balanced ASUT. First, the. QSUT. In the future, it will be necessary to de-. ESRI would have the capability to estimate bal-. velop the QSUT to be consistent with the. anced and consistent GDP figures within only. ASUT.. three years compared with the current delay. Fourth, it will be important for the JSNA to. between Japanese benchmark revisions (i.e.,. publish sufficient information on other coun-. every five years). Further, new benchmark se-. tries, because other Asian countries have simi-. ries are released every 5−10 years for the ANA. lar systems to the Japanese Input−Output Sys-. report. Second, a balancing system would con-. tem. Fifth, the current level of human resources. tribute to improving the estimation process of. is insufficient in the JSNA (Table 15), making it. the JSNA, as each (individual) check system in. necessary to increase the number of experts in. the JSNA now tends to be inconsistent.. the future.. Third, the JSNA would fulfill the recommendations of the SNA1993/SNA2008 by imple-. 3. Conclusion. menting the balanced ASUT, which depend on. This paper examined the current situation in. the satellite BIOT instead of on core accounts,. Japan compared with international standards. such as SUT. Fourth, the ESRI would be able to. and made suggestions in order to improve the. estimate the QSUT and thus utilize the ASUT.. core system of the JSNA. In brief, it concluded. The QSUT would also be useful for providing a. that a combination of the ASUT and the BIOT. consistent series of quarterly GDP and stable. may be the best choice for the JSNA to follow in. estimations of the QNA. The ESRI would fur-. the future. However, it is important to note that. ther be able to develop new statistics and QNA. 31.
(19) 『統計学』第 104 号 2013 年 3 月. series in order to utilize the QSUT. Fifth, the. those in Japan, this process might also provide. experience of the ASUT would be necessary to. a template for development in those nations.. estimate the BSUT if in the future the GOJ. Following statistical reforms in Japan, the JSNA. wished to do so. However, if the GOJ chose to. is improving gradually. Although the GOJ has. improve the use matrix (plan 2) instead of the. many possible directions, it does not have com-. BSUT (plan 3), it can use the experience of the. plete freedom over the Japanese Input−Output. ASUT in order to balance the estimation of the. System. Therefore, if the ANA were to include. use matrix.. the ASUT and a balancing process in the core. Thus, this study finds that the ASUT with a. accounts, this approach could expand the Japa-. balancing process is crucial for the future of the. nese QNA. The future choices of the JSNA. JSNA. Further, because other Asian countries. would then depend on the degree of expansion.. such as South Korea face similar problems to. Acknowledgement This paper was funded by the special research fund (Tokubetukenkyujyosei) of Matsuyama University in the fiscal year of 2012. I thank the fund, and Susumu Kikuchi (Professor of Rikkyo Univ), Ryuzo Kuroki (Professor of Rikkyo Univ), Itsuo Sakuma (Professor of Senshu Univ), Li Jie (Professor of Saitama Univ), Michael Osterwald−Lenum (Statistics Denmark), Colin A Gaffney, Hidehiko Futamura (ESRI), Kosuke Suzuki (ESRI), Hideaki Kitaki (ESRI), Minoru Nogimori (ESRI), and many commenters.. Notes 1 )BIOT includes some classifications. The output is measured by 10−digit (3571 products). The basic industry classification is 6−digit (407 activities (products)) or 7−digit (520 activities (products)). 2 )To be exact, SUT was similar to the Make (Output) and Use Tables in SNA1968. 3 )All the ministries. 4 )See Arai (2010). 5 )All the ministries, mainly, The Economic and Social Research Institute (ESRI), Cabinet Office and Director−General for Policy Planning (Statistical Standards), Ministry of Internal Affairs and Communications 6 )All the ministries, mainly, The Economic and Social Research Institute (ESRI), Cabinet Office and Director−General for Policy Planning (Statistical Standards), Ministry of Internal Affairs and Communications 7 )Balancers are experts that deal with the balancing system in national accounts. There are no balancers in Japan nowadays. 8 )All the statistical offices. 9 )All the ministries.. References Bank of Japan (2006a), Guide to Japan s Flow of Funds Accounts , the website of Bank of Japan, http://www.boj.or.jp/en/statistics/outline/exp/exsj01.htm/ Bank of Japan (2006b), The Compilation of Japan s Flow of Funds Accounts , the website of Bank of Japan,. 32.
(20) Takeshi SAKURAMOTO. Analysis of IO−based Annual Supply and Use Tables for the development of QNA. http://www.boj.or.jp/en/statistics/outline/exp/exsj02.htm/ Bank of Japan (2011a), Explanation of Balance of Payments Statistics , the website of Bank of Japan, http://www.boj.or.jp/en/statistics/outline/exp/exbs02.htm/ Bank of Japan (2011b), Japan s Balance of Payments for 2009 , the website of Bank of Japan, http://www.boj.or.jp/en/research/brp/ron_2010/ron1006a.htm/ Director−General for Policy Planning (Statistical Standards), Ministry of Internal Affairs and Communications, and 10 organizations (2009), 2005 Input−Output Tables for Japan , the website of Ministry of Internal Affairs and Communications http://www.stat.go.jp/english/data/io/index.htm Economic Planning Agency (2000), Wagakunino 93SNA henoikounitsuite , the website of ESRI, http://www.esri.cao.go.jp/jp/sna/sankou/kouhou/001115/93snamenu.html, Japanese only Economic and Social Research Institute (2005), Estimation Method of Preliminary Quarterly GDP (QE) , the website of ESRI, http://www.esri.cao.go.jp/en/sna/sankou/050721/method.html Economic and Social Research Institute (2010, 2011), Annual Report on National Accounts , the website of ESRI, http://www.esri.cao.go.jp/en/sna/data/kakuhou/files/kako_top.html Eurostat (2008), Eurostat Manual of Supply, Use and Input−Output Tables−2008 edition , the website of Eurostat http://epp.eurostat.ec.europa.eu/cache/ITY_OFFPUB/KS-RA-07-013/EN/KS-RA-07-013EN.PDF Guo, Jiemin and Mark A. Planting, Bureau of Economic Analysis (2006), Integrating U.S. Input−Output Tables with SNA: Valuations and Extensions , The 29th Conference of The International Association for Research in Income and Wealth Website http://www.iariw.org/c2006.asp Hideki Hayashi (1994), kaitei−SNA ni okeru tonyusansyutuhyo taikei ni tsuiteno itikosatsu Journal of Economics in Niigata University International Monetary Fund (2006), Japan: Report on Observance of Standards and Codes−Data Module, Response by the Authorities, and Detailed Assessments Using the Data Quality Assessment Framework (DQAF) , Website of IMF, the website of IMF, http://www.imf.org/external/pubs/ft/scr/2006/cr06115.pdf Lequiller, François and Hendrik Zorn (2007), SURVEY ON NATIONAL ACCOUNTS RESOURCES SUMMARY OF THE RESULTS , the paper for Working Party on National Accounts OECD (Unidentified), QUARTERLY NATIONAL ACCOUNTS , the website of OECD http://www.oecd.org/dataoecd/57/36/1909562.pdf Sonoe Arai (2010), 2005nen sangyorenkanhyo no kihonkakakuhyo ni tuite , keizaisangyokenkyu, No. 38 (4), pp.148−167. Takeshi Sakuramoto (2012a), Nihon no kokuminkeizaikeisantaikei ni okeru kyokyushiyohyo ni kansuru kenkyu , New ESRI Working paper, No. 26 http://www.esri.go.jp/jp/archive/new_wp/new_wp030/new_wp026.pdf Takeshi Sakuramoto (2012b), Analysis of IO−based Annual Supply and Use Tables for the Development of QNA−The Japanese Paradox between 1968 SNA and updated SNA http://www.iariw.org/papers/2012/SakuramotoPaper.pdf United Nations (1999), HANDBOOK OF INPUT−OUTPUT TABLE COMPILATION AND ANALYSIS, Series F, No. 74 United Nations, Commission of the European Communities/Eurostat, International Monetary Fund, Organisation for Economic Co−operation and Development, and World Bank (1994), The System of National Accounts 1993, the website of United Nations http://unstats.un.org/unsd/sna1993/toctop.asp United Nations Statistics Division (2008), International Standard Industrial Classification of All Economic Activities, Rev.4, the website of United Nations, http://unstats.un.org/unsd/cr/registry/regcst.asp?Cl=27 United Nations, European Commission, International Monetary Fund, Organisation for Economic Co− operation and Development, and World Bank (2009), The System of National Accounts 2008, Website of United Nations, http://unstats.un.org/unsd/snaSNA1993rev1.asp. 33.
(21) 34. Make Table. Use Table (unbalanced). Use Table at purchaser’ s price (balanced). Supply Table (unbalanced). Supply Table at produser’ s price (balanced). Goods and services account. Total economy. Production approach (balanced). Income approach (balanced). Production account. Distribution and use of income accounts. Accumulation accounts. Sector accounts 1. Non-financial corporations 2. Financial corporations 3. General government 4. Households 5. Non-profit institutions serving households. Expenditure approach (balanced). Gross domestic product. Annual Balancing. GDP (Production) GDP (Expenditure) GDP (Income) (unbalanced) (unbalanced) (unbalanced). Accounts. Annual National Accounts. Use Table (unbalanced). Quarterly Supply and Use Tables area. Supply Table (unbalanced). Quarterly supply and use system. Reference: Modified Eurostat (2008) P.126 Figure 5.2 for this paper s subject. GDP (Income) (unbalanced). Total economy and sector accounts. GDP (Production) GDP (Expenditure) (unbalanced) (unbalanced). Accounts. Quarterly National Accounts. Appended Figure 1 The Suggestion of Provisional Reform: Japanese BIOT and Annual SUT in JSNA. Proposal frow at annual system. Current frow at annual system. Current frow at every 5 year. (Annual) Supply and Use Tables area. every 5 year. X Table. Benchmark Input and Output Tables Annual supply and use system. Japanese System of National Accounts. 『統計学』第 104 号 2013 年 3 月.
(22) 0.0. 0.0. Direct purchases abroad by resident households. (less) Direct purchases in the domestic market by non−resident households. 15455.1. 0.0. 0.0. 0.0. 0.0. 83.3. 0.0. 0.0. 0.0. 572.6. 0.0. 0.0. 6.3. 0.0. 0.0. 0.0. 0.0. 0.0. 0.0. 0.0. 0.0. 0.0. 0.0. 0.0. 518.8. 525.1. 0.0. 14274.1. 15455.1. 1371.9. 0.0. 0.0. 0.0. 0.0. 0.9. 0.0. 0.0. 0.0. 0.0. 6.0. 0.0. 0.3. 0.0. 0.0. 0.0. 0.3. 0.0. 1.6. 10.3. 2.1. 0.0. 0.0. 0.0. 0.0. 14.6. 1345.4. 5.0. 1371.9. 301980.2. 0.0. 0.0. 0.0. 0.0. 812.0. 0.0. 0.0. 0.0. 3.2. 1103.2. 0.0. 41192.3. 3912.0. 41885.5. 53463.8. 28432.1. 13422.3. 23276.5. 8306.1. 13749.0. 25708.8. 8748.4. 2828.7. 34995.1. 299920.6. 115.0. 26.2. 301980.2. (3) Manufacturing. Reference for Annual Report on National Accounts of 2010 Supporting Tables (1) and (4). 751731.0. 0.0. 3. Producers of private non−profit services to households. Gross output. 0.0. 2. Producers of government services. 177330.1. 41373.7. m. Others. (10) Service activities. 3912.0. l. Precision instruments. 43543.0. 42413.9. k. Transport equipment. (9) Transport and communications. 53463.8. j. Electrical machinery, equipment and supplies. 64407.4. 28432.4. i. Machinery. (8) Real estate. 13422.3. h. Fabricated metal products. 42857.1. 23274.7. g. Basic metal. (7) Finance and insurance. 8319.0. f. Non−metallic mineral products. 1500.7. 13763.1. e. Petroleum and coal products. (6) Wholesale and retail trade. 25708.9. d. Chemicals. 77976.9. 8751.2. c. Pulp, paper and paper products. 24591.3. 2828.7. b. Textiles. (5) Electricity, gas and water supply. 38047.3. (4) Construction. 303711.0. 1460.5. (2) Mining. a. Food products and beverages. 14353.0. (1) Agriculture, forestry and fishing. (3) Manufacturing. 751731.0. 1. Industries. Products (Goods and Services), Industry, (Billion Yen). (1) Agricul(2) 1. ture, Mining Industries forestry and fishing. 34915.2. 0.0. 0.0. 0.0. 0.0. 1.1. 0.0. 0.0. 0.0. 3.2. 0.0. 0.0. 9.8. 0.0. 0.0. 0.0. 3.7. 0.6. 0.0. 0.5. 0.4. 102.0. 3.3. 0.8. 34787.5. 34908.6. 0.0. 2.3. 34915.2. 2774.7. 0.0. 0.0. 0.0. 0.0. 1.2. 0.0. 0.0. 0.0. 0.0. 1.9. 0.0. 39.3. 0.6. 6.0. 0.7. 1.3. 0.6. 0.5. 2.2. 0.0. 4.8. 12.7. 2700.1. 0.1. 2768.9. 0.0. 2.7. 2774.7. a. Food b. products Textiles and beverages. 8990.0. 0.0. 0.0. 0.0. 0.0. 1.1. 0.0. 0.0. 0.0. 0.0. 267.4. 0.0. 123.5. 0.0. 0.1. 2.7. 3.6. 4.2. 0.5. 3.0. 0.0. 30.6. 8521.6. 17.7. 2.4. 8709.9. 0.0. 11.6. 8990.0. 26583.4. 0.0. 0.0. 0.0. 0.0. 2.9. 0.0. 0.0. 0.0. 0.0. 436.3. 0.0. 198.5. 68.6. 6.2. 74.4. 39.0. 4.2. 40.5. 163.9. 203.4. 25028.8. 70.7. 38.0. 195.9. 26132.1. 12.1. 0.0. 26583.4. c. Pulp, paper d. and paper Chemicals products. 13394.9. 0.0. 0.0. 0.0. 0.0. 0.4. 0.0. 0.0. 0.0. 0.0. 55.9. 0.0. 2.0. 0.0. 0.0. 1.4. 1.0. 0.3. 0.1. 7.0. 13162.2. 154.0. 0.0. 0.0. 0.1. 13328.1. 10.5. 0.0. 13394.9. 8267.6. 0.0. 0.0. 0.0. 0.0. 3.6. 0.0. 0.0. 0.0. 0.0. 64.7. 0.0. 57.3. 4.8. 1.5. 75.8. 16.1. 11.0. 14.4. 7944.3. 7.9. 15.7. 10.2. 0.1. 1.2. 8160.3. 39.0. 0.0. 8267.6. f. e. Non− Petroleum metallic and coal mineral products products. 24206.9. 0.0. 0.0. 0.0. 0.0. 6.3. 0.0. 0.0. 0.0. 0.0. 227.1. 0.0. 40.7. 3.2. 15.1. 168.1. 79.4. 373.6. 22709.9. 48.3. 374.0. 104.7. 1.7. 1.4. 0.1. 23920.2. 53.3. 0.0. 24206.9. 13158.7. 0.0. 0.0. 0.0. 0.0. 51.5. 0.0. 0.0. 0.0. 0.0. 2.8. 0.0. 242.8. 9.7. 67.9. 113.9. 274.2. 12251.5. 113.3. 23.7. 0.1. 2.8. 1.6. 2.7. 0.2. 13104.4. 0.0. 0.0. 13158.7. 28896.5. 0.0. 0.0. 0.0. 0.0. 413.4. 0.0. 0.0. 0.0. 0.0. 3.2. 0.0. 151.1. 173.8. 819.3. 748.6. 25984.0. 399.8. 111.9. 7.9. 0.5. 80.4. 1.6. 0.1. 0.9. 28479.9. 0.0. 0.0. 28896.5. h. g. Fabricated i. Basic metal metal Machinery products. 54083.0. 0.0. 0.0. 0.0. 0.0. 184.5. 0.0. 0.0. 0.0. 0.0. 12.0. 0.0. 421.6. 291.4. 299.3. 51390.9. 1104.8. 113.2. 154.7. 61.6. 0.0. 28.5. 16.2. 4.1. 0.2. 53886.5. 0.0. 0.0. 54083.0. 42084.8. 0.0. 0.0. 0.0. 0.0. 67.2. 0.0. 0.0. 0.0. 0.0. 11.8. 0.0. 253.1. 21.9. 40468.9. 281.3. 728.2. 149.0. 92.9. 1.9. 0.0. 6.3. 1.1. 1.2. 0.0. 42005.8. 0.0. 0.0. 42084.8. j. Electrical k. ma− Transport chinery, equipment equipment and supplies. Appended Table 1 Supply Table(unbalanced, calendar year 2000, Billion yen)Part 1. 3828.4. 0.0. 0.0. 0.0. 0.0. 47.8. 0.0. 0.0. 0.0. 0.0. 2.4. 0.0. 29.7. 3324.4. 75.5. 241.7. 73.5. 9.0. 5.1. 3.6. 0.0. 13.7. 0.1. 0.0. 1.9. 3778.2. 0.0. 0.0. 3828.4. l. Precision instruments. 40796.1. 0.0. 0.0. 0.0. 0.0. 31.0. 0.0. 0.0. 0.0. 0.0. 17.7. 0.0. 39622.9. 13.6. 125.7. 364.3. 123.3. 105.3. 32.7. 38.2. 0.5. 136.5. 107.6. 62.5. 4.6. 40737.7. 0.1. 9.6. 40796.1. m. Others. 77711.4. 0.0. 0.0. 0.0. 0.0. 0.0. 0.0. 0.0. 0.0. 0.0. 77705.5. −0.4. 0.0. 0.0. 0.0. 0.0. 0.0. −3.4. 0.0. 0.0. 0.0. 0.0. 0.0. 0.0. −3.8. 0.0. 9.7. 77711.4. (4) Construction. Takeshi SAKURAMOTO Analysis of IO−based Annual Supply and Use Tables for the development of QNA. 35.
図
+5


関連したドキュメント
Tank Mixtures (Preplant/Preemergence) for Roundup Ready Flex Cotton For Control of Annual Weeds in a Residual Herbicide Tank Mix: Refer to the ANNUAL WEEDS CONTROLLED section, Tables
For use in general farmstead (non-cropland) and sod farms, apply 3 – 32 fluid ounces of DICAMBA HD per acre to control or suppress growth of many annual, biennial, and some
For use in general farmstead (noncropland) and sod farms, apply 3 - 32 fluid ounces of Clarifier ® herbicide per acre to control or suppress growth of many annual, biennial, and
Low humidity and high temperature increase the evaporation rate of spray droplets and therefore the likelihood of increased spray drift to aquatic areas. Avoid spraying
Amount of Remuneration, etc. The Company does not pay to Directors who concurrently serve as Executive Officer the remuneration paid to Directors. Therefore, “Number of Persons”
Apply Poast ® herbicide to actively growing grass weeds by aerial or ground application at the rates and timing (maxi- mum height) listed in Table 4 (annual grass weeds), Table
Applications should be made using the same rates and at the same growth stages as listed in the weed control tables or use a 0.75% solution for annual weeds and quackgrass and a
Provided V IO supply is present together with either V BAT or V CC , the digital output ERRN indicates the state of the internal “Error” flag when in Normal mode and the state of
