Development and Application of a Novel
Technology for Evaluation of Personal Exposure and Online Monitoring of Environmental Aerosol Nanoparticles
著者 タニアパット ソンゲン
著者別表示 Thunyapat Thongyen journal or
publication title
博士論文本文Full 学位授与番号 13301甲第4155号
学位名 博士(学術)
学位授与年月日 2014‑09‑26
URL http://hdl.handle.net/2297/40535
Creative Commons : 表示 ‑ 非営利 ‑ 改変禁止 http://creativecommons.org/licenses/by‑nc‑nd/3.0/deed.ja
Dissertation
Development and Application of a Novel Technology for Evaluation of Personal Exposure and Online Monitoring of
Environmental Aerosol Nanoparticles
THUNYAPAT THONGYEN
Division of Environmental Science and Engineering Graduate School of Natural Science and Technology
Kanazawa University
Academic Year 2014
Dissertation
Development and Application of a Novel Technology for Evaluation of Personal Exposure and Online Monitoring of
Environmental Aerosol Nanoparticles
Graduate School of Natural Science and Technology Kanazawa University
Major subject: Environmental Science and Engineering Student ID No: 1123142412
Name : Thunyapat Thongyen
Chief advisor: Prof.Dr.Furuuchi Masami
Table of Contents
Chapter 1 Introduction
1.1 Aerosol Particles 1
1.2 Nanoparticle Exposure and Health Effects 2
1.3 Nanoparticles Measuring Instruments 3
1.4 Principle of Inertial Filter 4
1.5 Personal Sampler for Evaluating of Ultrafine Particles Using 6 Inertial Filter Technology
1.6 Objective of Research 10
1.7 Contents of Research 10
Chapter 2 Development of PM
0.1Personal Sampler for Evaluation of Personal Exposure to Aerosol Nanoparticles
2.1 Introduction 12
2.2 Inertial Filters and Pre-cut impactors 14
2.3 Experiments 18
2.4 Results and Discussion 23
2.5 Conclusion 29
Chapter 3 Exposure Assessment of Aerosol Nanoparticles and Chemical Compounds in Living and Working Environments
3.1 Introduction 30
3.2 Devices for Evaluation of Personal Exposure 31
3.3 Environments Discussed 34
3.4 Procedure 39
3.5 Results and Discussion 42
3.6 Conclusion 52
Chapter 4 Online Monitoring of PM
0.1Number Concentration and Particle-bound Black Carbon Using PM
0.1Inertial Filter
4.1 Introduction 54
4.2 PM
0.1Separation Unit 55
!
ii4.3 Proposed Monitoring System 55
4.4 Experiments 57
4.5 Results and Discussion 59
4.6 Conclusion 63
Chapter 5 Conclusion 64
References 65
Acknowledgement 69
List of Figure Captions
Fig. 1.1 Concentration of number, surface area and volume by particle diameter.
Fig. 1.2 Exposure ratio of particles in human respiratory system.
Fig. 1.3 Single fiber collection mechanisms for fibrous filter.
Fig. 1.4 Principle of inertial filtration.
Fig. 1.5 Inertial filters for a personal nanosampler.
Fig. 1.6 Schematic of Personal Nanosampler
Fig. 1.7 Collection efficiency curves of inertial filters of PNS inlet type No.1 and No.2.
Fig. 2.1 Schematic of the main inertial filter.
Fig. 2.2 TEM grid (Glider, G600HSS)
Fig. 2.3 ATPS-20H Shibata Scientific Technology).
Fig. 2.4 PM
0.1personal sampler inlet and inertial filters used: (a) an outside picture and structure of PM
0.1personal sampler inlet, (b) the pre-cut inertial filter and stainless steel (SUS) fibers used, (c) the main inertial filter (layered mesh geometry).
Fig. 2.5 Portable HARIO pump (HARIO, HSP-5000).
Fig. 2.6 Relationship between a pressure drop and flow rate of two type of portable pump; HARIO pump (HARIO, HSP-5000) for the PM
0.1personal sampler and SKC pump for the personal nanosampler.
Fig. 2.7 Experimental setup for the inertial filter performance test.
Fig. 2.8 Measured density of generated ZnCl
2particles.
Fig. 2.9 Experimental setup for the pre-cut impactors performance test.
Fig. 2.10 Dust for industrial testing No.5 (JIS No.5).
Fig. 2.11 Density of incense smoke particles.
Fig. 2.12 Nanosampler (Kanomax, Model 3180): (a) Appearance of nanosampler (b) Structure of nanosampler.
Fig. 2.13 Collection efficiency curves for the pre-cut impactors, the pre-cut inertial filter and the main inertial filter and the combination of the pre-cut and main inertial filters.
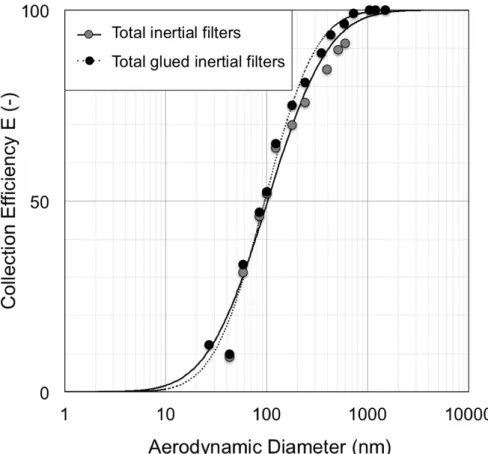
Fig. 2.14 Effect of glue coating on TEM grids on the collection efficiency of the main
inertial filter.
!
ivFig. 2.15 Effect of glue coating on the total collection efficiency of the pre-cut and main inertial filters.
Fig. 2.16 Pressure drop with particle loading of PM
0.1personal sampler (a) the pre-cut impactors, (b) the pre-cut inertial filter, (c) the main inertial filter, (d) the backup filter and (e) PM
0.1personal sampler (the pre-cut impactors + the pre- cut inertial filter + the main filter + the backup filter).
Fig. 2.17 Comparison of collection efficiency of the main inertial filter before and after the particle loading of 0.1 mg.
Fig. 2.18 Comparison of aerosol particle cumulative concentrations obtained by PM
0.1personal sampler with nanosampler.
Fig. 3.1 Schematic diagram of PNS (PM
0.7/0.2and
PM0.7/0.14) and PM
0.1personal sampler (PM
5.6/1.4/0.45/0.1, PM
4/1/0.45/0.1and PM
2.5/1/0.45/0.1).
Fig. 3.2 Sampling locations for evaluation of personal exposure at sidewalk along road tunnel.
Fig. 3.3 Cigarette using dried banana leaves.
Fig. 3.4 Particle mass concentrations of collected particles at middle and mouth of tunnel, background at Kanazawa and roadside at Bangkok.!!
Fig. 3.5 Particle mass concentrations of collected particles at middle of tunnel, bus stop in a weekday and a weekend at Kanazawa and on road at Phnom Penh.!!
Fig. 3.6 Particle mass concentrations of collected particles at roadside and the breathing zone of taxi driver at Shenyang.
Fig. 3.7 article mass concentrations of collected particles at the breathing zone of train passenger in a smoking cabin.!!
Fig. 3.8 Particle mass concentrations of collected particles at a smoker house and the breathing zone of smoker.!
Fig. 3.9 Particle mass concentrations of collected particles of a daily life in a weekday and a weekend at Phnom Penh.!
Fig. 3.10 Particle mass concentrations of collected particles at the breathing zone of workers of Rubber sheet smoking (RSS): factory RSS factory-1 (September 2008) and RSS factory-2 (January 2009).!
Fig. 3.11 Particle mass concentrations of collected particles at the breathing zone of
workers of Rubber sheet smoking (RSS): RSS factory-3 (January2009) and
RSS factory-4 (February 2009).!
Fig. 3.12 Particle mass concentrations of collected particles at the breathing zone of workers of a textile factory, a print screen factory, and a TiO
2nano-powder factory.
Fig. 3.13 Particle mass concentrations of collected particles at the breathing zone of worker of a paint factory.!
Fig. 3.14 Carbon components of collected PM
0.1particles (a) OC (b) EC and (c) OC/EC.!
Fig. 3.15 Particle-bound 4-6 rings PAHs concentration at middle of tunnel and bus stop in a weekday and a weekend at Kanazawa.!
Fig. 3.16 Particle-bound 4-6 rings PAHs concentration at the breathing zone of workers of Rubber sheet smoking (RSS): RSS factory-3 (January2009) and RSS factory-4 (February 2009).!
Fig. 3.17 Particle-bound 4-6 rings PAHs concentration at the breathing zone of train passenger in a smoking cabin.
Fig.3.18 Particle-bound 4-6 rings PAHs concentration at the breathing zone of the breathing zone of workers of rubber sheet smoking (RSS): factory RSS factory-1 (September 2008) and RSS factory-2 (January 2009).
Fig. 3.19 BaP
TEQmass fraction at middle of tunnel and bus stop in a weekday and a weekend at Kanazawa.
Fig. 3.20 BaP
TEQmass fraction at the breathing zone of train passenger in a smoking cabin.
Fig.3.21 BaP
TEQmass fraction at the breathing zone of workers of rubber sheet smoking (RSS): RSS factory-3 (January2009) and RSS factory-4 (February 2009).!
Fig. 3.22 BaP
TEQmass fraction at the breathing zone of train passenger.
Fig. 4.1 Structure of PM
0.1separation unit.
Fig. 4.2 PM
0.1online monitoring system proposed in the present study.
Fig. 4.3 PM
0.1and associated BC online monitoring system proposed in the present study.
Fig. 4.4 Experimental setup for validation of PM
0.1online monitoring system.
Fig. 4.5 PM
0.1and associated BC online monitoring system for ambient particle monitoring.
Fig. 4.6 Number concentration of 100 nm mono-dispersed generated ZnCl
2particles.
Fig. 4.7 Collection efficiency of inertial filters with pre-cut impactor filters using 100
nm mono-disperse ZnCl
2particles.
!
viFig. 4.8 Number concentration of PM
0.1and total particles measured by CPC and SMPS.
Fig. 4.9 PM
0.1mass concentration of PM
0.1measured by SMPS and PM
0.1personal sampler.
Fig. 4.10 BC and EC mass concentration of ambient particles.
Fig. 4.11 Concentration of measured PM
0.1particles, calculated PM
0.1particles and
measured total particles.
Chapter 1 Introduction
1.1 Aerosol Particles
Aerosol particles or particulate matter (PM) are solid matter or liquid droplets from smoke, dust, fly ash, or condensing vapors that are usually stable for least a few seconds and in some case can be suspended in the air for long time periods. The particle size is the most important parameter, which is directly linked to their potential for causing health problems.
The U.S. national ambient air quality standard was originally based on particles up to 25-45 µm in size, termed total suspended particles (TSP). In 1987, EPA (United States Environmental Protection Agency) replaced the earlier TSP with an indicator that includes only those particles smaller than 10 µm, termed PM
10. These smaller particles cause most of the adverse health effects because of their ability to penetrate inside deeply lungs. Moreover, several recently studies indicate that significant respiratory and cardiovascular related problems, are associated with exposure to inhalable particle levels related to particle size.
Particles smaller than 10 µm in diameter pose the greatest problems, because they can get deep into lungs, and some may even get into bloodstream. Exposure to such particles can affect both lungs and heart. Larger particles are of less concern, although they can irritate eyes, nose, and throat. Therefore, fine particle or PM
2.5with a diameter less than 2.5 µm, is one-thirtieth of the diameter of a human hair (100 µm is the thickness of an average human hair), is an air pollutant that is a concern for people's health when levels in air are high.
Nanoparticles or particles smaller than 0.1 µm or 100 nm (PM
0.1) are more harmful to human
health because human have inadequate natural defense against PM
0.1. This is particularly
important for nanoparticles (<100 nm), since a large proportion of these particles can
penetrate and reach to the alveolar region (Hinds, W. C., 1999). They can also enter the
cardiopulmonary system and subsequently be circulated around the human body. These
particles have large surface area to volume ratios, readily allowing desorption of toxic
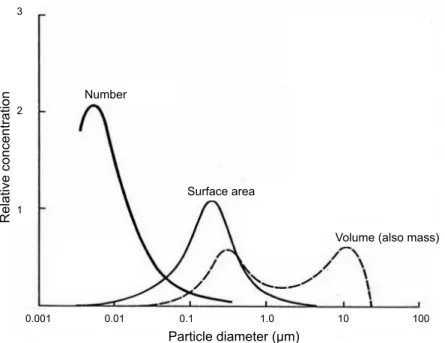
components to human. Fig. 1.1 shows concentration of number, surface area, volume and
mass by particle diameter. The two peaks of volume and mass concentration of ambient
particles are around 0.5 and 10 µm respectively, while the peak of number concentration is
high near 10 nm. Therefore, evaluation of particle exposure is a significant important aspect
of health, especially in cases where nanoparticles are present.
!
2Fig. 1.1 Concentration of number, surface area and volume by particle diameter.
(Seinfeld, 1975) 1.2 Nanoparticle Exposure and Health Effects
Several scientific studies have related nanoparticle exposure to a variety of problems, including respiratory symptoms, asthma attacks, immune changes, and contributing to undesirable cardiovascular effects (Borm and Kreyling, 2004; Donaldson et al., 2002;
Granum and Lovik, 2002). The effects can result in increased hospital admissions, emergency room visits, absences from school or work, and restricted activity days. People with heart or lung disease, older adults, and children are the most likely to be affected by exposure of nanoparticles, Concerning the deposition of particles in the respiratory system, exposure ratio of 1.2 m
3/hour inhalation of an adult male was shown in Fig 1.3. The nanoparticle exposure is high ratio in respiratory organs including extrathoracic region, alveolus region and also thoracic region. This is important that around 50% of nanoparticles can penetrate to alveolus region and their chemical compositions will be quickly dispersed throughout the human body (Bolch et al., 2001; Hinds, W.C., 1999; Hussain et al., 2011; Warheit, D.B., 2004).
Nanoparticles come from anthropogenic sources, e.g., volcanic eruptions, forest fire, and human activities, e.g., incinerating wastes, burning of fossil fuels and cigarette smoking.
In living environments, we certainly inhale nanoparticles from surrounding sources such as vehicle exhaust and cooking using charcoal in residential area. To assess health effect, it is important to determine particle concentration and its chemical compositions. Numerous studies reported human activities, e.g., powder production in a factory, burning of agricultural
Number
Surface area
Volume (also mass)
Particle diameter (µm)
Relative concentration
0.001 0.01 0.1 1.0 10 100 3
2
1
crop waste, cigarette smoking, become quiet high concentration (Behera et al., 2004;
Davidson et al., 2005; Herner et al., 2005, Morawska et al., 2008; Ngo et al., 2010; Phillips and Bentley, 2001). Therefore, evaluation of nanoparticle exposure in working environments is also significant due to long-term exposure. Evaluation of nanoparticle exposure have been concerned not only nanoparticles from daily human activities and environments, but also inherent nanomaterials in a part of nanotechnological developments (Kuhlbusch et al., 2011).
Although, the number of personal exposure studies in fine particles continually increased (Borgini et al., 2011; Du et al., 2010; Jahn et al., 2013; Lim et al., 2012), relatively few works have investigated personal exposure of fine particles reach to nano-size range.
Fig. 1.2 Exposure ratio of particles in human respiratory system.
1.3 Nanoparticles Measuring Instruments
There are various techniques and instruments for detecting, measuring and characterising nanoparticles. A technique may simply detect the presence of nanoparticles, may give the quantity, the size distribution or the surface area of the nanoparticles. In recently years, nanoparticle measuring instruments have been developed during increasing knowledge of nanoparticle health effects. Instruments, which mainly carried out measurement of nanoparticles, are a condensation particle counter (CPC), a scanning mobility particle sizer (SMPS), Nanoscan SMPS, a laser particle sizer (LAS), a cascade low pressure impactor (LPI), a Nano MOUDI (Nano Micro-Orifice Uniform Deposit Impactor) and so on. The instruments can be classified to gravimetric instruments such as LPI and Nano
Extrathoracic Region Respiratory Organs
Alveolus Region Thoracic
Region
Nanoparticle
Particle Size (nm)
Exposure Ratio (-)
!
4MOUDI, and real-time particle monitoring instruments such as CPC, SMPS, Nanoscan SMPS and LAS. CPC is used to count particle number in a total of micro- and nano-size particles, while SMPS, Nanoscan SMPS and LAS are used for measurement of particle size distribution including nanoparticle size range for number concentration and, or mass concentration. Moreover, those instruments were classified by sampling objective: a stationary samplers for particle sampling of surrounding environments or sources at a fixed location, and a portable samplers or a personal samplers with small, light and easy to carry on for mobile sampling, personal sampling and also fixed sampling locations where is inconvenient to use stationary samplers. However, there were few personal samplers applicable to nanoparticles. Example of stationary and portable samplers for nanoparticle measurement were summarized in Table 1.1
Table 1.1 Example of stationary and portable samplers for nanoparticle measurement Stationary Sampler
Sampler Flow Rate Measurement Value Measurement
Range CPC (TSI, model 3785) 1+ 0.1 L/min Number
concentration 5 nm to >3 µm SMPS (TSI, model 3034) 1 L/min Number and mass
concentration 10~478 nm Nanoscan SMPS
(TSI, model 3910) 0.75 L/min + 20% Number
concentration 10-420 nm LAS (TSI, model 3340) 10-95 cm
3/min ± 5%
(User-selectable)
Number
concentration 90 nm to 7.5 µm Personal Sampler
Sampler Flow Rate Number of Stages Cutpoints
(range, µm) Mini MOUDI Impactor
(Model M13) 2 L/min 6, 8, 10, 13 0.01-10
Personal Nanoparticle
Sampler (Tsai et al., 2012) 2 L/min 3 0.1-3.92
1.4 Principle of Inertial Filter
There are five basic mechanisms that an aerosol particle can be deposited on a fiber in
a filter, interception, inertial impaction, diffusion, gravitational settling and electrostatic
forces. The single-fiber efficiency is approximated as the sum of the efficiencies due to each
of the proceeding mechanisms acting individually. For collection of fine particles on the fiber, gravitational settling and electricity forces can be disregarded, since settling velocity is small with no electrostatic forces. Therefore, the fundamental of collection mechanisms of a filter are interception, inertial impaction and Brownian diffusion. Three of particle collection mechanism for fibrous filter is typically shown in Fig. 1.3. The collection efficiency depended on particle diameter and particle velocity.
Fig. 1.3 Single fiber collection mechanisms for fibrous filter.
The inertial filter has been developed based on the inertial technology. Large particles are collected in a conventional filter by inertial impaction at a high filtration velocity while small particles are removed from air by Brownian diffusion. The parameters that involved in inertial impaction and Brownian diffusion are Stokes number (Stk) and Peclet number (Pe);
(1-1)
(1-2)
(1-3)
(1-4)
Where C c is the Cunningham slip correction factor, ρ p the particle density, dp the particle diameter, u the filtration velocity, µ the viscosity, df the fiber diameter, and D the Brownian diffusivity of particles.
Stk = C
cρ
pd
p2u 9 µ d
fC
C= 1 + 2.514 λ
d
p+ 0.80 λ
d
pexp −0.55 d
pλ
#
$%
&
'(
€
λ = 0.0310 ( ) T
1.3P
Pe=udfD
!
6The collection efficiency of a filter increases with increasing Stk and decreasing Pe.
Therefore, an extremely high filtration velocity and a thin fiber are capable of providing a large inertial effect.
This can change a typical collection efficiency curve with the most penetrating particle size. As denoted by the dotted curve in Fig. 1.4, the collection efficiency for larger particles increases while that for smaller particles decreases. Hence, the collection efficiency curve approaches an ideal classification of particles with dp
50in the nano to ultrafine range.
Fig. 1.4 Principle of inertial filtration.
1.5 Personal Sampler for Evaluating of Ultrafine Particles Using Inertial Filter Technology
Various types of portable personal sampler with a battery pump have been used for the evaluation of the personal exposure in workplace and living environments. However, there were few personal samplers applicable to nanoparticles because of a difficulty from a large pressure for the separation of nanoparticles using conventional methods such as the low-pressure impactor. In order to overcome this difficulty, personal nanosampler (PNS) have been developed based on the ”inertial filter” technology (Furuuchi et al., 2010).
The two-stages of inertial filters were used for the personal nanosampler. Inertial
filters consisting of webbed stainless steel fibers (Nippon Seisen Co. Ltd., felt type, SUS-
304) were fixed into a circular nozzle using a resin (polyoxymethylene, POM) separable
cassette (Fig. 1.5). Since the web of SUS fibers has a high mechanical strength against
compression, the filter structure can be maintained at high filtration velocities, and the filtration velocity through the filter at a given pressure drop through the filter remains high.
Three different diameters of SUS fiber were used, where the fiber diameter was measured through SEM photographs and shown to have a near lognormal distribution. The filter retainer on the cassette bottom was designed to hold the fiber web by 0.2 mm diameter crossed wires, in order to achieve as small a pressure drop as possible. An inertial filter cassette was employed to make handling of the sampler easier. In addition, they can be easily exchanged with new ones on site without directly touching the fibers. They can be reused after cleaning and are disposable. The specifications of the inertial filters used are summarized in Table 1.2.
Fig. 1.5 Inertial filters for a personal nanosampler.
Table 1.2 Specification of inertial filters for the personal sampler inlet No.1 and No.2
A schematic diagram of the devised sampler, which consists of an inlet nozzle, inertial filters aligned in series, and a filter holder, is shown in Fig. 1.6. Duralumin and resin (POM) parts were used to reduce the weight of the sampler to below ~150 g. It can be clipped to a chest pocket using an inlet holder. A portable battery pump (SKC, Leland Legacy, 5−15 L/min, 1.0 kg of weight) was employed and connected to the sampler via a PVC tube. This pump was selected because it is ranked as one of the commercially available battery pumps with the largest capacity and is capable of operating 24 hrs on its internal battery.
Table 1.
Inlet Inertial
filter df (m)
Fiber
material Type Ln
(mm) Dn
(mm) Q (L/min)
Fiber Loadings
(mg)
Fiber volume faction
(-)
Cutoff size (field test)
(nm) No. 1 Pre
Main 13.5 (g= 1.1)
9.8 (g= 1.1) SUS-304 web 5.5 4.5
6 3
6
6 14.7−18.2 3.2−3.5
0.0143 0.0135
700 200
No. 2 Pre Main
9.8 (g= 1.1)
5.6 (g= 1.1) SUS-304 web 5.5 4.5
6 3
6
6 20.4−22.7 1.6−4.2
0.0165 0.0128
700 140 d: fiber diameter; D: nozzle diameter; L: nozzle length; Q: flow rate
!
8Fig. 1.6 Schematic of Personal Nanosampler.
Fig. 1.7 shows separation efficiency curves for the main inertial filter (No. 2) measured for different fiber loadings at a flow rate of 6 L/min. The collection efficiency is plotted on the basis of the aerodynamic diameter (< 300 nm) and optical diameter (> 300 nm). Solid curves were calculated from theoretical predictions in which the main collection mechanisms, inertia, diffusion and interception were taken into account, for a single fiber (Otani et al., 2007; Eryu et al., 2009). The cutoff size, or d
p50, decreased to ~130 nm with increasing fiber loading. This size corresponds to a Stoke’s diameter of ~80 nm (Hinds, 1999) for a singly charged particle. The separation curves subsequently became steeper. For particle sizes below 30−40 nm, the collection efficiency increased slightly because of the increasing influence of diffusion (Otani et al., 2007). Separation performance is described theoretically for this condition, although the cutoff size is overestimated by 70−80%. The reason for this was not investigated in this study. However, it might be related to an effect similar to that for the aerosol dynamic lens. That is, an aerosol with a large filtration velocity may be focused after passing through each fiber. This may cause an increase in single fiber collection efficiency.
The solid curves describe tendencies. Both filter-sets provided similar separation
behaviors. However, the use of a finer fiber (d
f= 5.6 µm) in the main inertial filter resulted in
a smaller dp50 (~140 nm) with a steeper separation curve. The pre-filters have almost the
same dp50 (~700 nm) and the separation curves are similar. The collection efficiency of
particles larger than ~1 µm appears to decrease, as the result of bouncing. Hence, the inertial
filter should be used judiciously for this range of particles because of the increased risk of re- suspension or bouncing.
Fig. 1.7 Collection efficiency curves of inertial filters of PNS inlet type No.1 and No.2.
However, because of a difficulty in the pressure drop through the inertial filter under the limited capacity of a portable battery pump, the best achieved cutoff size was ~140 nm at 6 L/min of a sampling flow rate, which is not enough to be called as “nanoparticles”.
Although an impactor type personal sampler was recently devised for 100 nm of
cutoff size (Tsai et al., 2012), its sampling flow rate (2.0 L/min) is not always enough for the
chemical analysis of particles collected in working (6-8hours) and living environments (12-
24 hours). Hence, the cutoff size of 100 nm should be also achieved at a practical samplng air
flow rate such as 4-6 L/min or more. Another difficulty frequently encountered in the
practical application is from the existence of huge and coagulated particles, which is typically
observed in fine powder handling workplaces and roadside environments. The loading of
these particles on the inertial filter for nanoparticle separation increases a pressure drop and
also accelerates bouncing problems of coarse particles. Hence, to overcome these problems is
!
10very important for the practical application of the personal sampler for the wide range of concentration and size distribution of particles.
1.6 Objective of Research
1. To develop and improve personal sampler for evaluation of personal exposure of PM
0.1based on the inertial filter technology
2. To apply the developed personal sampler to evaluate personal exposure in field measurements
3. To apply the PM
0.1inertial filter as a PM
0.1separation unit for online monitoring system
1.7 Contents of Research
This research consists of 3 parts, which is chapter 2; Development of PM
0.1Personal Sampler! for Evaluation of Personal Exposure to Aerosol Nanoparticles, chapter 3; Exposure Assessment of Aerosol Nanoparticles and Chemical Compounds in Living and Working Environments, and chapter 4; Online Monitoring of PM
0.1Number Concentration and Particle-bound Black Carbon Using PM
0.1Inertial Filter.
1.7.1 Development of PM
0.1Personal Sampler for Evaluation of Personal Exposure to Aerosol Nanoparticles
PM
0.1personal sampler has been developed based on a new idea of a layered mesh inertial filter to evaluation of personal exposure to nanoparticles. To apply as a practical personal sampler for the evaluation of nanoparticles exposure in several environments including highly contaminated locations, pre-cut impactors were used to decrease particle load on a layered mesh inertial filter and keep it separation performance. Separation performances of the PM
0.1personal sampler consisting of the layered mesh filter and other pre-separators were evaluated. An influence of particle loading on the pressure drop and separation performance, which is practically important, was also discussed. The PM
0.1personal sampler was validated with a commercial instrument.
1.7.2 Exposure Assessment of Aerosol Nanoparticles and Chemical Compounds in Living and Working Environments
Personal exposure of aerosol nanoparticles at roadside and on road environments, smoking environments, exposure during daily activities and working environments were evaluated using the PM
0.1personal sampler as the practical application. The carbon compounds of collected PM
0.1and poly-cyclic aromatic hydrocarbons (PAHs) of collected particles were analyzed. The influences of sampling locations, human activities and environments were also discussed in relation to nanoparticle exposure and associated carbon compounds and PAHs.
1.7.3 Online Monitoring of PM
0.1Number Concentration and Particle-bound Black Carbon Using PM
0.1Inertial Filter
A PM
0.1separation unit, which is based on the inertial filter technology and originally devised for the evaluation of personal exposure to nanoparticles, was applied to the online monitoring system. A condensation particle counter (CPC) was combined with the PM
0.1separation unit for measurement of PM
0.1number concentration. To investigate black carbon in PM
0.1, a black carbon monitor (BCM) and a multi angle absorption photometer (MAAP) were used in the online monitoring system. This is a proposal for a simple PM
0.1monitoring tool applicable to various environments including material handling workplace and living environments.
!
Chapter 2
Development of PM
0.1Personal Sampler for Evaluation of Personal Exposure to Aerosol Nanoparticles
2.1 Introduction
This chapter describes design of the PM
0.1personal sampler, which have been developed based on a new idea of a layered mesh inertial filter to the evaluation of the personal exposure to nanoparticles. The aim of development of the PM
0.1personal sampler is to achieve! a! cutoff! size! of! 100! nm and apply as a practical personal sampler for the evaluation of nanoparticles exposure in several environments including highly contaminated locations. Therefore, separation performances of the PM
0.1sampler consisting of a main inertial filter (a layered mesh inertial filter), a pre-cut inertial filter and pre-separators for the removal of coarser particles were evaluated. An influence of particle loading on the pressure drop and separation performance, which is practically important, was also discussed. Finally, The PM
0.1personal sampler was validated with a conventional instrument.
To assess the health effects of airborne particulates, it is necessary to determine both the concentration and composition of the particles in the breathing zone with regards to aerodynamic particle size, which affects the regional deposition of particles inhaled into the human respiratory system. This is particularly significant important for ambient nanoparticles (<100 nm), since they can contain a large portion of hazardous chemicals from anthropogenic sources and can penetrate deeply inside lungs, eventually reach the alveolar region. Moreover, their chemical compositions will be more quickly dispersed throughout the human body (Bolch et al., 2001; Hinds, W.C., 1999; Hussain et al., 2011; Warheit, D.B., 2004). Exposure to nanoparticles has been associated with pulmonary inflammation, immune changes, and a contribution to undesirable cardiovascular effects (Borm and Kreyling, 2004; Donaldson et al., 2002; Granum and Lovik, 2002). Moreover, PM
0.1in environments influenced by human activities, e.g., powder production in a factory, burning of agricultural crop waste, and cigarette smoking, is being reported in ever-increasing concentrations (Behera et al., 2004;
Davidson et al., 2005; Herner et al., 2005, Morawska et al., 2008; Ngo et al., 2010; Phillips and Bentley, 2001). In order to evaluate health influences and risks, therefore, the monitoring of environmental nanoparticles is crucially important.
The evaluation of nanoparticle exposure has been concerned not only on nanoparticles
from daily human activities and environments, but also on nanomaterials that are an inherent
part of nanotechnological developments (Kuhlbusch et al., 2011). Although the number of personal exposure studies on fine particles has continually increased (Borgini et al., 2011; Du et al., 2010; Jahn et al., 2013; Lim et al., 2012), relatively few studies have focused on monitoring the personal exposure to fine particles in the nano-size range via a portable personal sampler (Young et al., 2013). Therefore, the development of a portable personal sampler that could be used to evaluate nanoparticle exposure would be indispensable in any discussion on the health risks and influences posed by nanoparticles.
Various types of portable personal samplers equipped with a battery pump have been used for the evaluation of the personal exposure in workplaces and in living environments.
Few of these personal samplers, however, have been applicable to the collection of nanoparticles. This has been due to the difficulty posed by the large degree of pressure drop that is needed for the separation of nanoparticles when using conventional methods that employ a low-pressure impactor. In order to overcome this difficulty, the authors developed a personal sampler based on the “inertial filter” technology (Furuuchi et al., 2010). However, because of the difficulty posed by a pressure drop through the inertial filter under the limited capacity of a portable battery pump, the best cutoff size that could achieved was ~140 nm with a 6 L/min of a sampling flow rate, which was insufficient for a characterization as
“nanoparticles”. Although an impactor type of personal sampler was recently devised with a cutoff size of 100 nm (Tsai et al., 2012), its sampling flow rate (2.0 L/min), was not always sufficient for the chemical analysis of particles that could be collected in working (6-8hours) and living environments (12-24 hours). Hence, a cutoff size of 100 nm must be achieved for a practical sampling air-flow rate that should approximate 4-6 L/min, or more. Another difficulty frequently encountered in the practical application comes from the existence of huge and coagulated particles, which are typically observed in the handling of fine powder in workplaces and in the vicinity of roadside environments. The loading of these particles on the inertial filter for nanoparticle separation increases the pressure drop and also accelerates the rate of bouncing problems encountered with coarse particles. Hence, given the wide range of concentration and size distribution of particles, it is very important to overcome these problems if the practical application of a personal sampler is to be effective.
In this study, the PM
0.1sampler for the evaluation of the personal exposure to
nanoparticles was designed based on a novel approach that uses a layered mesh inertial filter
while targeting the application to practical environments including roadsides and highly
contaminated workplaces. Separation performances were evaluated for the PM
0.1sampler
consisting of the layered mesh filter and other pre-separators for the removal of coarse
!
14particles. The influence of particle loading on the pressure drop and separation performance, which is important for practical applications, was also evaluated.
2.2 Inertial Filters and Pre-cut Impactors
2.2.1 Layered Mesh Inertial Filter for PM
0.1Separation
The structure of a layered mesh inertial filter, which is for the separation of PM
0.1and
refered as the main inertial filter was shown in Fig. 2.1. The layered mesh inertial filter
consists of layered square mesh copper TEM grids (Fig. 2.2) commercially available (Glider,
G600HSS) sandwiched by manufactured copper spacers with circular hole (Ø 1.9 mm, t = 30
µm) stacked in a circular nozzle (Ø 3 mm, 9 mm nozzle length) with a bell shaped inlet
through an aluminum cartridge. Comparing to the geometry of an original inertial filter using
webbed stainless steel fibers (Otani et al., 2007; Eryu, K. et al., 2009; Furuuchi et al., 2010),
the layered TEM grids can easily provide a uniform structure of fibers aligned perpendicular
to the flow direction along the nozzle, which may maximize the inertial effect on particles
and provide a less pressure drop for the same separation performance. A key point of the
layered-mesh is uniformity structure to project the flow direction in the preparation of the
layered-mesh inertial filter since the aerosol particles may penetrate directly through open
spots of the area covered by mesh wires because of a large inertial effect (Eryu, K. et al.,
2009). Hence, wire mesh screens have to be aligned tangentially uniform in order to
maximize the coverage of the nozzle cross section by mesh wires. The advantages of the
layered mesh inertial filter cannot be obtained by the original structure of randomly
orientated SUS fibers packed in a circular nozzle since it is difficult to make the structure of
packed fibers uniform over the cross section and depth of a small diameter of nozzle less than
2 millimeters. Particles collected on the layered mesh inertial filter can be analyzed its
chemical components such as PAHs by the extraction, e.g., immersing TEM grids in a
solution for the extraction. Specifications of the TEM grid are listed in Table 2.1. The
number of TEM grids and spacers were decided as 5 for each based on the preliminary
experiments and numerical analysis (Eryu, K. et al., 2009; Takebayashi, 2011).
Fig. 2.1 Schematic of the main inertial filter.
Fig. 2.2 TEM grid (Glider, G600HSS).
Table 2.1 Specification of TEM grids used for the layered mesh inertial filter
Gridtype Code Material Mesh (lines/inch)
Pitch (µm)
Bar width
(µm)
Hole width
(µm)
Thickness (µm)
Q (L/min)
Cutoff size (nm) square
mesh
Glider
G600HSS Cu 600 42 5 37 8 5 100
2.2.2 Pre-cut Inertial Filter for PM
0.5In order to prevent clogging and bouncing of coarse particles on the layered mesh PM
0.1inertial filter, a pre-cut inertial filter consisting of webbed SUS fibers (d
f=9.8 µm) packed in a Ø 4.75 mm circular nozzle (5.5 mm length) through a metal cartridge was used upstream the layered mesh inertial filter. This type of the inertial filter has a relatively large dust loading capacity and can provide a less pressure drop than that of the impactor. The pre- cut inertial filter has the same geometry with the original one but different diameter of nozzle and SUS-fiber loading were used to decrease the cutoff size from 700 nm to 450 nm. This
Fine Square Mesh
G200HS
G600HSS
G2000HS
Gilder Grids, Withambrook Industrial Park, Londonthorpe Road, Grantham, Lincs, NG31 9ST. United Kingdom Tel: +44 (0)1476 560052 Fax: +44 (0)1476 568165 Email: [email protected] Web: www.gildergrids.co.uk
G300HS
G1000HS
GVHS
G400HS
G1500HS
SQUARE MESH – Suffix HS &
HSS. Comprising of 8 grid types ranging from 200 lines/inch to an unrivalled 2000 lines/inch.
!
16may reduce the amount of particles penetrating to the layered mesh inertial filter to keep its performance. Specification of the pre-cut inertial filter is shown in Table 2.2.
Table 2.2 Specification of the pre-cut inertial filter
InertialFilter
df
(µm)
Fiber
material Type Ln
(mm) Dn
(mm) Q (L/min)
Fiber loadings
(mg)
Fiber volume fraction (-)
Cutoff size (nm) Pre-cut
inertial filter
9.8 SUS-
316L web 5.5 4.75 5 10 0.0133 450
2.2.3 Pre-cut Impactors
Although the pre-cut inertial filter is expected to have a larger capacity of particle loading and a less re-suspended particles comparing with an impaction plate of the impactor, a dust loading capacity was suspected to be not enough for the measurement in highly contaminated environments by huge and coagulated particles, which are typically observed in fine powder handling processes and road side environments. In order to avoid these particles to penetrate into the pre-cut and layered mesh inertial filters, therefore, a commercially available two stage pre-cut impactors (SHIBATA, ATPS-20H) was used for the removal of particles in the micron size range. Appearance of ATPH-20H was shown in Fig. 2.3. Cutoff sizes of 1
stand 2
ndstage of the pre-cut impcators are estimated by an equation for inertial separation (Hinds, W.C., 1999) respectively as 5.6 and 1.4 µm at 5 L/min, which are originally designed as 10 and 2.5 µm at 1.5 L/min. The pre-cut impactors are practically important in workplaces highly contaminated by coagulated particles in order to keep the separation performance of the inertial filters and to minimize the pressure drop due to the particle loading
Fig. 2.3 ATPS-20H Shibata Scientific Technology).
2.2.4 PM
0.1Inlet for a Personal Sampler
Fig. 2.4 shows the geometry of the PM
0.1personal sampler inlet, which consists of above two different types of inertial filters located downstream the two stage pre-cut impactors and followed by a backup filter on a thin stainless filter holder. The surface of an impaction plate of 1
ststage of the pre-cut impactor was covered by silicon grease (Dow Corning, 03253589) to a uniform thickness around 0.2 mm while a 10 mm diameter of glass fiber filter (Pallflex, T60A20) was attached on an impaction plate of 2
ndstage. The outlet of the PM
0.1personal sampler was connected to a portable battery pump (Hario Sci., HSP-5000) (Fig. 2.5) with a flexible resin tube. Weight of the PM
0.1personal sampler is 112 g of sampler inlet (6.5 cm maximum width and 11.4 cm height) and 700 g of the portable pump (85 mm width, 60 mm depth and 155 mm height) can be acceptable for handle sampler.
Fig. 2.4 PM
0.1personal sampler inlet and inertial filters used: (a) an outside picture and structure of PM
0.1personal sampler inlet, (b) the pre-cut inertial filter and stainless steel
(SUS) fibers used, (c) the main inertial filter (layered mesh geometry).!
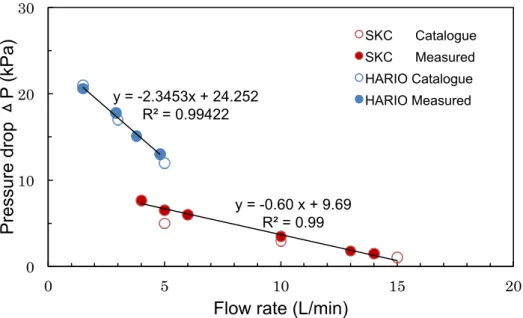
!
18Fig. 2.5 Portable HARIO pump HARIO, HSP-5000).
Fig. 2.6 Relationship between a pressure drop and flow rate of two type of portable pump;
HARIO pump (HARIO, HSP-5000) for the PM
0.1personal sampler and SKC pump for the personal nanosampler.
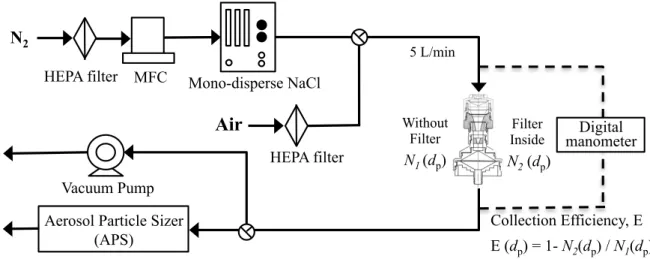
2.3 Experiments
2.3.1 Separation performances of inertial filters and pre-cut impactors
The separation performance of the inertial filters was evaluated by an experimental setup shown in Fig. 2.7, which consists of an evaporation-condensation type aerosol generator, a nitrogen gas generator for carrier gas supply, HEPA Filters, mass flow controllers, a neutralizer (
241Am), a differential mobility analyzer (DMA), a test inertial filter in a holder, a digital manometer and measuring instruments for particle number
0 10 20 30
0 5 10 15 20
Pre ssu re d ro p P (kPa )
Flow rate (L/min)
SKC Catalogue SKC Measured HARIO Catalogue HARIO Measured
concentration. The performance was evaluated following a reported procedure (Furuuchi, M et al., 2010). ZnCl
2powder was dosed on an alumina boat in a tubular image furnace, where ZnCl
2was heated up to 190-320 °C then cooled to a room temperature to obtain ZnCl
2particles. After classifying generated particles by DMA, aerosol particles were used as the test aerosol. The mono-dispersed ZnCl
2particles were diluted with air through a HEPA filter and supplied to the inertial filter put in a holder.
Fig. 2.7 Experimental setup for the inertial filter performance test.
The collection efficiency was determined based on the number concentration measured by a laser aerosol spectrometer (TSI, LAS model 3340), a condensation particle counter (TSI, CPC model 3785) and a scanning mobility particle sizer (TSI, SMPS model 3080). A pressure drop through the inertial filter was monitored using a digital manometer (EXTECH, HD 750). The mobility equivalent diameter of ZnCl
2particles was converted to the aerodynamic diameter using a measured density (1508 kg/m
3averaged for 40 nm to 350 nm) of generated particles using an aerosol particle mass analyzer (KANOMAX, APM model 3600). The density of generated ZnCl
2particles was shown in Fig. 2.8
!!!!!!!!!!!!!!! !!
N2 (dp) N1 (dp)
Filter Inside Without
Filter Digital
manometer
Condensation Particle Counter (CPC) N2
HEPA filter
DMA Aerosol Generator
MFC
Vacuum Pump
Air Poly-disperse ZnCl2
Mono-disperse particles
HEPA filter AM-241 AM-241
Collection Efficiency, E E (dp) = 1- N2(dp) / N1(dp) Laser Aerosol
Spectrometer (LAS)
5 L/min
Scanning Mobility Particle Sizer (SMPS)
!
20Fig. 2.8 Measured density of generated ZnCl
2particles.
The performance of pre-cut impactors was evaluated using a configuration shown in Fig. 2.9. A condensation aerosol generator (TOPAS, SLG 270) was used to obtain a large number concentration of mono-dispersed NaCl coarse particles, which are electrically neutral. Generated mono-disperse NaCl particles were diluted by mixing with filtered air by a HEPA filter and supplied to the pre-cut impactor filters. The collection efficiency of pre-cut impactor filters was determined based on the number concentration measured by an aerosol particle sizer (TSI, APS model 3321). A pressure drop through the inertial filter was also monitored using a digital manometer (EXTECH, HD 750).
Fig. 2.9 Experimental setup for the pre-cut impactors performance test.
Mono-disperse NaCl N2
HEPA filter MFC
N2 (dp) N1 (dp)
Filter Inside Without
Filter Digital
manometer
Aerosol Particle Sizer (APS) Vacuum Pump
Air
HEPA filter
Collection Efficiency, E E (dp) = 1- N2(dp) / N1(dp) 5 L/min
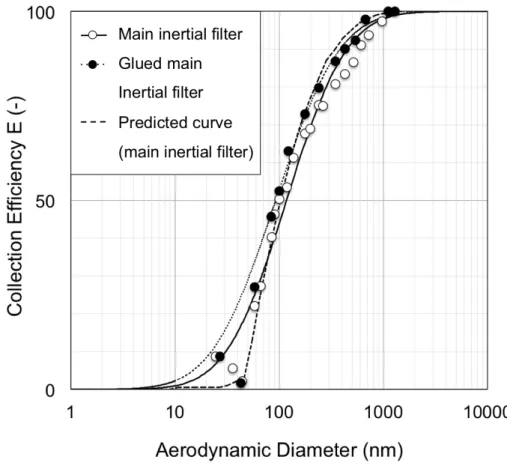
2.3.2 Effect of fiber coating of inertial filters
An influence of a surface treatment of inertial filter fibers to reduce a bouncing effect of coarse particles was also investigated. Fiber surfaces of the pre-cut and the main inertial filters were coated by glue, or, by dropping 1 wt% water solution of water soluble glue (Tombo, HCA-122) onto the pre-cut and main inertial filters held on the PNS inlet then drying by flowing a HEPA filtered air through each inertial filter for 1 hour. From the observation by an optical microscope, there was no remaining water glue solution or dried glue at any corners and edges of mesh grids, which may influence the flow and particle motion.
2.3.3 Influence of particle loading on pressure drop
Influences of particle loading on the pressure drop and separation performance of the
PNS inlet were investigated for different size range of particles: coarse particles in micron
order which may be predominant in some workplaces or roadside and fine particles which are
main fraction of smoke particles including cigarette smoke and automobile exhaust particles
etc. As loading test dusts, JIS No.5 as shown in Fig. 2.10, mineral dust and 85+5% of which
is in > 5 µm in mass basis, was used as coarse particles. The chemical compositions of JIS
No.5 are SiO
2> 45% mass and Al
2O
3> 20% mass. Particle size distribution of JIS No.5 was
shown in Table 2.3. Density of JIS No.5 is more than 1950 kg/m
3. As fine loading test
particles, incense smoke particles, which are of prominent concentration in a range between
100-200 nm, were used. The JIS No.5 dust was dispersed by an ejector (Sympatec, RODOS
type) to a mixing box then introduced to the PNS. Incense smoke particles with 1950 kg/m
3of average measured density from 40 nm to 350 nm (Fig. 2.11), were diluted by filtered air
through a HEPA filter then introduced at to the PNS after. In order to obtain various particle
loadings on the filters, the sampling was adjusted between 60 to 120 min for JIS No.5 dust
and between 5 to 10 min for incense smoke particles. Pressure drop was measured by a
digital manometer (EXTECH, HD 750) before and after sampling.
!
22Fig. 2.10 Dust for industrial testing No.5 (JIS No.5).
Fig. 2.11 Density of incense smoke particles.
Table 2.3 Particle size distribution of JIS No.5 (particle size and oversize on mass base) Particle Size Oversize (on Mass Base), %
5 µm 84 + 5 %
10 µm 60 + 3 %
20 µm 32 + 3 %
30 µm 15 + 3 %
45 µm 8 + 3 %
105 µm 0%
2.3.4 Validation of PM
0.1personal sampler
For the validation of measurement by the PM
0.1personal sampler, the concentration and size distribution of ambient aerosol particles were compared between those by the PM
0.1personal sampler and the Nanosampler as shown in Fig. 2.12 (NS, KANOMAX, Model 3180;
Furuuchi et al., 2010) after the same period of aerosol sampling. The validation has been conducted at a balcony on 6th floor of a 7-story building of Kanazawa University in Kakuma campus, Kanazawa. Binder-less quartz fibrous filters (Pallflex, 2500QAT- UP) were used for the validation, where they were weighed after the conditioning at 20°C and 50% RH in a weighing chamber for 48 hours both before and after the sampling.
Fig. 2.12 Nanosampler (Kanomax, Model 3180): (a) Appearance of nanosampler (b) Structure of nanosampler.
2.4 Results and Discussion
2.4.1 Separation performance of the inertial filters
Fig. 2.13 shows collection efficiency curves for the pre-cut and main inertial filter along with the combination of those filters and the pre-cut impactors measured at 5 L/min of air flow rate. The cutoff size of the pre-cut filter was estimated as ~ 450 nm at a pressure drop of 0.6 kPa. The cutoff size of the main filter could be adjusted as ~ 100 nm by changing the filtration velocity, or, size of a spacer hole, with an acceptable steepness of the efficiency curve at 4.6 kPa of pressure drop. A dashed curve in Fig.2.12 denotes a precitition based on the filtration theory along with numerical simulation for a fiber with square cross-section
(a) (b)