Application of Cloud‑based Virtual Reality Integrated Automatic Presentation Script for Understanding Urban Design Concepts
著者 張 遠翼
著者別表示 Zhang Yuanyi journal or
publication title
博士論文要旨Abstract 学位授与番号 13301甲第4483号
学位名 博士(学術)
学位授与年月日 2016‑09‑26
URL http://hdl.handle.net/2297/46586
doi: 10.14246/irspsd.3.2_53
Creative Commons : 表示 ‑ 非営利 ‑ 改変禁止 http://creativecommons.org/licenses/by‑nc‑nd/3.0/deed.ja
Dissertation Abstract
Application of Cloud-based Virtual Reality Integrated Automatic Presentation Script for
Understanding Urban Design Concepts
Graduate School of Natural Science and Technology Kanazawa University
Name: Yuanyi Zhang
1
Abstract
This PhD research targets to provide a new method that combined a useful presentation technology (APS) with an effective communication platform (Cloud-based VR), as a broader participation platform to create a common virtual scene for improving users’ urban design concepts understanding in consensus process. We attempted to build a Cloud-based VR platform to proposing urban design concepts, and created APS for auxiliary guiding users to understand the design concepts, so that they can evaluating and deliberating design concepts and design alternatives through the Internet.
The research starts from VR presentation using 3D laser scanning technology for historic building map- ping and modeling, as a new method to obtain data source for APS. We compared the mapping results of detailed components with the traditional method. Then, we seek to find a solution for the problem of how to improve users’ urban design concepts understanding through available communication media and useful presentation technology (VR integrated APS). After that, in order to provide a broader participation way for users to understand design concepts, this PhD research applied the Cloud-based VR platform in a design report meeting of One Foundation Disaster Prevention Park project.
Chapter1: Introduction
1.1 Research Background
Urban design concepts are designed to serve as the design visions for what the city might become in the future, they provide the overall objectives of urban design and the solutions in dealing with urban issues, as well as lead the way for design decisions. However, it is difficult for users to understand urban design concepts or even misunderstanding, due to a lack of user interaction and clear information exchange between users and designers. APS is a presentation technology which can combine different kinds of communication media to express urban design concepts more clearly; and Cloud-based VR platform can provide synchronous transmission and interactive services for large amounts of data.
1.2 Research Objectives
Based on the problems above, this dissertation has some objectives to give the solution, there are:
1. Propose a new method to obtain 3D data for mapping and modeling as a data source for APS, and verify the advantage of 3D laser scanning technology in data collection.
2. Improve users’ understanding of urban design concepts through using VR integrated APS, and examine it effect on users’ cognition and evaluation of urban design concepts.
3. Provide a broader participation way for users to understand urban design concepts in con- sensus process through using Cloud-based VR integrated APS.
Chapter2: VR Presentation Using 3D Laser Scanning Technology
This Chapter aims to research on the VR presentation using 3D laser scanning technology in historic buildings mapping and modeling, as a new method to obtain data source for APS.
2.1 Introduction
As stated by Kim (2004), any 3D visualization method typically involves three main con- struction steps: data collection, 3D modeling, and presentation. Thus, advantaged data collection tools and technologies are necessary for building a replica of the physical object, such as topogra- phy, building heights and dimensions.
2
2.2 Virtual Reality based on 3D Laser Scanning Technology
The 3D laser scanner through emits laser beam to the surface of the physical object, to calcu- late the flight time of laser beam, to get the coordinates of each point according to the angle between laser beam and it direction. Figure 2-2, illustrates the flow chart of virtual reality presentation based on 3D laser scanning technology.
Figure 2-1 Spatial coordinates of measuring point P Figure 2-2 The flow chart of VR presentation based on 3D laser scanning technology
2.3 3D Laser Scanning Technology for Historic Building Mapping and Modeling
Figure 2-3, below, illustrates the flow chart of 3D laser scanning technology for historic building mapping and modeling.
Figure 2-3 The flow chart of 3D laser scanning technology Figure 2-4 The measuring sites and measuring targets
2.3.1 Data Collection Outdoors
Figure 2-4 illustrates 16 measuring sites and 8 measuring targets which have been set in the data collection outdoors.
2.3.2 Data Processing Indoors
Data processing indoors mainly includes splicing and noise eliminating for the point clouds selection and section, the creation of CAD drawing, 3D modeling, the generation of 3D space image, data storage and extraction for later use. Figure 2-5, 2-6 and 2-7 illustrate the drawing of the section from the point clouds.
Figure 2-5 The entrance plane section Figure 2-6 The entrance vertical face section Figure 2-7 The entrance profile section
Figure 2-8, 2-9 and 2-10 illustrate the plane drawing, vertical face drawing and profile drawing of the entrance after hidden point clouds. The CAD drawing can be used to modeling as well as one of a data source of APS.
Figure 2-11 illustrates the 3D modeling of one historic building in Shang Shu Di project. The collected data (point clouds with digital image) can also be used in VR presentation and as another data source for APS. Figure 2-12 illustrates the 3D space image of Shang Shu Di.
Figure 2-8 The plane drawing of the entrance Figure 2-9 The vertical face drawing of the entrance
3
Figure 2-10 The profile drawing of the entrance Figure 2-11 3D modeling of historic building Figure 2-12 3D space image of Shang Shu Di
2.4 Comparison of 3D Laser Scanning Technology with Traditional Method in Detailed Components Mapping
In order to verify the advantage of 3D laser scanning technology in data collection for APS, we extracted point clouds of the Dougong beam, and compared the mapping results with traditional method as shown in Figure 2-13.
Figure 2-13 Extracted point clouds Figure 2-14 The drawing using point clouds Figure 2-15 The profile drawing
Figure 2-14 illustrates the drawing of the Dougong beams above the Gold Pillar using the point clouds. The hidden point clouds were used to obtain the profile drawing of the Dougong beams above the Gold Pillar, as Figure 2-15 illustrates. The results are shown in Figure 16 and Table 1 which indicate that accuracy of the mapping drawing has improved significantly compared with the original manual mapping.
That is to say the 3D data obtained via 3D laser scanning can be used as a data source for APS.
Figure 2-16 Comparison of mapping results of 3D laser scanning technology and traditional method in detailed components Table 2-1Comparison results of the two methods corresponding to Figure 2-16
Key points. Traditional mapping method
3D laser scanning technology The comparison results (The problems of the traditional method)
①The diameters of the Gold Pillar
The same diameters from top to bottom, 406mm
Small top and big bottom, the diameter is 471mm at 300mm, and 406mm at 2400mm from the bottom.
The traditional method often misunderstands the diameter of the Gold Pillar. So there are measurement omissions.
②The high-aspect ratio of intermedi- ate Dougong.
Width is 70mm and height is 219mm. So the ratio is 3.13.
Width is 100mm and height is 289mm. So the ratio is 2.89.
The ratio of the traditional method is higher than the 3D laser scanning technology, so there is a measurement error.
③Tablet Square Absent Present There are measurement mistakes or omissions.
④Trunk Gong 150mm 173mm There is a measurement error.
⑤Er Pi Gong 264 mm 274 mm There is a measurement error.
⑥Hua Ya Zi 328 mm 340 mm There is a measurement error.
4
Chapter 3: Virtual Reality Integrated Automatic Presentation Script for Improving Urban Design Concepts Understanding
This Chapter aims to use VR integrated APS technology to improving users’ urban design concepts understanding in Tatsumi region of Tokyo Bay Zone, Japan.
3.1 Introduction
Urban planning and design is a very complex process that require communication through different kind of media to present and convey design concepts (Isikdag, 2010). APS is good for presenting and conveying design concepts. So, this chapter will focus on how to enhance users’ cognition and evaluation of the design concepts, and eventually improving their understanding of urban design concepts using VR integrated APS.
3.2 Implementation of the STARS in Tatsumi Region of Tokyo Bay Zone, Japan 3.2.1 Case study location
The case study is a virtual design contest project in order to adding new city facilities and adjusting land use, to meet the need of 2020 Olympic Games in Tatsumi region of Tokyo Bay Zone, as shown in Figure 3-1.
Figure 3-1. Project location: Tatsumi region in Tokyo Bay Zone of Japan. Figure 3-2. Virtual environment of the STARS
3.2.2 Implementation of STARS Using VR Integrated APS Technology
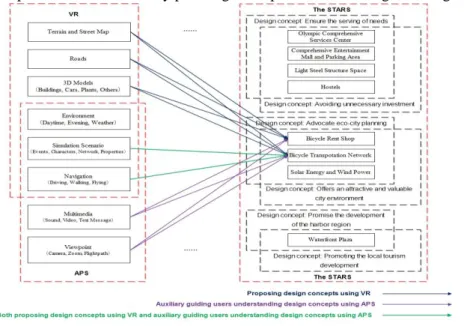
We used SketchUp to create 3D models and imported to UC-win/Road as the design element for virtual environment, Figure 3-2 illustrates the virtual environment of the STRAS. Figure 3-3 illustrates the implementation of eco-city planning concept in STARS using VR integrated APS.
Figure 3-3. Implementation of eco-city planning concept in STARS Using VR integrated APS
In this research, text is used as messages to statement the concepts of the STARS, and camera is moved to designate the viewpoints, so that the concepts of STARS can be presented clearly. Figure 3-4 illustrates the APS of advocate eco-city planning concept. Figure 3-5 illustrates the APS of STARS and its running result.
5
Figure 3-4. APS of advocate eco-city planning concept Figure 3-5. APS of STARS and its running result
3.3 Method and Validation 3.3.1 Participants
60 participants were students from Fuzhou University. Half of the participants have the professional back- ground of urban planning and design. To validate the significant difference among script video, freely navigation, and freely navigation after script video, participants will be divided into three groups on average.
3.3.2 Procedure
Figure 3-6 illustrates the flow chart of validation experiment. Participants had to answer questions about the increase of carrying capacity advocate of eco-environment idea to the world, and the promotion of the charm of harbor metropolis, see Figure 3-7(a)-(c). Finally, they were asked to describe their understanding of the design alternatives, as the qualitative interview after they finished the questionnaire and have a rest.
Figure 3-6 The flow chart of validation experiment Figure 3-7 (a) Adding urban facilities and space; (b) Adding bicycle network and green energy; (c) Providing an attractive environment.
3.4 Results of Questionnaires 3.4.1 Reliability Analysis
This research mainly uses internal consistency reliability estimates. All α values are shown in Table 3-1.
The results show that the values are above 0.7, so as to ensure the high internal consistency.
Table 3-1 Cronbach’s alpha values for all scales.
Domain Number of items in each Scale Cronbach α
Cognition of the STARS 9 0.726
Evaluation of the STARS 7 0.820
3.4.2 Cognition of the STARS
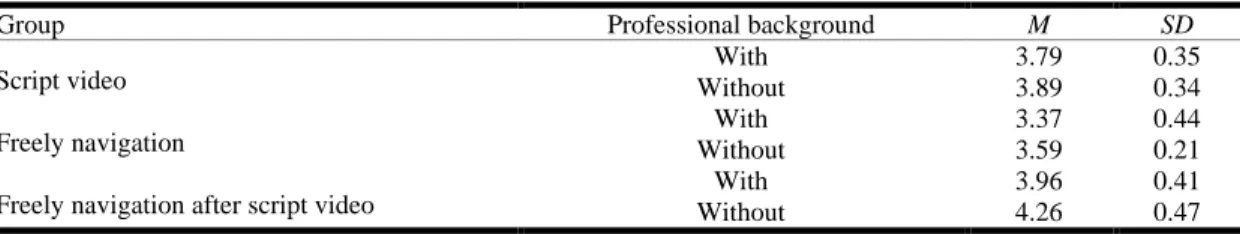
Table 3-2 indicate that the cognitive evaluation of freely navigation after script video was the highest;
meanwhile, participants who without professional background cognized the STARS as easier (with higher means) than those participants who with professional background.
Table 3-2. Descriptive statistics of the cognition of STARS (M±SD).
Group Professional background M SD
Script video With 3.79 0.35
Without 3.89 0.34
Freely navigation With 3.37 0.44
Without 3.59 0.21
Freely navigation after script video With 3.96 0.41
Without 4.26 0.47
6
Table 3-3. Analysis of variance (ANOVA) for the cognition of STARS.
Variable SS df MS F P
Groups 3.960 2 1.980 14.087 0.000
Professional background 0.629 1 0.629 4.474 0.039
As shown in Table 3-3, there was very significant differences among the three groups [F(2,56)= 14.087, P <0.001], and there was significant differences between participants who with professional background and participants who without professional background [F(1,56)= 4.474, P <0.05].
Table 3-4. Multiple comparisons for the cognition of STARS.
(I) Group (J) Group Mean Difference (I-J) SD P
Script video Freely navigation 0.36 0.12 0.004
Freely navigation after script video -0.27 0.12 0.028
Freely navigation Script video -0.36 0.12 0.004
Freely navigation after script video -0.63* 0.12 0.000
Freely navigation after script video Script video 0.27 0.12 0.028
Freely navigation 0.63* 0.12 0.000
* The mean difference is significant at the .05 level.
Thus, the follow-up analysis in Table 4 indicates that the significant differences of freely navigation after script video group was higher than script video group and freely navigation group, as well as the script video group was higher than the freely navigation group.
3.4.3 Evaluation of the STARS
Table 3-5 indicates that the design concepts evaluation of freely navigation after script video was the highest.
Table 3-5. Descriptive statistics of the evaluation of the STARS (M±SD).
Group Professional background M SD
Script video With 4.17 0.38
Without 4.03 0.40
Freely navigation With 3.77 0.29
Without 3.54 0.24
Freely navigation after script video
With 4.24 0.49
Without 4.60 0.37
Table 3-6 indicates that there was very significant differences among the three groups [F(2,56)= 19.619, P <0.001]. However, there was no significant differences between participants who with professional background and without professional background [F(1,56)= 0.002,P >0.05]. This means that the three kinds of communication media effect on the design concepts understanding of the STARS obviously.
Table 3-6. Analysis of variance (ANOVA) for the evaluation of the STARS.
Variable SS df MS F P
Groups 5.890 2 2.945 19.619 0.000
Professional background 0.000 1 0.000 0.002 0.962
Table 3-7 indicates that the significant differences of freely navigation after script video group was higher than script video group and freely navigation group, as well as the script video group was higher than the freely navigation group.
Table 3-7. Multiple comparisons for the evaluation of the STARS.
(I) Group (J) Group Mean Difference (I-J) SD P
Script video Freely navigation 0.443 0.123 0.001
Freely navigation after script video -0.321 0.123 0.011
Freely navigation Script video -0.443 0.123 0.001
Freely navigation after script video -0.764* 0.123 0.000
Freely navigation after script video Script video 0.321 0.123 0.011
Freely navigation 0.764* 0.123 0.000
* The mean difference is significant at the .05 level.
7 3.5 Results of Qualitative Interview
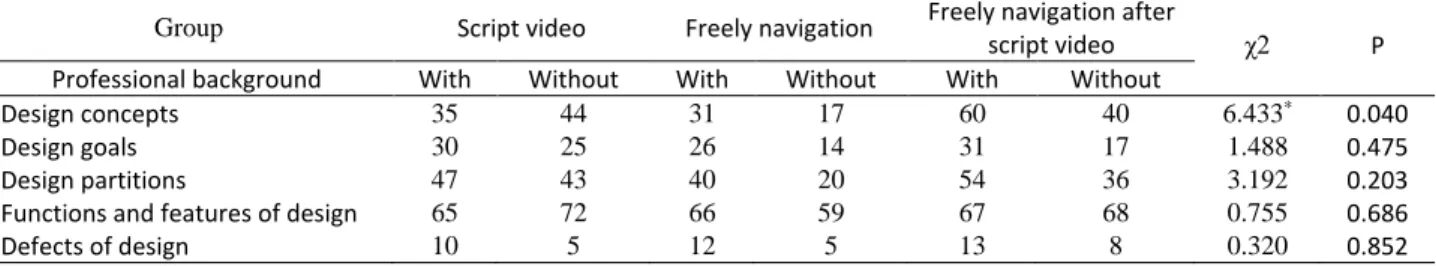
This research used chi-square test to determine whether there is a significant difference between the ex- pected frequencies and the observed frequencies in the indicator categories. The results are shown in Table 3-8.
Table 3-8. Frequency table of each group in different indicators from the design alternatives descriptions.
Group Script video Freely navigation Freely navigation after
script video χ2 P
Professional background With Without With Without With Without
Design concepts 35 44 31 17 60 40 6.433* 0.040
Design goals 30 25 26 14 31 17 1.488 0.475
Design partitions 47 43 40 20 54 36 3.192 0.203
Functions and features of design 65 72 66 59 67 68 0.755 0.686
Defects of design 10 5 12 5 13 8 0.320 0.852
* Significant at the 0.05.
As shown in Table 8, there was significant differences among the three groups in the under- standing and evaluation of design concepts (χ2=6.433,p=0.040<0.05). Nevertheless, there was no significant differences in the other indicators. The boxplot of total frequencies of design concept expressions among three groups is shown in Figure 3-8.
Figure 3-8 Boxplot of total frequencies of design concept expressions among the three groups
To sum up, participants of freely navigation after script video group have the highest frequency in expressing design concepts. To a certain extent indicated that freely navigation after script video affects participants’ cognition and evaluation of the design concepts, and VR integrated APS can improve their urban design concepts understanding.
Chapter 4: Cloud-based VR Integrated APS for Under- standing Urban Design Concepts in Consensus Process
In this Chapter, we contribute an application of Cloud-based VR integrated APS for providing a broader participation way for users to understand urban design concepts in consensus process.
4.1 Introduction
Understanding urban design concepts is the most important for achieving consensus. Thus, this chap- ter will focus on how to enhance the efficiency of design concepts understanding in consensus process through using cloud-based VR integrated APS.
4.2 Virtual Environment Design Approach
In virtual environment design, UC-win/Road is a software platform that is used to generate and pre- sent a visible and interactive 3D environment. SketchUp will be used to create 3D models, and export to
“*.3d” format, and import the 3D models to design the basic environment. Simulation scenarios will be created that help client users to understand the different functions of Disaster Prevention Park in normal time and in disaster time. APS will be designed to express the design concepts and more clearly.
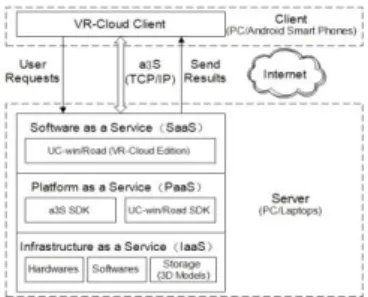
4.3 Cloud-based Virtual Reality Platform
The framework of Cloud-based VR Platform is shown in Figure 4-1. The working process of Cloud Server is shown in Figure 4-2.
8
Figure 4-1. The framework of Cloud-based VR Platform. Figure 4-2. The working process of Cloud Server.
According to the requirements of design program, we load the terrain data of southwest of China and import the street map of the inside of Bei San Huan Road in Chengdu city, as shown in Figure 4-3.
Figure 4-3. Load terrain data and street map. Figure 4-4. 3D modelling in SketchUp Pro 2015.
Figure 4-4 shows one of landscape model which was created by SketchUp, and Figure 4-5 shows the virtual environment of design alternatives after imported the 3D models. Figure 4-6 shows the simulation scenario of playground in normal times.
Figure 4-5. The virtual environment of design alternatives. Figure 4-6. Simulation scenario of playground in normal times.
4.4 Case Study: Planning and Design of One Foundation Disaster Prevention Park 4.4.1 Functional Orientation of Disaster Prevention Park
One Foundation Disaster Prevention Park covers an area of 160 acres. The functional orientation and supporting facilities of One Foundation Disaster Prevention Park were shown in Table 4-1.
Table 4-1. The functional orientation and supporting facilities of Disaster Prevention Park.
Time Main function Supporting facilities
In normal times Rest and recreation Playground, leisure square, landscape and make green by
planting trees, flowers, etc.
Education and training
Classrooms, relief exhibition hall, disaster prevention training center, earthquake experience room, reading room, etc.
Daily operations The park management office, relief product exhibition hall, sales department, catering center, accommodation center, etc.
In disaster times
Emergency command center
Information summary room, commander room, lounge, office equipment, communications equipment, emergency medical service location, etc.
Emergency Shelters
Emergency tent dormitory, emergency water supply facilities, emergency toilets and bathing facilities, emergency power supply facilities, emergency sewage system, etc.
The residence of relief workers and relief supplies distributing center
Relief supplies reserve and distribution center, parking, rescue helicopter landing sites, accommodation center, etc.
4.4.2 Design Concepts Understanding and Design Alternatives Evaluating in Consensus Process
9
Figure 4-7 showed the working process for reaching a consensus in design report meeting. Users can input the server’s IP address to connect with the Cloud Server, and then enter the virtual environment, as is shown in Figure 4-8. In this Chapter, we focused on the architectural design of Disaster Management Center and the infrastructure planning of the park since the two parts are the core content of the construction of Disaster Prevention Park.
Figure 4-7. The working process in design report meeting. Figure 4-8. Enter the virtual environment.
4.4.2.1 Architectural Design of Disaster Management Center (DMC)
During the discussion, we modified the first alternatives in the virtual environment combined with the suggestions of the users, and proposed the second alternatives. The two alternatives were as shown in Figure 4- 9 and Figure 4-10 respectively, and we reached a consensus on the second alternatives eventually.
Figure 4-9. Functional planning of DMC Figure 4-10. 3D effect drawing of DMC
4.4.2.2 Infrastructures planning of Disaster Prevention Park
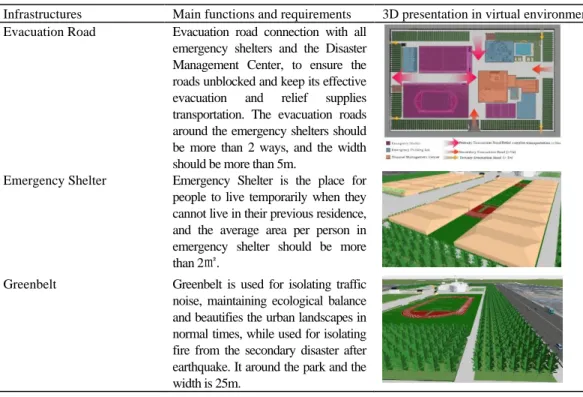
We planning and design the infrastructures of One Foundation Disaster Prevention Park based on the standards of “Emergency shelter for earthquake disasters-site and its facilities” in China, as shown in Table 4-2.
Table 4-2. Infrastructures planning of One Foundation Disaster Prevention Park.
Infrastructures Main functions and requirements 3D presentation in virtual environment Evacuation Road Evacuation road connection with all
emergency shelters and the Disaster Management Center, to ensure the roads unblocked and keep its effective evacuation and relief supplies transportation. The evacuation roads around the emergency shelters should be more than 2 ways, and the width should be more than 5m.
Emergency Shelter Emergency Shelter is the place for people to live temporarily when they cannot live in their previous residence, and the average area per person in emergency shelter should be more than 2㎡.
Greenbelt Greenbelt is used for isolating traffic noise, maintaining ecological balance and beautifies the urban landscapes in normal times, while used for isolating fire from the secondary disaster after earthquake. It around the park and the width is 25m.
10
Infrastructures Main functions and requirements 3D presentation in virtual environment Emergency Water Supply Emergency water supply including
swimming pool and water tank. In disaster times, the water stored in swimming pool can be used for bathing, washing and flushing toilets, while the water tank can provide drinking water for the first period that people can survive in three days.
Emergency Power Supply Emergency power supply including solar photovoltaic system and minitype dynamotor, that can provide power for living, medical treatment and communication in disaster times.
Emergency Communication Emergency communication can be used for contact with the outside world when wireline, cell phones and other conventional means of communica- tions fail in disaster times.
In the virtual environment, the users viewed the design alternatives according to our design concept, and dis- cussed the infrastructures planning with us enthusiastically, then advised to increase emergency toilets and bathing facilities in infrastructure planning, and these facilities will not affect the park in normal times as far as possible. So, we considered using septic tank under the ground, then covered lawn and reserved sewage covers on the ground.
Figure 4-11 shows the planning of emergency toilets and bathing facilities in Disaster Prevention Park.
Figure4-11. Emergency toilets and bathing facilities
Chapter 5: Conclusion
In this PhD research, we integrated Cloud-based VR and APS to provide a broader participation platform to create a common virtual scene for improving users’ urban design concepts understanding in consensus process. Through this platform, the users can clearly understand the design concepts and engage with the discussion of design concepts and design alternatives. As a research for planning support system, we took three new techniques of VR application in urban planning and design as our focus, respectively they are: 3D laser scanning, APS, and Cloud-based VR. The three new techniques we focused in this PhD research are useful for data collection, mapping and modeling, improving users’ urban design concepts understanding, and eventually reaching a consensus on design concepts and design alternatives.
However, there still are a few limitations in this stage, including the 3D modeling method using point clouds, the degrees-of-freedom devices for users and the model editing capabilities of Cloud-based VR platform. Therefore, for future work, software technology capable of automatic fitting point clouds and generating 3D model needs further development and improvement. Moreover, more degrees-of-freedom interface devices, such as Augmented Reality (AR) devices should be considered in future applications to enhance participants’ interaction with virtual environment. Last but not the least, more comprehensive model editing capabilities of Cloud-based VR platform should be developed to conveniently modify or replace 3D models of the design alternatives during the discussion process, so that provide an advanced and efficient platform for urban planning and design.