Application of Cloud‑based Virtual Reality Integrated Automatic Presentation Script for Understanding Urban Design Concepts
著者 張 遠翼
著者別表示 Zhang Yuanyi journal or
publication title
博士論文本文Full 学位授与番号 13301甲第4483号
学位名 博士(学術)
学位授与年月日 2016‑09‑26
URL http://hdl.handle.net/2297/46587
doi: 10.14246/irspsd.3.2_53
Application of Cloud-based Virtual Reality Integrat- ed Automatic Presentation Script for Understanding
Urban Design Concepts
Yuanyi Zhang September, 2016
Dissertation
Application of Cloud-based Virtual Reality Integrated Automatic Presentation Script for
Understanding Urban Design Concepts
Graduate School of
Natural Science and Technology Kanazawa University
Major subject: Environmental Science Course: Environmental Planning
School registration No.: 1323142009 Name: Yuanyi Zhang
Chief advisor: Professor Zhenjiang Shen June, 2016
Abstract
This PhD research targets to provide a new method that combined a useful presen- tation technology (APS) with an effective communication platform (Cloud-based VR), as a broader participation platform to create a common virtual scene for im- proving users’ urban design concepts understanding in consensus process. We attempted to build a Cloud-based VR platform to proposing urban design concepts, and created APS for auxiliary guiding users to understand the design concepts, so that they can evaluating and deliberating design concepts through the Internet.
The research starts from VR presentation using 3D laser scanning technology for historic building mapping and modeling, as a new method to obtain data source for APS. We took Shang Shu Di, a Ming Dynasty building which is an officially protect- ed heritage site of China as a case study, and compared the mapping results of detailed components with the traditional method. Aimed at the technical problems of the huge amount of data generated in the application process and the software defects of Cyclone, we presented two solutions which are “reasonable data collection and processing” and “construction of historic building components database”.
Then, we seek to find a solution for the problem of how to improve users’ urban design concepts understanding through available communication media and useful presentation technology (VR integrated APS). This research recruited 60 participants to view the script video (the running result of APS) or/and freely navigate in the virtual environment of Tatsumi region in Tokyo Bay Zone of Japan. By analyzing the data of subjective feedbacks, the research examined how APS affect participants’
cognition and evaluation of Sustainable Taches and Reactivate Space (STARS, the design concepts). Moreover, qualitative interview was developed to further under- stand participants’ design concepts understanding, and validated whether VR integrated APS can improve users’ urban design concepts understanding.
After that, in order to provide a broader participation way for users to understand design concepts, this PhD research applied the Cloud-based VR platform in a design report meeting of One Foundation Disaster Prevention Park project. We built a Cloud- based VR platform to proposing design concepts, and created APS for auxiliary guiding users to understand the concepts of urban design and deliberate the design alternatives through the Internet.
Keywords: Automatic Presentation Script (APS), Urban Design Concepts, Understanding, Virtual Environment, Online Discussion, Cloud-based VR, Sustainable Urban Design, Quantitative and Qualitative method.
Acknowledgments
I am grateful to all those who directly and indirectly contributed for the success- ful achievement of this work.
The most heartfelt thanks go to my supervisors, Prof. Shen Zhenjiang, Prof.
Chikata Yasuo, and Prof. Ito Satoru. Their immeasurable support, constant incentive and guidance were crucial for the development of this thesis.
I would like to thank Associate Prof. Nishino Tatsuya and Associate Prof. Qing Xiaoli for being members of my dissertation review panel and for all valuable comment they provided.
My sincere and thanks go to Dr. Kobayashi Fumihiko for help and valuable advices.
I also would like to thank the Urban Planning Laboratory for the support and physical conditions it provided for the development of this research. I should also thank the help and support of my friends at the Urban Planning Laboratory.
I am very grateful to the reviewers for the comments on manuscript and also the China Scholarship Council to support my study at Kanazawa University for three years.
Last, but not least, I would like to thank my families in China, and my colleagues at Fuzhou University for their constant support and encouragement throughout my academic life.
Thank You Very Much!
Contents
Application of Cloud-based Virtual Reality Integrated Automatic Presentation Script
for Understanding Urban Design Concepts ... i
Abstract ... i
Acknowledgments... iii
Chapter 1 : Introduction ... 1
1.1 Research Background ... 1
1.2 Research Objectives ... 3
1.3 Literature Review ... 3
1.3.1 The Importance of Urban Design Concepts ... 3
1.3.2 Communication Medias in Urban Planning and Design ... 4
1.4 Research Method and Thesis Structure ... 6
Chapter 2 : Virtual Reality Presentation Using 3D Laser Scanning Technology ... 8
2.1 Introduction ... 8
2.2 Virtual Reality based on 3D Laser Scanning Technology ... 10
2.3 3D Laser Scanning Technology for Historic Building Mapping and Modeling ... 12
2.3.1 Data Collection Outdoors ... 13
2.3.2 Data Processing Indoors ... 14
2.4 Comparison of 3D Laser Scanning Technology with Traditional Method in Detailed Components Mapping ... 19
2.5 Solutions for the Huge Amount of Data ... 22
2.5.1 Reasonable Data Collection and Processing ... 22
2.5.2 Construction of Historic Building Components Database ... 25
2.6 Conclusions in this Chapter ... 26
Chapter 3 : Virtual Reality Integrated Automatic Presentation Script for Improving Urban Design Concepts Understanding ... 28
3.1 Introduction ... 28
3.2 Implementation of the STARS in Tatsumi Region of Tokyo Bay Zone, Japan ... 31
3.2.1 Case study location ... 31
3.2.2 Implementation of STARS Using VR Integrated APS Technology .... 32
3.3 Method and Validation ... 38
3.3.1 Participants ... 38
3.3.2 Procedure ... 39
3.4 Results of Questionnaires ... 41
3.4.1 Reliability Analysis ... 41
3.4.2 Cognition of the STARS ... 41
3.4.3 Evaluation of the STARS ... 43
3.5 Results of Qualitative Interview ... 45
3.6 Conclusion and Future Work in this Chapter ... 47
Chapter 4 : Cloud-based Virtual Reality Integrated Automatic Presentation Script for Understanding Urban Design Concepts in Consensus Process ... 49
4.1 Introduction ... 49
4.2 Virtual Environment Design Approach ... 52
4.2.1 Basic Environment Design ... 52
4.2.2 Design Concepts expression ... 53
4.3 Cloud-based Virtual Reality Platform ... 53
4.3.1 The Framework of Cloud-based Virtual Reality ... 54
4.3.2 The Working Process of Cloud Server ... 55
4.4 Case Study: Planning and Design of One Foundation Disaster Prevention Park ... 57
4.4.1 Functional Orientation of Disaster Prevention Park ... 58
4.4.2 Design Concepts Understanding and Design Alternatives Evaluating in Consensus Process ... 59
4.5 Conclusion in this Chapter ... 64
Chapter 5 : Conclusion ... 66
Publications: ... 69
Appendix: ... 70
A. Design Concepts of the STARS ... 70
B. Questionnaires and Interviews ... 71
References ... 74
List of Figures
Figure 2-1 3D spatial coordinates of measuring pointP(x,y,z) ... 11
Figure 2-2 The flow chart of virtual reality presentation based on 3D laser scanning technology ... 12
Figure 2-3 The flow chart of 3D laser scanning technology used in historic building mapping... 13
Figure 2-4 The measuring sites and measuring targets ... 14
Figure 2-5 The drawing of the entrance plane section from the point clouds ... 15
Figure 2-6 The drawing of the entrance vertical face section from the point clouds .. 15
Figure 2-7 The drawing of the entrance profile section from the point clouds ... 16
Figure 2-8 The plane drawing of the entrance ... 16
Figure 2-9 The vertical face drawing of the entrance ... 16
Figure 2-10 The profile drawing of the entrance ... 17
Figure 2-11 3D modeling of historic building (one historic building in Shang Shu Di project) ... 18
Figure 2-12 3D space image of Shang Shu Di ... 18
Figure 2-13 Extracted point clouds of the Dougong beams above Gold Pillar ... 19
Figure 2-14 The drawing of the Dougong beams above the Gold Pillar using the point clouds ... 20
Figure 2-15 The profile drawing of the Dougong beams above the Gold Pillar ... 20
Figure 2-16 Comparison of mapping results of 3D laser scanning technology and traditional method in detailed components ... 21
Figure 2-17 The spacing and data of one site’s data point cloud at different scanning resolutions ... 22
Figure 2-18 Noise caused by the passing vehicles or pedestrians ... 24
Figure 2-19 The point clouds after noise elimination ... 24
Figure 3-1. Project location: Tatsumi region in Tokyo Bay Zone of Japan. ... 31
Figure 3-2. Virtual environment of the STARS. ... 34
Figure 3-3. Implementation of STARS Using VRIAPS ... 36
Figure 3-4. Implementation of advocate eco-city planning concept through APS (APS: Automatic Presentation Script; VE: Virtual Environment) ... 37
Figure 3-5. Automatic presentation script of STARS and its running result ... 38
Figure 3-6. (a) Adding functional urban facilities and space; (b) Adding bicycle transportation network, utilization of solar energy and wind power; (c) Providing an
attractive environment. ... 40
Figure 3-7. .Boxplot of total frequencies of design concept expressions among the three groups. ... 47
Figure 4-1. The framework of Cloud-based VR Platform. ... 54
Figure 4-2. The working process of Cloud Server. ... 55
Figure 4-3. Load terrain data and street map. ... 56
Figure 4-4. 3D modelling in SketchUp Pro 2015. ... 56
Figure 4-5. The virtual environment of design alternatives. ... 57
Figure 4-6. Simulation scenario of playground in normal times. ... 57
Figure 4-7. The working process of consensus building in design alternatives report meeting. ... 60
Figure 4-8. Enter the virtual environment. ... 60
Figure 4-9. Functional planning of Disaster Management Center in two alternatives 62 Figure 4-10. 3D effect drawing of Disaster Management Center in two alternatives . 62 Figure 4-11. Emergency toilets and bathing facilities ... 64
List of Tables
Table 2-1 Comparison results of the two methods corresponding to Figure 2-15 ... 21
Table 2-2 Scanning accuracy and vision angle in different mapping objects ... 23
Table 2-3. 3D data information table of pillars. ... 25
Table 2-4. The database structure for a single building. ... 26
Table 3-1 Cronbach’s alpha values for all scales. ... 41
Table 3-2. Descriptive statistics of the cognition of STARS (M±SD). ... 42
Table 3-3. Analysis of variance (ANOVA) for the cognition of STARS. ... 42
Table 3-4. Multiple comparisons for the cognition of STARS. ... 43
Table 3-5. Descriptive statistics of the evaluation of design concepts (M±SD). ... 44
Table 3-6. Analysis of variance (ANOVA) for the evaluation of design concepts. . 44
Table 3-7. Multiple comparisons for the evaluation of design concepts. ... 45
Table 3-8. Frequency table of each group in different indicators from the design alternatives descriptions. ... 46
Table 4-1. The functional orientation and supporting facilities of Disaster Prevention Park. ... 59
Table 4-2. Infrastructures planning of One Foundation Disaster Prevention Park. ... 63
List of Equations
Equation 2-1 S... 11
Equation 2-2 x ... 11
Equation 2-3 y ... 11
Equation 2-4 z ... 11
Chapter 1 : Introduction
This Chapter will set the stage for the remainder parts of this dissertation. First, I will describe how I arrived at this research topic from the dilemma in understanding urban design concepts and the technical efforts. Second, I will outline the objectives of this dissertation. Third, I will review previous research on the importance of urban design concepts and communication medias from the perspective of urban planning and design. Finally, I will introduce the method of this PhD research, and close with a brief preview of the chapters of this dissertation.
1.1 Research Background
Urban design concepts are designed to serve as the design visions for what the city might become in the future, they provide the overall objectives of urban design and the solutions in dealing with urban issues (such as spatial organization, transpor- tation, built environment), as well as lead the way for design decisions (Roberts and Greed, 2014). However, it is difficult for users to understand urban design concepts or even misunderstanding, due to a lack of user interaction and clear information exchange between users and designers during the top-down planning process (McTague & Jakubowski, 2013). The findings echo the recent experiences in Western countries that emphasize the needs of interaction, negotiation and available communication media in the urban planning and design process (Luo, X.L. et al., 2008; Liu, L. A. et al., 2012).
On the other hand, computer advances in recent decades have contributed to the emergence of graphic and multimedia technologies, and their outcomes as an availa- ble communication media which make massive changes to the way we experience, as well as to the sustainable development process, and to the way professionals collabo- rate and involve the public (Jutraz, A. & Zupancic, T., 2015). For instance, 2D plans (mainly including sketch, map, CAD, GIS) and multimedia (mainly including text message, sound, video, and animation) always been used for designers to express urban design concepts and exchange information with their users. However, it is commonly acknowledged that only users with professional skills can clearly under- stand 2D plans. Multimedia, such as video, can help users understand urban design
concepts easily, but fixed route often restricts their vision when they want to further evaluate the design concepts.
3D visualizations attempt to improve the above disadvantages. VR is one of the innovations that can provide a virtual environment for user interaction, while 3D modeling seems to bear the brunt of this innovation. 3D modeling used to be consid- ered as an effective method to express urban design concepts (WG II, 2004).
However, traditional 3D modeling is time-consuming, as manual data collecting and mapping are required for each component as well as for the whole scene, and there were measured omissions and mistakes which affect users’ cognition and evaluation of the design concepts (Chen & Truc, 2008). Moreover, it is difficult for users to clearly understand the design concepts even though they can interact with the virtual environment without any auxiliary guidance. Furthermore, face-to-face discussion (fixed schedule and venue) usually is required for users to discuss urban design concepts with their designers.
As the Internet is becoming popular, VR similarly integrate with Web technology is regarded as good ways to replace face-to-face discussion that allow wide participate to design concepts discussion. For example, Virtual Reality Modeling Language (VRML) often been used as an online visualization tool to create a sharing virtual environment for conveying design concepts and decision making through the Internet (Shen, Z., & Kawakami, M., 2010). However, the inefficient programming interface always discourages these designers without computer programming skills; and most online VR platforms have the limitations of data compression and network bandwidth in currently that the Clients (users’ computers) need to download the virtual environ- ment and models from the Sever.
As mentioned above, these have consequently increased the needs of data collec- tion and available communication media as well as broader participation ways for improving users’ urban design concepts understanding. Automatic presentation script (APS) is a presentation technology which can combine different kinds of communica- tion medias (including 2D plans, multimedia and 3D visualization) to express urban design concepts more clearly; and cloud-based virtual reality (Cloud-based VR) platform can provide synchronous transmission and interactive services for large amounts of data, such as video, 3D model and virtual scene. The integration of Cloud- based VR with APS will shed light on the future use as an efficient method that users can better understand urban design concepts as well as evaluate design concepts,
especially in today's increasingly prominent social contradictions and highly competi- tive world.
1.2 Research Objectives
Based on the problems above, this dissertation has some objectives to give the solution, there are:
1. Propose a new method to obtain 3D data for mapping and modeling as a data source for APS, and verify the advantage of 3D laser scanning technology in data collection.
2. Improve users’ understanding of urban design concepts through using VR in- tegrated APS, and examine it effect on users’ cognition and evaluation of urban design concepts.
3. Provide a broader participation way for users to understand urban design con- cepts in consensus process through using Cloud-based VR integrated APS.
1.3 Literature Review
1.3.1 The Importance of Urban Design Concepts
Urban design concept which is outlines design ideas for the future development of key areas in a city (Wallace Roberts & Todd, 1991). It is not intended to be a complete, nor a static image of an ideal “future” for the city. Rather, it is an attempt to visualize certain aspects of future development that are considered essential to the continued success and improvement of the urban environment.
As noted by Moughtin (2003), an urban design concept strongly associated with sustainable development is the idea of mixed land use. Generating design ideas for solving problems of urban structure is fundamental to urban design, and generating concepts is an act of the imagination. Design concepts are the basic of the creative process; without them the process of urban design degenerates into a sterile activity (Cuesta, R., et al., 2012).
Consequently, urban design concepts play an important role in the process of ur- ban planning and design (Kua, 2012; Sundaram, 2013; Minatani, 2010), and the innovation of design concept conjunction with technology will provide new direction for dealing with design issues. For instance, Chen and Zhu (2012) emphases innova- tion of design concept and technology, they carries out beneficial attempts on
harmony with the environment, view effect of the appearance, optimized structure, systematizes, economical efficiency, etc., and acquired good effect. Their design concept and technical measures provide lesson and reference for the future bridge design of passenger dedicated line.
A clear understanding of what the design concepts means are important for users.
Because of any theoretical or empirical work in which design is a construct, a clear definition will help ensure construct validity. Furthermore, a clear understanding of the meaning of design concepts will facilitate developing measures of design-related constructs, such as design project success (Ralph and Wand, 2009).
1.3.2 Communication Medias in Urban Planning and Design
In the process of urban planning and design, one of the challenges for planners or designers is to communicate with their users, and convey the design concepts to them (Ding S. N., 2008). Thus, communication media plays an important role due to it will directly determine the users’ understanding level for the urban design concepts. Even with the broad variety of communication media available today (e.g. sketches, CAD, GIS, videos, 3D models, point clouds, VR, express meaningful visual information through using different types of communication media usually be neglected that effect on the communication process (Hasebrink and Domeyer, 2012).
Typically, planning supports always use 2D plans (such as Sketch, CAD, GIS) to present design concepts and communicate ideas (Kibria, M. S., 2008). However, users usually have trouble to understand CAD and GIS document files which can lead to discontentment with the end result, and technical training, and specialized software are usually a prerequisite to interpret those (Joseph R. and Perera U., 2013; Wu et al., 2010). Sketches are often favored by designers as a method to present initial design concepts in a more fluid style for communication, on the other hand, comparatively little is known about the pact on viewers of designers’ design concepts (Bates-Brkljac N. et al., 2009).
Additionally, some 3D modeling tools such as 3DS Max, SketchUp, Maya allow designs to create accurate and reality models which are the representations of an urban environment with a three-dimensional geometry of common urban objects and structures, with buildings as the most prominent feature. However, the outcomes of manual data collecting and mapping also will affect users’ understanding level as mentioned in the previous section; and the way to experience the city in these models
is usually restricted to a “bird’s eye view” which makes the assessment of implica- tions of new developments at a human scale almost impossible; and currently, many modeling software are not flexible tools to demonstrate the effects of new develop- ments in the urban fabric (Horne, M. et al., 2007; Biljecki, F. et al., 2015).
What is more, the combination of multimedia and multimodal facilities such as text, graph and image and the Internet can be employed to express urban design concepts that likely to evoke users’ cognitions and reaction (Brockmeier, 2010;
Felasari and Peng, 2012). Such approaches can construct regional “stories” of possi- ble futures, informed by collated historical narratives, so as to better forecast evolutionary effects on an urban environment (Foth, M. et al., 2007; Banai, R., 2010).
However, viewed and fixed route, which restricts percept of the environment and thus to an extent predetermines feedback. As in serial vision, the field of vision is too narrow to truly represent and capture what human eyes can see (Carmona M. et al., 2003).
Over and above, new forms of communication media emerged in recent years.
For example, Google Maps and Google Earth can be used by professional users and lay persons without intense training (Phan and Choo, 2010); and VR also is recog- nized as an effective communication media that provide opportunities to advance communication among different users, to convey urban design concepts, and to reduce the time in consensus process significantly (Abdelhameed, W., 2012; Yang, X.
et al., 2015). However, convey a clear design concepts to users is impossible simply by using VR; many methods of presenting virtual environments can be prohibitively expensive or require specialist equipment and programming (Conniff A. et al., 2010), as well as the integration of additional objects representing vegetation and street regions (Haala N. et al., 2005). Moreover, even the users can freely navigation (means interaction) in the virtual environment; it is difficult for them to clearly understand the designer’s intentions without any auxiliary guidance (Zhang, et al., 2015).
In consequence, there is a need for techniques which can combine the advantages of different types of communication medias to assist in systematic express urban design concepts more clearly, and guide users purposefully walkthrough in the virtual environment to further understand urban design concepts.
1.4 Research Method and Thesis Structure
To address the deficiencies above, this PhD research presents a new way that combined a useful presentation technology (APS) with an effective communication platform (Cloud-based VR), as a broader participation platform to create a common virtual scene for improving users’ urban design concepts understanding level.
Through this platform, users can be able to communicate more effectively about the issues in reaching a consensus in urban design concepts in consensus process.
The research starts from the VR presentation using 3D laser scanning technology for historic buildings mapping and modeling, as a new method to obtain data source for APS. In this research, we will take Shang Shu Di, a Ming Dynasty building which is an officially protected heritage site of China as a case study, and compare the mapping results of detailed components with the traditional method. Aimed at the technical problems of the huge amount of data generated in the application process and the software defects of Cyclone, we will attempt to present solutions.
Then, we seek to find a solution for the problem of how to improve users’ urban design concepts understanding through available communication media and useful presentation technology (VR integrated APS ). This research recruited 60 participants (half of the participants who have the professional background of Architecture, Urban Planning, or Landscape Architecture) to view the script video (the running result of APS) or/and freely navigate in the virtual environment of Tatsumi region in Tokyo Bay Zone of Japan. By analyzing the data of subjective feedbacks, the research will examine how APS affect participants’ cognition and evaluation of Sustainable Taches and Reactivate Space (STARS, the design concepts). Moreover, qualitative interview is developed to further understand participants’ design concepts understanding, and validate whether VR integrated APS can improve users’ urban design concepts understanding.
After that, in order to provide a broader participation way for users to understand design concepts, this PhD research applied the Cloud-based VR platform in a design report meeting of One Foundation Disaster Prevention Park project. We built a Cloud- based VR platform to proposing design concepts, and create APS for auxiliary guiding users to understand the concepts of urban design and deliberate the design alternatives through the Internet.
The whole research is organized into 5 Chapters. We started from Chapter 1 for Introduction and following it we will introduce the importance of urban design concepts and communication medias from the perspective of urban planning and design; Chapter 2 about the VR presentation using 3D laser scanning technology for historic buildings mapping and modeling, as a new method to obtain data source for APS; Chapter 3 targeted on using VR integrated APS to improving urban design concepts understanding, we will take Tatsumi region in Tokyo Bay Zone of Japan as a case study; Chapter 4 about Cloud-based VR integrated APS for improving urban design concepts understanding in consensus process; Last, we make a conclusion on this PhD research in Chapter 5.
Chapter 2 : Virtual Reality Presentation Using 3D Laser Scanning Technology
This Chapter aims to research on the VR presentation using 3D laser scanning technology in historic buildings mapping and modeling, as a new method to obtain data source for APS. We took Shang Shu Di, a Ming Dynasty building which is an officially protected heritage site of China in Taining County of Fujian Province, as a case study, and compared the mapping results of detailed components with the traditional method. Aimed at the technical problems of the huge amount of data generated in the application process and the software defects of Cyclone, we presented two solutions which are “reasonable data collection and processing” and
“construction of historic building components database”.
2.1 Introduction
As stated by Kim (2004), any 3D visualization method typically involves three main construction steps: data collection, 3D modeling, and presentation. Moreover, reconstructing buildings and scenes in a realistic fashion is a popular topic in Virtual Reality (VR) projects, whereas in recent years the main focus of research concentrat- ed on 3D reconstruction based on mapping and modeling (Abmayr, T. et al., 2004).
Thus, data collection is necessary for building a replica of the physical object, such as topography, building heights and dimensions.
The traditional tools for data collection of the historic buildings are ruler, tape measures, benchmarks and so on. However, interpretation of records is done by the human eyes and most of the measuring is of “a part taken from the whole”, that is, a small component is deduced from the whole is based on assumptions of similarity (Zang, C., 2006). Such data collection results in a considerable extent being dependent on personal experience and temporary judgment, which cannot accurately depict specific components, especially in shaped and complex components with detailed spatial characteristics. Hence, advanced data collection tools and technologies are needed that enablers for effective e-planning in the built and human environment (Arayici, Y. et al., 2005). 3D laser scanning technology is a fast, accurate, and cost-efficient method of gathering three-dimensional data for use in
mapping and 3D modeling (Pucci, B. et al., 2009). Compared with traditional data collection methods, laser scanning technology has particular superiority as follows (Cheng, X. J. and Jin, W., 2006):
is a sort of untouched measure system;
gains the 3D coordinates, reflecting intensity etc. on object surface;
rapidity of data acquisition, great quantity of data and high accuracy;
works in all kinds of environments;
extensive application.
As a new technique for quickly getting three-dimensional information, 3D laser scanning technology has been widely used in many fields, including urban planning and design. For example, in order to refurbish and extend a conference center which only incomplete records of the original building existed to meet modern requirements, Saal, K. (2010) using 3D laser scanning technology to capture the existing features of the old conference hall and its surroundings, then using the acquired data to architectural consultants for their designs and for virtual “tours”. Bloomberg, M. R. et al. (2012) also using 3D laser scanning technology to rapidly capture existing conditions of a building (interiors and exteriors) and natural environments (landscape), and incorporating it back into the BIM as existing conditions.
Added to this, Huo, X. et al. (2013) described the process of applying of modern digital heritage recording and investigation technology (3D laser scanning technology) in the preservation of Wenming historical and cultural blocks in Kunming of China and argues that 3D laser scanning technology is capable of producing a complete and efficient workflow, as well as providing fundamental technical support for heritage preservation work. Armesto-González et al. (2010) presented a methodology to combine the technology of the terrestrial laser scanner with the techniques of digital image processing to study damage on stony materials that constitute historical buildings.
Moreover, Lim, E. H. (2012) proposed an application that using scanning data for 3D urban modeling, and solved some of the existing challenges in 3D urban modeling, such as time-consuming and large amount of data. Besides, Mahdjoubi et al. (2013) established the case and rationale for the adoption of BIM and laser scanning technologies in the real-estate services sector.
Beyond that, Holopainen et al. (2013) used airborne (ALS), terrestrial (TLS) and mobile laser-scanning (MLS) methods in urban forest (trees) mapping and monitoring.
Jia-Chong et al. (2007) used 3D laser scanning and a global positioning system (GPS) to acquire landslide data and to compute earthwork volume. Over and above, in order to statistics on street-side car parks, e.g. occupancy rates, parked vehicle types, parking durations, and provide important urban street information for urban planning and policy making, Xiao, W. et al. (2016) designed a complete system for car park monitoring, including vehicle recognition, localization, classification and change detection, from the 3D laser scanning point clouds. The point clouds are firstly classified as ground, building façade, and street objects which are then segmented using state-of-the-art methods. Their research results shown that the vehicle recognition, classification and change detection accuracies are 95.9%, 86.0% and 98.7%, respectively.
In consequence, this research will take Shang Shu Di, a Ming Dynasty building which is an officially protected heritage site of China in Taining County of Fujian Province, as a case study, and study the application of 3D laser scanning technology in historic buildings mapping and modeling. Then validate the advantages of 3D laser scanning technology in data collection for mapping through a comparison with traditional methods in detailed components mapping. Finally, two solutions for the huge amount of data generated in the process of the application of 3D laser scanning technology will be studied and presented.
2.2 Virtual Reality based on 3D Laser Scanning Technology
3D modeling is the important contents in Virtual Reality (VR) presentation. So the accurate and realistic 3D models play a key role in the creation of immersion virtual scenes. In order to successfully achieve this virtual representation, the real world scenario and other significant objects must be realistically designed, with accurate geometry and detailed textures (Caracena, T. M. et al., 2014). However, it is a significant deficiency that the creation of 3D models currently based on image and traditional data collection methods, which result in time-consuming and inaccurate modeling task (LI, H. et al., 2007). The appearance of 3D laser scanner has the capable of improving the above deficiency. In many fields, 3D laser scanners are widely used to acquire 3D point clouds of physical objects in real world (Danhof, M.
et al, 2015).
The 3D laser scanner targets physical objects to be scanned and the laser beam is directed over the object in a closely spaced grid of points. First, the scanner emits a laser beam to the surface of the physical object for each measuring point P(x,y,z) , then the laser beam will reflect back to the scanner, and the 3D laser scanner will measure the flight time of laser beam, which is the time of the laser travel from the scanner to the physical object and back to the scanner. Since the speed of light is a constant (c3108m/s), thus the scanner can calculate the distance S, which is from the surface of the physical object to the 3D laser scanner:
Equation 2-1 S
t c S
2 1
Suppose is the angle between the laser beam and the vertical direction, and is the angle between the laser beam and the horizontal direction, as illustrated in Figure 2-1. Thus, the 3D spatial coordinates of P(x,y,z) are:
Equation 2-2 x
sin cos
S
x
Equation 2-3 y
cos cos
S
y
Equation 2-4 z
sin
S
z
Figure 2-1 3D spatial coordinates of measuring pointP(x,y,z)
As a result, the “point clouds” (or cloud of points), which consists of thousands of points in a 3D space that are a dimensionally accurate representation of the existing
object, is one of the data sources that can be used to show 3D representation of the physical objects, as well as for mapping and modeling (Arayici, Y., 2007; RUSU, R.
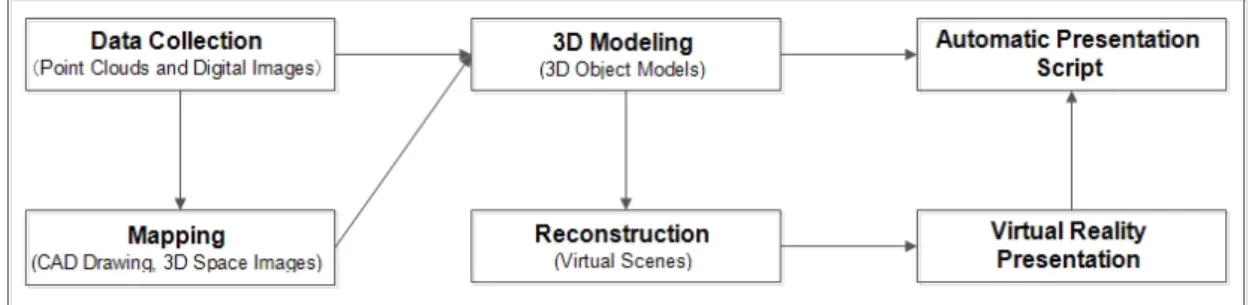
B. et al., 2008). Figure 2-2, illustrates the flow chart of virtual reality presentation based on 3D laser scanning technology.
Figure 2-2 The flow chart of virtual reality presentation based on 3D laser scanning technology
3D modeling refers to the process of creating a 3D replica based on the mapping results, as supplemental to the traditional form of urban design representation (such as 2D plans, sketches, CAD), 3D Modeling play an important role in Urban Planning and Design (Velazco, E., 2012). Buildings, landscapes (including plants and trees) and city facilities models are considered as the most important objects for the creation of virtual environments (Eran, S. et al., 2005). VR presentation step involves intui- tively displaying 3D model and reconstruction results to the users. The user interface and the type of information delivered through the presentation can vary dramatically.
The development of 3D laser scanning technology will enhance the virtual repre- sentation capability of VR presentation and lay a good foundation. Thus, in the application of VR presentation based on 3D laser scanning technology has an ex- tremely important significance.
2.3 3D Laser Scanning Technology for Historic Building Mapping and Modeling
In this Chapter, we used a 3D laser scanner “Scanstation C10” (It is a terrestrial laser scanner), which was produced by Leica Company, to collecting point clouds of Shang Shu Di (It is a historic preservation project for the local government). The scanner has many merits, such as high accuracy, works in all kinds of environments, is multidimensional, has easy operation and so on, so it has the strong superiority of being able to rapidly obtain 3D data for creating 3D models (Fan, Y. et al., 2012). The application of 3D laser scanning technology in historic building mapping and model- ing is mainly composed of data collection outdoors and data processing indoors.
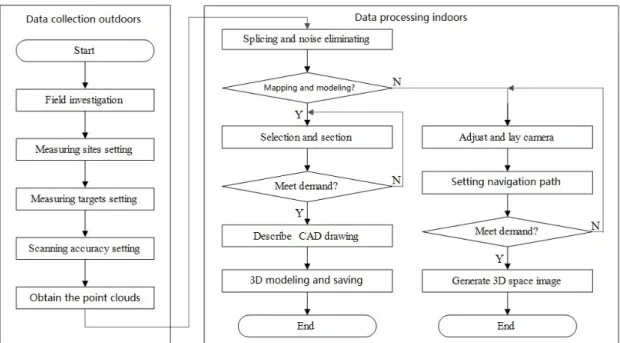
Figure 2-3, below, illustrates the flow chart of 3D laser scanning technology for historic building mapping and modeling.
Figure 2-3 The flow chart of 3D laser scanning technology for historic building mapping and modeling
2.3.1 Data Collection Outdoors
Data collection outdoors mainly includes field investigation, setting of measuring sites, targets and scanning accuracy, and obtaining the point clouds. For most historic buildings, they have larger and more complex angles, so to avoid excluding sections due to an excess of point clouds, it is reasonable setting multiple measuring sites and measurement targets through multi-station, multi-directional scanning.
Figure 2-4 illustrates 16 measuring sites and 8 measuring targets which have been set in the data collection outdoors. In order to have multiple stations scanning different coordinates of points within the cloud together into the same coordinate system, and to obtain the complete surface information of the object shape, a reasonable target arrangement is particularly important. The basic methods or principles are: Firstly, three targets, which are not in the same straight line, should be placed between every two stations. Secondly, the position of the measurement target should follow the principle of "Service for the next station", which means setting the target in a coordinated location where it can be scanned as much as possible by multiple scanners in order to reduce the number of targets and any resulting error of point clouds during multiple site splicing processing. Thirdly, setting up should avoid omitting set targets.
Scanning accuracy settings directly affect the final results of the data collection, thus for group buildings’ positioning measurement, or a single-building’s integral measurement, medium or low-resolution scanning is commonly used. However, for specific detail components of historic buildings, such as specific plaques, fonts or painting patterns, which require high or ultra-high resolution scanning. Adjustments for degrees of exposure must be made according to the environment and weather conditions. The degree of exposure needs to be increased when the point clouds occurs in a dark area, or decreased in a bright area.
Figure 2-4 The measuring sites and measuring targets
2.3.2 Data Processing Indoors
Data processing indoors mainly includes splicing and noise eliminating for the point clouds selection and section, the creation of CAD drawing, 3D modeling, the generation of 3D space image, data storage and extraction for later use. Splicing primarily used the method of “group positioning system”, to position single-buildings and the detail components into the historic building’s settlement group, namely multiple stations’ point clouds, were spliced into the same coordinate system in order to obtain the target entity’s complete spatial data. Noise elimination is conducted to remove the invalid point clouds, reducing the overhead of computer data processing, and to improve the ability of computer data processing. The noises of this project is
relatively obvious, so it is easy to segment the point clouds through naked eye judgment, then delete directly by a human-computer method to eliminate the noises.
Due to the impact of the scanning mode to obtain the point clouds, and the initialization of the instrument, the cloud model that has been acquired has no accurate coordinate axis. Therefore, it is necessary to determine the coordinates using Cyclone software first, to unify the point clouds, and to optimize the cloud model, then to put the cloud model into AutoCAD to slice the plane, vertical face and profile using the Cloudworx plug-in. Finally, the plane drawing, vertical face drawing and profile drawing is described according to the section feature and point clouds in AutoCAD. Figure 2-5, 2-6 and 2-7 illustrate the drawing of the section from the point clouds.
Figure 2-5 The drawing of the entrance plane section from the point clouds
Figure 2-6 The drawing of the entrance vertical face section from the point clouds
Figure 2-7 The drawing of the entrance profile section from the point clouds
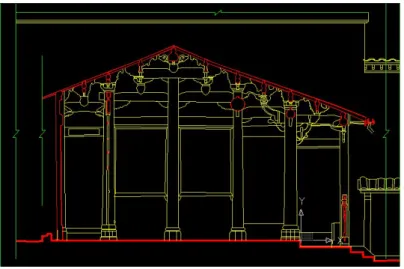
Figure 2-8, 2-9 and 2-10 illustrate the plane drawing, vertical face drawing and profile drawing of the entrance utilizing the hidden point clouds.
Figure 2-8 The plane drawing of the entrance
Figure 2-9 The vertical face drawing of the entrance
Figure 2-10 The profile drawing of the entrance
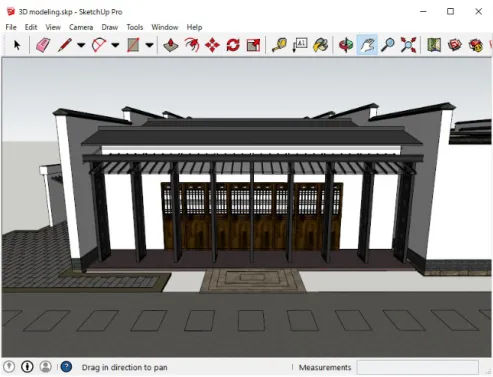
There are two methods for 3D modeling: the first one is to fitting patches on the physical object’s true surface using their point clouds; the second one is to create a 3D replica based on the mapping results (CAD drawings). If the modeling of the big surfaces made from small patches, because of the fitting problems some error can arise. The patches have to be edited by manual to solve this problem, and the 3D editing possibility of software makes that easier (Demir, N., 2004). In addition, many potential users used CAD drawings to realize 3D modeling because it can create an accurate 3D replica (Gaidyte, R. 2010). In order to create accurate and realistic 3D models, we choose the later one for 3D modeling using the mapping results via SketchUp software, and the modeling result can be used as a data source for APS.
Figure 2-11 illustrates the 3D modeling of one historic building in Shang Shu Di project.
Figure 2-11 3D modeling of historic building (one building in Shang Shu Di project)
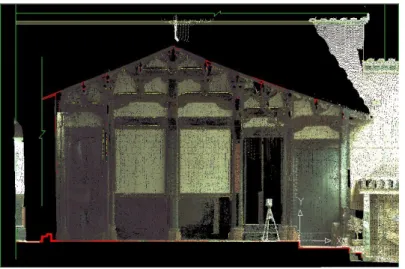
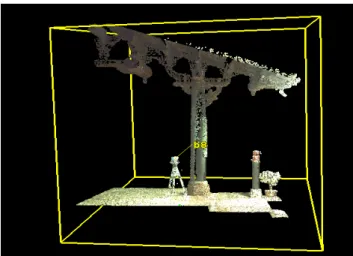
The collected data (point clouds with digital images) can also be used in Virtual Reality (VR) presentation, we constructed a 3D space image to show the mapping results and realistic virtual scenes. This was enabled by fitting the point clouds with the digital images captured from the built-in camera, and setting the navigation path.
Figure 2-12 illustrates the 3D space image of Shang Shu Di.
Figure 2-12 3D space image of Shang Shu Di
2.4 Comparison of 3D Laser Scanning Technology with Traditional Method in Detailed Components Mapping
The detailed components of historic buildings and their decoration are important contents in mapping and modeling. The traditional method is to orthographically shoot the various parts of the components and decorations of historic buildings, and to record their sizes by manually mapping them. Surveyors are required to climb scaffolding, prostrate or squat, and there are measured omissions, mistakes and other issues to be taken into consideration. The application of 3D laser scanning technology can overcome these disadvantages of the traditional method.
To begin with, focus can be placed on the detailed components that need to be mapped, using an appropriate resolution to scan and collect data. In order to decrease the volume of the point clouds, it is necessary to adjust the vision angle according to the physical objects which need mapping, then to use a “partial selection method” to extract the desired point clouds accurately. Figure 2-13 illustrates the extracted point clouds of the Dougong beams above the Gold Pillar.
Figure 2-13 Extracted point clouds of the Dougong beams above Gold Pillar
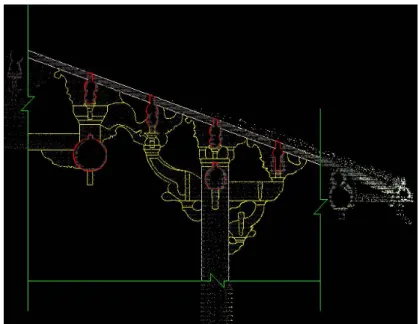
Secondly, the point clouds are unified to reduce their density, then imported into AutoCAD to slice their profile using the Cloudworx plug-in, the profile drawing is then described according to the section feature and point clouds in AutoCAD. Figure 2-14 illustrates the drawing of the Dougong beams above the Gold Pillar using the point clouds.
Figure 2-14 The drawing of the Dougong beams above the Gold Pillar using the point clouds
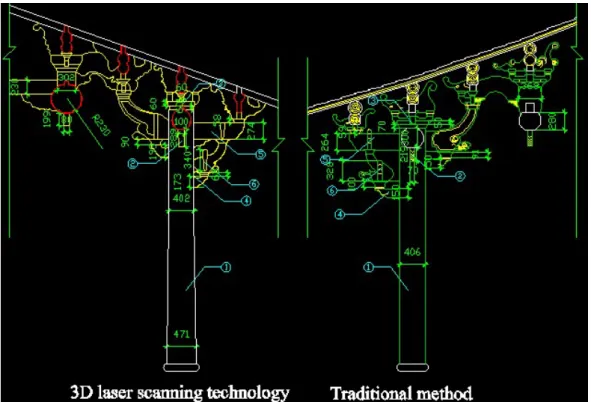
Finally, the hidden point clouds were used to obtain the profile drawing of the Dougong beams above the Gold Pillar, as Figure 2-15 illustrates. The accuracy of the mapping drawing has improved significantly compared with the original manual mapping drawing. Figure 2-16 and Table 2-1 illustrate the mapping results of the 3D laser scanning technology compared with the traditional method.
Figure 2-15 The profile drawing of the Dougong beams above the Gold Pillar
Figure 2-16 Comparison of mapping results of 3D laser scanning technology and traditional method in detailed components
Table 2-17 Comparison results of the two methods corresponding to Figure 2-16 Key points. Traditional
mapping method
3D laser scanning technology
The comparison results (The problems of the traditional method)
①The diameters of the Gold Pillar
The same
diameters from top to bottom, 406mm
Small top and big bottom, the diameter is 471mm at 300mm, and 406mm at 2400mm from the bottom.
The traditional method often misunderstands the diameter of the Gold Pillar. So there are measurement omis- sions.
②The high- aspect ratio of intermediate Dougong.
Width is 70mm and height is 219mm. So the ratio is 3.13.
Width is 100mm and height is 289mm. So the ratio is 2.89.
The ratio of the traditional method is higher than the 3D laser scanning technology, so there is a measurement error.
③Tablet Square Absent Present There are measurement
mistakes or omissions.
④Trunk Gong 150mm 173mm There is a measurement
error.
⑤Er Pi Gong 264 mm 274 mm There is a measurement
error.
⑥Hua Ya Zi 328 mm 340 mm There is a measurement
error.
2.5 Solutions for the Huge Amount of Data
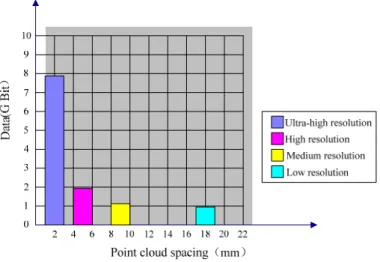
Due to the sizes of historic buildings, the complexity of detailed components, the number of sites and the accuracy of scanning, a huge amount of data will be generated during the process of application of 3D laser scanning technology. Figure 2-17 illustrates the spacing and data of one site’s data volume of point clouds at different scanning resolutions. When the scanning resolution is fine, ultra-high, the amount of data from panorama scanning reaches 7.78Gigabytes. This affects not only the processing speed of the computer, but also the data processing later period, CAD graphics conversion and the efficiency of data extraction. Therefore, reasonable data collection and processing, as well as the construction of a historic building components database are two important solutions for the problem of the huge amount of data.
Figure 2-18 The spacing and data of one site’s data point cloud at different scanning resolutions
2.5.1 Reasonable Data Collection and Processing
Reasonable data collection and processing needs to be done in two stages: First, setting a reasonable scanning accuracy and vision angle when in the data collection stage. Second, noise elimination and saving the data as *.Ptx or *.Pts format files in the data processing stage. The scanning accuracy and vision angle should be set according to different mapping objects, as shown in Table 2-2.
Table 2-19 Scanning accuracy and vision angle in different mapping objects
Mapping
objects Scanning accuracy Scanning vision angle
The distances between two clouds of points within 100 meters.
Data size
Group
buildings Low resolution panoramic
scanning 20mm 0.98GB
Single-
building Medium resolution panoramic
scanning 10mm 1.16GB
Detailed components (such as Dougong, beams, windows, doors.)
High resolution partial scanning 5mm
1.99GB of panoramic scanning.
Graphic
patterns Ultra-high resolution partial scanning 2mm
7.78GB of panoramic scanning.
Noises generally comes from two sources: one is the passing vehicles or pedestrians while the 3D laser scanner is in working. Figure 2-18 illustrates the noises caused by the passing vehicles and pedestrians; another is some invalid point clouds, for example, some modern buildings appear that are adjacent to the historic buildings, or there are some debris of the historic buildings, etc. The invalid data not only affects the accuracy of mapping results, but also takes up storage and system resources, as well as affecting the ability of computer processing. Therefore, for the obvious noises, just using the "Fence Mode" marquee method is sufficient, while for complex noises, it is necessary to separate the noises area from the point clouds, then combine with the
"Fence Mode" marquee method to eliminate the noises. Figure 2-19 illustrates the point clouds after noise elimination.
Figure 2-20 Noise caused by the passing vehicles or pedestrians
Figure 2-21 The point clouds after noise elimination
Beyond that, the data saved for later use is very important since the data can be extracted for later use after finishing the noise elimination, so it is necessary to export the point clouds as *.Ptx or *.Pts format files. In this project, the scanning area of Shang Shu Di was about 900m2, there were 16 measuring sites and 8 measurement targets set, the scanning accuracy was medium resolution, and the actual data volume generated was 18.6GB. After eliminated noises and saved the data as *.Ptx format files, there was only 8.72GB of data volume (*.Pts format files with the same data volume). Therefore, it greatly reduced the size of the point clouds and saved 53.12%
of storage space.