13
International review for spatial planning and sustainable development, Vol.1 No.4 (2013), 13-28 ISSN: 2187-3666 (online)
DOI: http://dx.doi.org/10.14246/irspsd.1.4_13
Copyright@SPSD Press from 2010, SPSD Press, Kanazawa
The Carbon Footprint Calculation of the GFRP Pedestrian Bridge at Tai-Jiang National Park
Yeou-Fong Li1*, Chung-Cheng Yu1, Syun-Yu Chen1, Badjie Sainey1
1 Department of Civil Engineering, National Taipei University of Technology
* Corresponding Author, Email: [email protected] Received 7 Feberuary 2013; Accepted 7 August 2013
Keywords: Glass Fiber Reinforced Plastics, Pedestrian Bridge, Carbon Footprint
Abstract: This paper proposes a study of a high strength, light weight and durable glass fiber reinforced polymer (GFRP) composite material that was used in a pedestrian bridge in Tai-Jiang National Park, Taiwan. In order to better understand the carbon footprint and carbon reduction of GFRP pedestrian bridge, the evaluated carbon footprint of the superstructure of the GFRP pedestrian bridge is compared with those of traditional construction materials, such as reinforced concrete (RC) and steel. The evaluation includes material production stage, transportation stage and construction stage of the carbon emission of GFRP pedestrian bridge. From the calculated carbon emission results, it is found that the GFRP pedestrian bridge reduced total carbon emission about 43% compared to an RC pedestrian bridge and up to 19% compared to a steel pedestrian bridge.
1. INTRODUCTION
FRP composite materials have excellent durability and fatigue resistance properties. When used as a structural material, FRP members exhibit high strength, light weight, great corrosion resistance and other excellent mechanical properties. In this paper, glass fiber reinforced polymer (GFRP) composite material was used to build a pedestrian bridge in Tai-Jiang National Park, Taiwan, located in a high salinity coastal area where the conventional reinforced concrete or steel structures were vulnerable. The reason for using GFRP composite material in Tai-Jiang National Park is due to the high chloride erosion environment resulting in severe corrosion of the reinforced concrete and steel. Therefore, a GFRP pedestrian bridge was proposed, which will reduce the subsequent maintenance cost compared to the reinforced concrete and steel bridges because of the excellent durability performance.
The construction of a pedestrian bridge in the National Park must take into account the impact on the environment and landscape of the park. The rising environmental awareness in recent years calls for energy saving and carbon dioxide emission reduction to complement the national goals.
Environmental consideration in various construction projects has become increasingly important, especially in traditional civil engineering and construction methods with high carbon dioxide emissions, so reducing such emissions are becoming a trend all over the world. Therefore, this paper introduces the GFRP pedestrian bridge’s mechanical experiment, structural design, deflection analysis, strength analysis and mechanical properties to suggest an alternative to traditional structures. The carbon footprint (total
carbon dioxide emission) of the GFRP pedestrian bridge was also calculated for the production stage, the transportation stage. The carbon footprint of the reinforced concrete and steel pedestrian bridges are also investigated and compared with the GFRP pedestrian bridge.
2. LITERATURE REVIEW
The following references were consulted for the analysis of the GFRP components, and some practical application cases in the GFRP pedestrian bridge
2.1 Literature Review of GFRP Components
Davalos et al. (1996) proposed the flexural deformation and strain of different type I and box section GFRP components, by using the three-point and four-point bending tests, a hierarchical system theory, mechanics of laminated beams, and finite element analysis. Qiao et al. (2000) made a single-span GFRP composite bridge. The analysis and design of the GFRP composite bridge, and the experimental and finite-element numerical model were proposed. A series of approximate solutions were used in the analysis and design of GFRP bridge system also. Neto and Rovere (2007) considered the design and analysis of GFRP pultruded wide flanged I-beam under bending by using three-point bending test, numerical analysis, and Timoshenko beam theory. Four GFRP beams of different spans were used to determine the elastic modulus and shear modulus, and the force- displacement diagrams give a similar stiffness value for the numerical, analytical and experimental results.
Li and Kan (2011) present the mechanical behaviors of hybrid fiber reinforced plastic (HFRP) composite beams. Three-point bending test was conducted to obtain the force-displacement relationship, stiffness and failure strength of the GFRP beams. The test results show that the stiffness of GFRP beam filled with epoxy mortar is twice as large as GFRP beam without epoxy mortar. The Timoshenko beam theory and the finite-element analysis were used to calculate the force-displacement relationship of the GFRP beams. After comparison, the experimental results and the numerical and analytical results are quite close to each other. Li et al. (2012) present the use of GFRP composite bridge deck subjected to three-point bending test to determine the mechanical behaviors as well as the failure modes. Test results were compared with the results taken from finite-element method analysis software to verify the accuracy of the finite-element model. The finite element analysis results had a relative error of 12.8 % compared to the experimental result.
2.2 Examples of GFRP Bridges
Some FRP pedestrian bridge will be introduced as follows. Near Kentucky University in the U.S., there is an GFRP pedestrian bridge 18.29 m long and 1.83 m wide. The two girders of the structure are composed of glass fiber, carbon fiber and Vinyl resin. Prestressed cables were fixed into the flanges of the I-beam and the CFRP bridge deck with the purpose of increasing the beam bending stiffness in order to meet the design load requirement of 415 kgf/m2 and allowable deflection of L/180.
Neal Bridge located in Maine, U.S., is an arch bridge with a span of 8.1 m, a length of 10.2 m and a width of 13.5 m. Thin-walled CFRP composite tubes of diameters ranging from 23~30.5 cm were filled with concrete to construct the arch bridge. The concrete took the compression force while the thin-walled CFRP tubes provide confinement to the concrete.
Okinawa Road Park Bridge is an GFRP pedestrian bridge located in Okinawa Prefecture, Japan. The construction of the bridge was completed in 2001 and it is about 38 m in length, and 4.5 m in width. Okinawa Prefecture is surrounded by the sea and harsh corrosion environment; therefore, the area takes much interest in corrosion resistance GFRP composite components for construction. The bridge is made of a two-span continuous girder structure resting on an RC wall pier. The main girders are GFRP panels made by hand lay-up and cross frame, and the GFRP bridge decks are made by pultrusion (Nayomon and Kitayama, 2003).
A two-span GFRP pedestrian bridge was constructed in 2011 in the recreational area of the Yangmingshan National Park, Taipei, Taiwan. The bridge measures a total length of about 8 m and width of 1.2 m. GFRP components were used to build the bridge in the harsh environmental conditions of the National Park because of its lightweight, easy of construction and high corrosion resistance properties. After laboratory experiments confirmed the many advantages of GFRP, the construction and assembly of the bridge with simple hand tools were completed within three days. This dramatically reduced the impact on the environment; moreover, the use of GFRP overcame the corrosion problem of traditional materials, thus reducing post-maintenance costs.
3. STRUCTURAL DESIGN OF GFRP PEDESTRIAN BRIDGE
The design concept of the GFRP pedestrian bridges refers to the codes of some countries, such as Japan (Composite structure of Society of Civil Engineers Committee, 2011), and U.S. (U.S. Department of Agriculture, Forest Service, Technology and Development Program, 2011; American Association of State Highway and Transportation Officials ASSHTO, 2008), and then follows the Design Specifications for Highway Bridge issued by the Ministry of Transportation and Communications, Taiwan. The three-point bending test results of GFRP members were considered in designing the structure of the bridge. Consequently, the physical and chemical properties of GFRP materials were compared with those provided by the manufacturer of the GFRP components to be employed as the basis of the structural design and safety check of the GFRP pedestrian bridge.
3.1 Test Methods
The three-point bending test of the main girder of the GFRP pedestrian bridge is done using a 500-ton universal testing machine, shown in Figure 1.
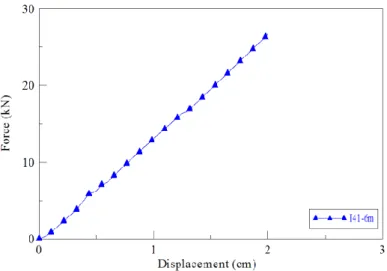
The mechanical testing of the 6 m span specimen labeled H410-L6 is based on displacement control. The component was loaded at midpoint at a downward displacement rate of 1 cm/min. The loading of specimen H410-L6 was stopped when the mid-point displacement reached a value of 2 cm.
Figure 1. A 6 m span length of H410-L6
From the test results obtained from the force-displacement relationship diagram, the midpoint flexural deformation of 2 cm with a corresponding force of 26.7 kN (shown in Figure 2) is used to calculate the stiffness of the specimen, as shown in Table 1.
Figure 2. The force-displacement relationship of specimen H410-L6
Table 1. Three-point bending test result of specimen H410-L6
Specimen Midpoint
deformation (cm)
Corresponding force (kN)
Stiffness (kN/cm)
H410-L6 2 26.7 13.35
Test results are then compared with the analytical value, using Euler beam theory to obtain the force–displacement relationship. In the three-point bending test, a concentrated load was applied at mid-span of the component, and the corresponding Euler beam equation is given for H410-L6 as Eq. (1) below:
3
48 PL
EI (1)
where P is the applied force and I is the section modulus of inertia. From Eq.
(1), the resulting elastic modulus of the specimen H410-L6 can be calculated, E PL 3/ 48I 180,823.5kgf cm/ 2。
The experimental result of the elastic modulus is only 3.3% more than the value of elastic modulus, 175,000 kgf/cm2, provided by the manufacturer.
In general, the three-point bending test result and the theoretical calculations indicate that the material properties provided by the GFRP manufacturer of H410-L6 have a relatively high accuracy.
3.2 Structural Design
The superstructure of the GFRP pedestrian bridge uses Glass Fiber Reinforced Plastic (GFRP) composite material components connected to each other either chemically by adhesive resins, or by a mixture of adhesive resins and GFRP bolts. The following describes the structural design of each item employed in the superstructure:
The main GFRP beam is designed using four single web I-beams, 20 cm wide, 41 cm high, and 800 cm in total length. As shown in Figure 3, GFRP diaphragms are placed in-between the four I-beams at 1/4, 1/2 and 3/4 of the length of the I-beam with the intention of resisting the shear force and transmitting the applied force to the other adjacent I-beams. A total of 16 GFRP composite decks, each 150 cm long, 50 cm wide and 1.2 cm thick, are used. These are connected to the girders of the diaphragm by GFRP bolts and adhesive respectively.
Figure 3. The illustration diagram of I beams and diaphragms of the GFRP pedestrian bridge
3.3 Deflection Check of the GFRP Pedestrian Bridge
This FPR pedestrian bridge deck was designed assuming a pedestrian live load of 400 kgf/m2. In the other calculations, the stress impact from the sidewalk live load was neglected. With regards to the deflection control requirements, reference was made on the GFRP design specifications and recommendations from the United Kingdom, the United States, as well as
Japan and other countries. In this paper, we adopted the United States regulation for the deflection, i.e., the limit deflection value of L/300.
Using the Euler beam formula of Eq. (2) below, we found that the 750 cm span GFRP girder of the pedestrian bridge had a maximum displacement value of 1.65 cm for a live load of 2.12 kgf/cm and the dead load is 0.108 kgf/cm.
5 4
=384 wl
EI (2)
The maximum allowable deflection from the design code, L/400 (1.87 cm), is 14.3 % larger than the design GFRP pedestrian bridge. Nakamura et al. (2012) proposed the maximum allowable deflection (L/500) is found to be approximately 1.5 cm.
3.4 Safety Check of the GFRP Pedestrian Bridge
It is relevant to make sure that the GFRP bridge fulfills the deflection control design standards in order to provide sufficient comfort to users and, more importantly, to ensure that the GFRP pedestrian bridge provides its users with adequate safety. In order to check the strength of the bridge, the ultimate strength of the material provided by the manufacturer, the girder component’s geometry and cross section corresponding to the shear and moment diagrams of the GFRP girder (see Figure 4) due to the load applied were used to check the strength.
Figure 4. The shear and moment diagrams of the GFRP girder
The maximum bending moment required of the GFRP girder under full loading is found from Eq. (3) as 156,656 kgf-cm while the allowable moment value is shown in Eq. (4). Therefore, the safety factor (SF) of the GFRP pedestrian bridge in this study, calculated from Eq. (5), is found to be up to 20.4. This safety factor shows that designing the GFRP pedestrian bridge using the deflection control of L/300 provides users with sufficient safety.
2 MAX 8
M wl (3)
all
M I
y
(4)
max
. . Mall
S F M (5)
4. Carbon footprint Calculation
Based on the “Guidelines for carbon footprint calculation of products and services (2010)” issued by the Environmental Protection, Taiwan. The carbon footprint of the following parts of the GFRP bridge’s superstructure at Tai-Jiang National Park was determined.
4.1 Define the Object Boundary
The evaluation object of this paper is the Tai-Jiang National Park GFRP pedestrian bridge’s superstructure composes of GFRP components, which is 8 m in length and 1.5 m in width, as shown in Figure 5 below.
Figure 5. The illustration diagram of GFRP pedestrian bridge at Tia-Jiang National Park
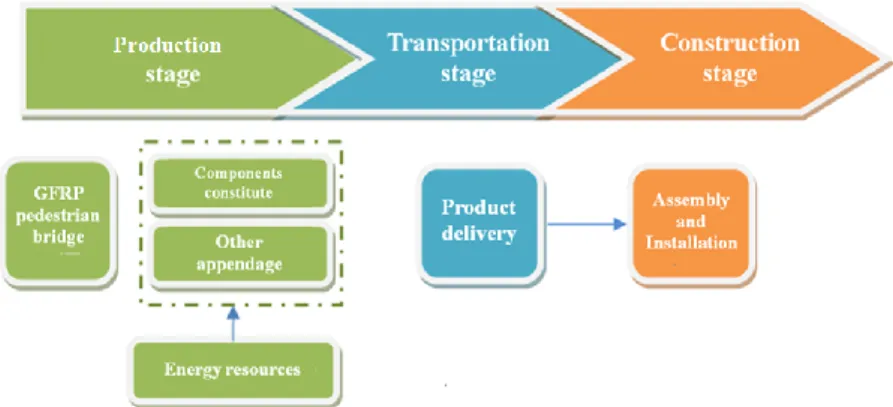
4.2 Evaluation Flowchart
In this study, the production stage, transportation stage and construction stage of the superstructure of the GFRP pedestrian bridge were considered.
The evaluation flowchart is shown in Figure 6.
Figure 6. The evaluation flowchart of Tia-Jiang Park GFRP pedestrian bridge
4.3 Inventory Data and Calculation
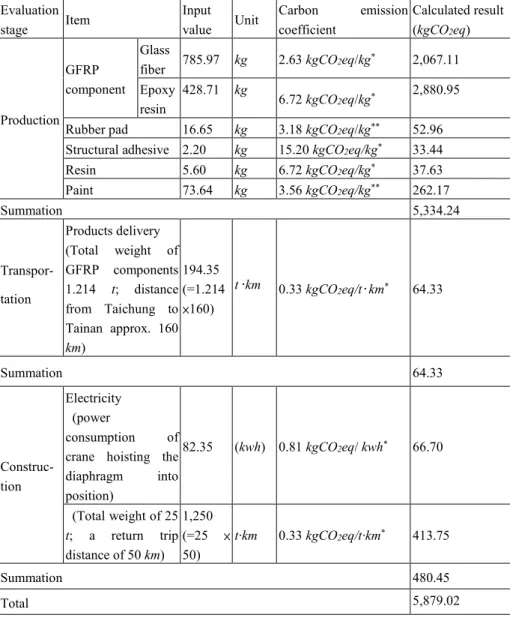
In this paper, the carbon footprint inventory items of the GFRP pedestrian bridge includes the production stage, delivery of the materials to
the site, assembly stage of the components as well as the energy consumed in the whole process, as shown in Table 2. The carbon footprint inventory data of GFRP pedestrian bridge of carbon dioxide emissions was taken from the SimaPro database, complemented by carbon emission coefficient obtained from domestic and foreign databases (Hsu et al., 2011; Hu et al., 2011).
Table 2. The calculation of the carbon dioxide emission of the GFRP pedestrian bridge Evaluation
stage Item Input
value Unit Carbon emission coefficient
Calculated result (kgCO2eq)
Production GFRP component
Glass
fiber 785.97 kg 2.63 kgCO2eq/kg* 2,067.11 Epoxy
resin
428.71 kg
6.72 kgCO2eq/kg* 2,880.95 Rubber pad 16.65 kg 3.18 kgCO2eq/kg** 52.96 Structural adhesive 2.20 kg 15.20 kgCO2eq/kg* 33.44
Resin 5.60 kg 6.72 kgCO2eq/kg* 37.63
Paint 73.64 kg 3.56 kgCO2eq/kg** 262.17
Summation 5,334.24
Transpor- tation
Products delivery (Total weight of GFRP components 1.214 t; distance from Taichung to Tainan approx. 160 km)
194.35 (=1.214
×160)
t·km 0.33 kgCO2eq/t·km* 64.33
Summation 64.33
Construc- tion
Electricity (power
consumption of crane hoisting the diaphragm into position)
82.35 (kwh) 0.81 kgCO2eq/ kwh* 66.70
(Total weight of 25 t; a return trip distance of 50 km)
1,250 (=25 × 50)
t·km 0.33 kgCO2eq/t·km* 413.75
Summation 480.45
Total 5,879.02
* Unit amount of CO2 emissions data taken from SimaPro software
** Unit amount of CO2 emissions data taken from INVENTORY OF CARBON & ENERGY (ICE), Version 1.6a(Hammond and Jones, 2008).
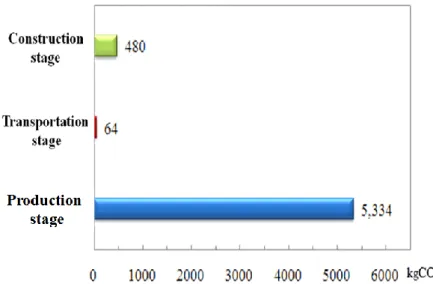
The three different stages of the superstructure of the GFRP pedestrian bridge produced a total of 5,879 kgCO2eq. The production stage accounted for 91% carbon dioxide emission, making it the largest in the assessment, while the transportation stage and construction stage accounted for only 1%
and 8% respectively. The carbon emission of the GFRP pedestrian bridge for the different stages is shown in Figure 7.
Figure 7. The carbon dioxide emission of the GFRP bridge for different stages
5. Benefit analysis
In order to explore the carbon footprint and carbon dioxide reduction benefits of the GFRP pedestrian bridge; the reinforced concrete and steel bridges were adopted and compared. The structural design of the two types of bridge structures were taken into account to meet the design code and providing the same service performance of the GFRP pedestrian bridge.
5.1 Reinforced Concrete Pedestrian Bridge
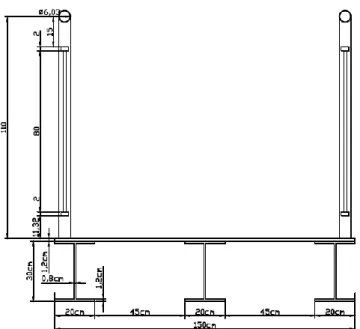
For the RC pedestrian bridge, the actual existing conditions of a high salinity in the Tai-Jiang Park environment is considered for the design and according to design specifications, a concrete cover of at least 6.5 cm in thickness is required to protect the reinforcement inside the concrete.
Minimum concrete compressive strength of 350 kgf/cm2 and minimum steel yield strength of 4,200 kgf/cm2 were used. Figure 8 is a sectional diagram of the RC pedestrian bridge.
Figure 8. The cross section of the RC pedestrian bridge
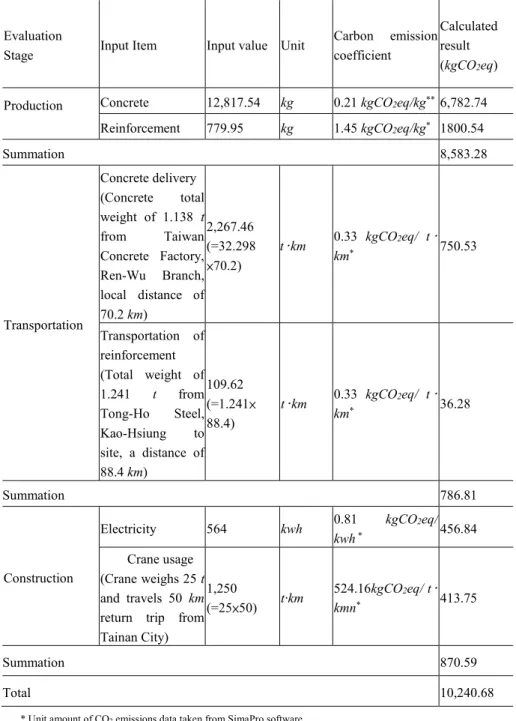
Similar to that of the GFRP pedestrian bridge, the production, transportation and construction stages are calculated. The carbon dioxide emission of the RC pedestrian bridge for different stages is shown in Table 3 as follow.
Table 3. The calculation of the carbon dioxide emission of the RC pedestrian bridge
Evaluation
Stage Input Item Input value Unit Carbon emission coefficient
Calculated result (kgCO2eq)
Production Concrete 12,817.54 kg 0.21 kgCO2eq/kg** 6,782.74 Reinforcement 779.95 kg 1.45 kgCO2eq/kg* 1800.54
Summation 8,583.28
Transportation
Concrete delivery (Concrete total weight of 1.138 t from Taiwan Concrete Factory, Ren-Wu Branch, local distance of 70.2 km)
2,267.46 (=32.298
×70.2)
t·km 0.33 kgCO2eq/ t·
km* 750.53
Transportation of reinforcement (Total weight of 1.241 t from Tong-Ho Steel, Kao-Hsiung to site, a distance of 88.4 km)
109.62 (=1.241×
88.4)
t·km 0.33 kgCO2eq/ t·
km* 36.28
Summation 786.81
Construction
Electricity 564 kwh 0.81 kgCO2eq/
kwh * 456.84
Crane usage (Crane weighs 25 t and travels 50 km return trip from Tainan City)
1,250
(=25×50) t·km 524.16kgCO2eq/ t·
kmn* 413.75
Summation 870.59
Total 10,240.68
* Unit amount of CO2 emissions data taken from SimaPro software
** Unit amount of CO2 emissions data taken from INVENTORY OF CARBON & ENERGY (ICE), Version 1.6a(Hammond and Jones, 2008).
The evaluation of the RC pedestrian bridge includes the production, transportation and construction stages. And the amount of carbon dioxide emissions of the three stages is 10,240.68 kgCO2eq. The highest proportion of the carbon dioxide emissions is at the production stage, accounting for 84%, the transport stage accounted for 8%, while the construction stage accounted for 9%. The carbon emission of the steel pedestrian bridge for different stages is shown in Figure 9.
Figure 9. The carbon dioxide emission of the RC bridge for different stages
5.2 Steel Pedestrian Bridge
The designing of the handrail and deck of the steel pedestrian bridge deck handrail design is taken to be of the same or approximate cross-section as that of the GFRP pedestrian bridge. On the other hand, the main girders of the steel bridge use three single web I-beams that are 20 cm wide, 30 cm high and 800 cm in total length. A sectional view of the steel bridge is shown in Figure 10.
Also, in evaluating the carbon dioxide emission of the steel bridge, the production, transportation and construction stages are assessed in a similar way as the GFRP pedestrian bridge. The carbon dioxide emission of the RC pedestrian bridge for different stages is shown in Table 4.
The steel pedestrian bridge produced a total of 7,265 kgCO2eq for the three stages. The production stage accounted for 83% carbon dioxide emission making it the largest, while the transportation stage and construction stage accounted for only 1% and 16% respectively. The carbon dioxide emission of the steel pedestrian bridge for different stages is shown in Figure 11.
Figure 10. The cross section view of the steel pedestrian bridge
Table 4. The calculation of the carbon dioxide emission of the GFRP pedestrian bridge Evaluation
stage Input items Input value Unit Carbon emission coefficient
Calculated result (kgCO2eq)
Production
Steel section 3,074.88 kg 1.77 kgCO2eq/kg** 5,442.54 Paint 73.64 kg 3.56 kgCO2eq/kg** 262.16 Bolts 200.00 kg 1.56 kgCO2eq/k* 312.00 Welding
electrodes 264 kg 0.12 kgCO2eq/kg* 31.68
Summation 6,048.38
Transportation
Steel beam
transportation (Total weight of 3.074 t to be transported for 88.4 km, from Tung-Ho Steel, Kao-Hsiung to Tainan)
271.39 (=3.074×
88.4)
t·km 0.33 kgCO2eq/t·km * 89.93
Summation 89.93
Construction
Electricity 880 kwh 0.81 kgCO2eq/ kwh 712.80
Crane usage (Crane weight is 25 t, return trip from Tainan City is 50 km)
1,250
(=25×50) t·km 0.33 kgCO2eq/ t·km* 413.75
Summation 1,126.55
Total 7,264.76
* Unit amount of CO2 emissions data taken from SimaPro software
** Unit amount of CO2 emissions data taken from INVENTORY OF CARBON & ENERGY (ICE), Version 1.6a(Hammond and Jones, 2008).
Figure 11. The carbon dioxide emission of the steel bridge for different stages
5.3 Benefit Analysis
The carbon reduction benefits of the superstructure of the GFRP pedestrian bridge and that of the traditional construction materials is calculated as follows.
Carbon dioxide equivalence reduction benefits=
[(construction material-GFRP) / construction material] (6)
The carbon emission in the production stage between the GFRP and the other two traditional construction materials had the largest difference. The reason is clearly because GFRP has the advantages of high strength and light weight. Thus, for the same design conditions, GFRP will use a smaller amount of material to provide the same service performance of a pedestrian bridge compared to the traditional construction materials. Comparatively, the RC pedestrian bridge will have carbon dioxide emissions of 3,249 kgCO2eq more than the GFRP pedestrian bridge, accounting for 38% carbon reduction for the GFRP. The steel pedestrian bridge, in a similar way, will produce carbon dioxide emissions of 714 kgCO2eq more than the GFRP pedestrian bridge and accounting for 12% carbon reduction.
In the transportation stage, although the finished GFRP components took a longer distance to be delivered, the GFRP pedestrian bridge is of lower density and thus weighs lighter when compared to a steel pedestrian bridge of the same handrail design cross section. Therefore in this stage, the RC bridge will produce 722 kgCO2eq more than a GFRP pedestrian bridge, accounting for 92% carbon reduction, while the steel bridge produces 26 kgCO2eq more carbon dioxide emission than the GFRP one accounting for 28% carbon reduction in the transportation stage.
When it comes to the construction stage, not much energy was needed or heavy machinery was required because the GFRP members were adhesively bonded to one another so a crane only can hoisting the GFRP pedestrian bridge into position. The other two traditional construction materials require a lot of heavy machinery and equipment for their construction. Steel needs electric welding to join its members, which makes its carbon dioxide emissions higher than that of the GFRP pedestrian bridge. The construction stage of RC pedestrian bridge produces 390 kgCO2eq more than the GFRP one, accounting for carbon reduction of 45%. Similarly, a steel pedestrian bridge in the construction stage produces up to 646 kgCO2eq more than the GFRP pedestrian bridge yielding to 57% carbon reduction.
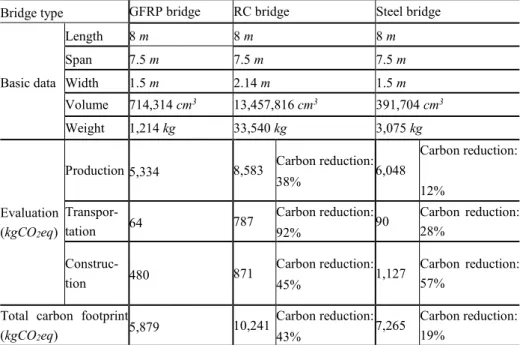
The largest carbon reduction benefit of the GFRP pedestrian bridge compared with an RC pedestrian bridge occurs at the transportation stage, then the construction stage, and lastly the production stage. The largest carbon reduction benefit of the GFRP pedestrian deck compared to a steel one occurs at the construction stage, then the transportation stage, and lastly the production stage. The carbon reduction of the GFRP pedestrian bridge compared with that of RC and steel pedestrian bridges are shown in Table 5.
Figure 12 is the comparison chart of the three different bridge types of carbon dioxide emissions.
Table 5. Comparison of carbon reduction benefits for the different materials and stages
Bridge type GFRP bridge RC bridge Steel bridge
Basic data
Length 8 m 8 m 8 m
Span 7.5 m 7.5 m 7.5 m
Width 1.5 m 2.14 m 1.5 m
Volume 714,314 cm3 13,457,816 cm3 391,704 cm3
Weight 1,214 kg 33,540 kg 3,075 kg
Evaluation (kgCO2eq)
Production 5,334 8,583 Carbon reduction:
38% 6,048
Carbon reduction:
12%
Transpor-
tation 64 787 Carbon reduction:
92% 90 Carbon reduction:
28%
Construc-
tion 480 871 Carbon reduction:
45% 1,127 Carbon reduction:
57%
Total carbon footprint
(kgCO2eq) 5,879 10,241 Carbon reduction:
43% 7,265 Carbon reduction:
19%
Figure 12. Comparison of the three different bridge types of carbon dioxide emissions
From Table 5, the carbon dioxide emissions for each stage shows that the GFRP pedestrian bridge has 43% reduction in carbon emissions over the RC pedestrian bridge, and 19% reduction in carbon emissions over a steel pedestrian bridge. Therefore, using GFRP material as an alternative material in constructing the pedestrian bridge has more carbon reduction benefits than traditional construction materials.
According to the document from the website of the Forestry Bureau (http://www.forest.gov.tw/ct.asp?xItem=59104 &ctNode=2577&mp=41), a tree will reduce carbon emission about 12 kgCO2eq per year. Comparing the GFRP pedestrian bridge with RC and steel pedestrian bridges, the reduced carbon emission of GFRP pedestrian bridge is equal to 363 trees for the RC bridge; and 115 trees for the steel bridge, respectively.
6. Conclusions
1. The safety factor of the GFRP pedestrian bridge is 20.4. The maximum allowable deflection from the design code, L/400 (1.87 cm), is 14.3%
larger than the GFRP pedestrian bridge in Tai-Jing National Park.
Therefore, the GFRP pedestrian bridge can provide sufficient service performance and safety.
2. The weight of the superstructure of the GFRP pedestrian bridge is significantly less than the RC and steel pedestrian bridges. The lightweight nature of the bridge structural does not cause too much damage to the fragile ecosystems of the National Park.
3. Because of the GFRP material’s lightweight, high-strength, and easy-to-assemble properties, the total carbon dioxide emission of the GFRP in various stages is significantly lower than traditional RC and steel pedestrian bridges, which makes GFRP material environmentally friendly.
4. A comparative analysis of the GFRP, RC and steel pedestrian bridges indicate that with the high-strength characteristics of GFRP composite material, under the same structural design conditions, a smaller cross section of the GFRP material can be used to achieve the same service performance. This also shows that the GFRP material has less carbon dioxide emissions in the production stage compared with the other two traditional construction materials.
5. In the transportation stage, although the transportation distance of the GFRP components was farther than that of the other two traditional construction materials, the lightweight property of GFRP components lowers their carbon emission and makes them easier to handle for assembly and installation.
6. There is no need for heavy construction machinery for GFRP pedestrian bridge, which in turn significantly reduces the carbon dioxide emission in the construction stage also.
7. Comparing the GFRP pedestrian bridge with RC and steel pedestrian bridges, the reduced carbon emission of GFRP pedestrian bridge is equal to 363 trees for RC bridge; and 115 trees for steel bridge, respectively.
REFERENCES
American Association of State Highway and Transportation Officials. (2008). Guide specifications for design of FRP pedestrian bridges, 1st Edition.
Composite Structure of Society of Civil Engineers Committee. (2011). Guideline for design and construction of FRP pedestrian bridge. (in Japanese)
Davalos, J.F., Salimet, H.A., et al. (1996). “Analysis and design of pultruded FRP shapes under bending”, Composites Part B: 27B, 295-305.
Environmental Protection Administration of Taiwan. (2010). Guidelines for carbon footprint calculation of products and services.
Hammond, G., Jones, C. (2008). “Inventory of carbon and energy (ICE)”, Version 1.6a, Sustainable Energy Research Team (SERT), Department of Mechanical Engineering, University of Bath, UK.
Hsu, C.W., Chen, A.H., et al. (2011). “Site selection for carbon dioxide geological storage using analytic network process”, Separation & Purification Technology.
Hu, A.H., Lin, R.W., et al. (2011). “Carbon reduction assessment of a product service system-A case study of washing machines, eco-design”, The 7th Symposium on Environmentally Conscious Design and Inverse Manufacturing, Kyoto, Japan.
Li, Y.F., Kan, S.T. (2011). “A study on the three-point bending test and mechanical behavior of the hybrid FRP beam”, 2011 ICFMEIA, Bali Island, Indonesia.
Li, Y.F., Hsu, T.H., et al. (2012). “Three-point bending test and finite-element analysis on FRP bridge deck”, The 9th International Conference on Urban Earthquake Engineering and 4ACEE, paper ID 07- 091, p. 189, Japan, Tokyo.
Nakamura, S. et al. (2012). “Guidelines for Design and Construction of Fibre- Reinforced Polymer Footbridges in Japan”, Structural Engineering International, 22(2), 250-253.
Nayomon, U., Kitayama, N. (2003). “Design, fabrication and erection of the pedestrian bridge in the road-park of Ikei-Tairagawa in Okinawa”, Engineering Review, 36(2), 35-39.
Neto, A., Rovere, H. (2007). “Flexural stiffness characterization of fiber reinforced plastic (FRP) pultruded beams”, Composite Structures, 81, 274-282.
Qiao, P., Davalos, J.F., et al. (2000). “A systematic analysis and design approach for single-span FRP deck/stringer bridges”, Composites Part B 31, 593-609.
U.S. Department of Agriculture, Forest Service, Technology and Development Program.
(2011). A Guide to Fiber-Reinforced Polymer Trail Bridges.