for Evaluation and Optimizing of Spatial Planning:The Example of Xiamen City, China
著者 Longzhu Xiao, Wangtu(Ato) Xu, Jixiang Liu journal or
publication title
International Review for Spatial Planning and Sustainable Development
volume 4
number 3
page range 14‑26
year 2016‑07‑15
URL http://hdl.handle.net/2297/45836
doi: 10.14246/irspsd.4.3_14
14
DOI: http://dx.doi.org/10.14246/irspsd.4.3_14
Copyright@ by authors, SPSD Press from 2010, Kanazawa
Detecting Urban Dynamics with Taxi Trip Data for Evaluation and Optimizing of Spatial Planning:
The Example of Xiamen City, China
Longzhu Xiao
1Wangtu (Ato) Xu
1*and Jixiang Liu
21 School of Architecture and Civil Engineering, Xiamen University 2 School of Urban Planning and Design, Peking University
* Corresponding Author, Email: [email protected] Received: 31 August, 2015; Accepted: 15 January, 2016
Key words: Taxi trip data, Urban dynamics, Spatial planning, Xiamen
Abstract: Commonly, it is very hard to examine underlying urban dynamics due to rapid spatial expansion and land use variations. In this paper, the origin-destination (OD) data extracted from taxi trip data collected in Xiamen, China, covering 30 days was utilized to detect the underlying dynamics of Xiamen City.
Specifically, we discretized the study area into 400m*400m grids so that the number of originating points and destination points of the taxi trips could be counted separately within each single grid. Then, heat maps of the taxi mobility were made to achieve a general understanding of urban dynamics. Secondly, we took advantage of the concept of complex networks to analyze the daily taxi trip data. Using a method of community detection, we divided the study area into six main sub-regions called functional self-sufficient zones (FSZs) in which spatial associations are tight and dense. The features of these FSZs helped us to gain a deeper understanding of urban dynamics. Finally, based on this understanding, we further evaluated and optimized the urban spatial planning of Xiamen. Balancing land use allocation was suggested to enhance the multi- centric structure and reduce congestion. This study provides a relevant contribution by exploring the potential of applying taxi trip data to identify urban dynamics revelations and urban planning optimization solutions.
1. INTRODUCTION
Spatial planning is the most traditional and widely used planning paradigm used in urban planning processes, especially in Asian countries. Compared with modern western urban planning, which quantitatively analyzes and solves urban problems through building a vigorous index system (Alexander, 2000; Benevolo & Landry, 1967), spatial planning in China has been relatively more subjective and drawn from much attention to aesthetics.
Traditional spatial planning has been trying to manage individual travel behavior by means of mere construction of physical environment. However, such arrangements on future city life seem to fail in achieving the goal of
“better cities” that the political and professional elites have expected. This
kind of failure has aroused wide discussions in academia. On the other hand,
there is still little empirical research evaluating and examining the rationality
and effectiveness of proposed urban planning objectives and quantifications
in China. T he sharply expanding urban scale, increasing unpredictability and complexity, have made understanding urban dynamics more difficult.
Fortunately, in recent years, the availability of big geospatial data, such as cell phone data, public transportation card records and taxi trajectories, has boosted research on the detection of urban dynamics (Lu & Liu, 2012).
Compared with other public transportation, such as bus and metro, which are constrained to prescribed routes, taxis can travel freely to reach different places where other public vehicles cannot get. Moreover, taxi trip data can reflect people’s activities through information related to the spatio-temporal connections of origin and destination. Taking advantage of the diversity of routes as well as accurate spatio-temporal information, taxi trip data offers a richer and more detailed glimpse into human mobility patterns (Liang et al., 2012; Wang et al., 2015). Moreover, human mobility studies based on taxi trip data have been applied in many fields, such as traffic management (Yuan, N.
J. et al., 2013), urban structure detection (Liu, X. et al., 2015), and land use analysis (Pan et al., 2013; Peng et al., 2012; Yuan, J., Zheng, & Xie, 2012).
But a lot of relevant research tends to analyze taxi trip data from the pick-up points and drop-off points in separation. Thus, the spatial interaction of the mobility is omitted. Furthermore, there has been little research applying taxi trip data to evaluate and optimize the urban spatial planning scheme. Most of the existing studies focus on exploring the human behavior and mobility information from taxi trip data.
Among research of individual travel behavior and urban dynamics, the complex network concept has been widely used to detect spatio-temporal connectivity relationships. Due to that, “community” is the most important concept, or structure, in both the individual network and overall urban plan, as it has been evaluated intensively in complex network studies. Newman and Girvan (2004) defined the community as “a sub graph containing nodes which are more densely linked to each other than to the rest of the graph”. In the context of urban planning, community is able to demonstrate the underlying dynamics of cities, which are often omitted or surmised subjectively by traditional planning. As community detection can be considered a process for dividing complex networks into several sub networks, among which the internal connections are extraordinarily closed, many researchers have emphatically studied the formation process of communities. Gao et al. (2013), Roth et al. (2011), Liu, Y. et al. (2014), Austwick et al. (2013) and Liu, X. et al. (2015) all focused on this topic, however, all of these researchers failed in evaluating the urban practices with revealed urban dynamics phenomena.
In this paper, the origin-destination (OD) data extracted from the taxi trip data collected in Xiamen, China, covering 30 days was utilized to detect the underlying dynamics of Xiamen City. Specifically, we divide the study area into 400m*400m grids so that the number of originating points and destined points of the taxi trips could be counted separately within every single grid.
Then, heat maps of taxi mobility were made to achieve a general understanding of urban dynamics. Secondly, we took advantage of the concept of complex networks to analyze the daily taxi trip data. With the method of community detection from complex network theory, we detect six communities, which are named functional self-sufficient zones (FSZs) in the study area. The features of these FSZs helped us to gain a deeper understanding of urban dynamics. Finally, based on this understanding, we further evaluated and optimized the urban spatial planning of Xiamen.
This paper has been organized as follows, in the following section the
methodology for community detection is presented, then, following is the case
study section in which the proposed methodology is applied to detect the
community of Xiamen City based on its taxi trip data. Following this, the discussion and conclusion are provided.
2. METHODOLOGY 2.1 Study area
Xiamen City is a coastal city of Fujian province, China, and one of the special economic zones opened to international investment when China started its economic reform in the 1980s. Since the 2000s, Xiamen has developed from an island city to a coastal bay city. Two out of six administrative districts lie on Xiamen Island, which is the central business district (CBD) of Xiamen City. The other four administrative districts are located on mainland areas. The urban configuration of Xiamen City is shown in Figure 1. According to the Master Plan of Xiamen City (2010-2020), there will be two CBDs by 2020.
Regarding the transportation system of Xiamen, currently, there are two railway stations and an airport in Xiamen. In addition, an airport is under construction and will be in operation by 2020 in Xiang’an district. There are also the metro system, which is currently under construction, and three lines which will be put in operation by 2020. Regarding the taxi system, the total number of taxi cars is about 7,500. They account for a large proportion of the travels inside the city.
Figure 1. Study area of Xiamen
2.2 Study framework
With the help of analysis methods based on community detection and
complex network theory, this research expects to solve the following three
problems:
1). How will taxi trip data help us to achieve a general understanding of urban dynamics?
2). How can we take advantage of the complex network built based on the origin-destination (OD) data which were extracted from the taxi trip data to better understand urban dynamics?
3). How can proposed urban land use planning be guided and enhanced based on the underlying urban dynamics revealed by taxi trip data?
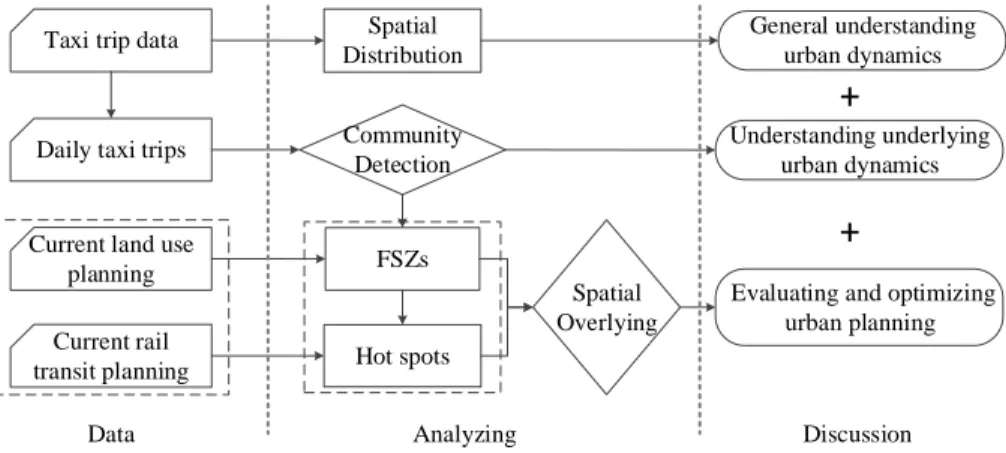
It has been shown that taxi trip data could not only reflect a large proportion of individual travel habits, but also, it is used as a data source for research on urban dynamics. Accordingly, the following analytical framework is designed to solve the problems above. As shown in Figure 2, we firstly obtain a general understanding of urban dynamics according to the spatial distribution of taxi trips data. Then we extracted daily taxi trips from taxi trip data. Secondly, we built a network using the daily taxi trips and analyzed this network using a method of community detection to display the underlying principle of the urban dynamic. Furthermore, the evaluation and suggestion for current urban planning schemes were carried out based on the preceding operations.
Spatial Distribution
Hot spots FSZs Community
Detection Current land use
planning Current rail transit planning
General understanding urban dynamics Understanding underlying
urban dynamics
Evaluating and optimizing urban planning Daily taxi trips
Taxi trip data
Spatial Overlying
+ +
Data Analyzing Discussion
Figure 2. Analytical framework
In Figure 2, the functional self-sufficient zones (FSZs) are detected by the complex network theory; we analyzed the distribution of taxi trips on weekdays and weekends separately, which enabled us to achieve a general understanding of the travel rules. It can be inferred that on weekdays people mostly commute, which means trips are more regular on weekdays and more random on weekends. Trips occurred periodically. In order to eliminate irregular trips, we firstly remove the trips on weekends as well as Fridays when the trips are more or less influenced by the following weekends. Then we remove the haphazard trips occurring from 0:00 to 18:00.
3. ANALYSIS
3.1 Data source and data structure
We use 30 days of taxi trips from March 01 to March 30, 2015. There were
nearly three hundred thousand taxi trip records every day, and each taxi trip
recorded in the data set was composed of key information such as taxi ID,
original point coordinates, destination point coordinates, time interval and trip
length. For pre-processing the data set we removed the invalid records such as
those with a trip length less than 500 meters, or those beyond the administrative boundary of Xiamen.
3.2 General understanding of urban dynamics
3.2.1 Data pre-processing and hot spot analysis
The taxi trip data (over 30 days) was used to examine urban dynamics. In order to ensure the accuracy of taxi car movement, we removed records which were deemed invalid. For example, those with a trip length less than 500 meters or beyond the administrative boundary of Xiamen.
The urban dynamics are closely related to daily travel behavior, therefore it is necessary to extract daily trips data from the whole database. Firstly, we extract the daily trips from the whole database using the judgements of a Structure Query Language (SQL) to remove the night trips which occurred between 0:00 to 18:00.
For two types of taxi trip data, the working day data and weekend day data, we divide the study area into 400m*400m grids so that the number of originating points and destination points could be counted respectively within every single grid. Then, we count the amount of ends (including the origin and destination ends) of taxi trips in each grid. Accordingly, we plot the Probability Distribution Function (PDF) of the taxi trip end-points among the total grids in the Log-log scale. The resultant curves have been shown in Figure 3, below. Moreover, we obtain a heat map based on taxi trip end-points for the total grid. As shown in Figure 4, the two heat maps of the taxi trip end- points, in both the weekday and weekend, clearly display the busy degree of overall individuals’ mobility in the city. According to Figure 3, it can be see that individual travel behavior is more random on weekends, while it is with more regularity on weekdays; the PDF of the number of taxi trip ends in the weekday has a longer tail than that in the weekend. This situation implies that taxi trip frequency is almost the same for each weekday. On weekdays, taxi trip frequency differs and the amount of taxi trips is relatively more random, which results into a shorter tail, as shown in Figure 3.
Furthermore, we detected the “real” CBD of Xiamen City based on heat
map scenes displayed in Figure 4. As shown, we found that the two heat maps
are similar; it could be determined that those places with the deepest color
would account for the largest proportion of trips on both weekdays and
weekends. In other words, these places are the real CBD of this city.
Figure 3. Log-log plot of the taxi trip frequency distribution of different grids on weekdays and weekends
Figure 4. Heat maps of taxi trip dynamics on weekdays and weekends
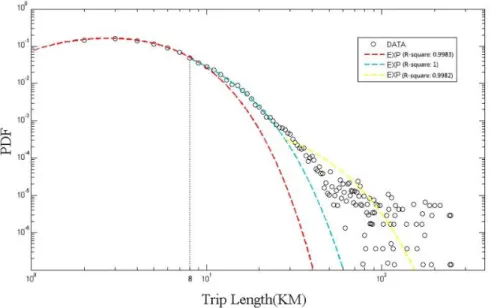
3.2.2 Trip length distributions
We also study the length of taxi trips for both weekdays and weekends. As shown in Figure 5, trip length distribution (TLD) of taxis follows an exponential distribution. As shown in Figure 5, the TLD consists of two distance ranges: the long length trips, of which the TLD is longer than 8km, and the short length trips, with a TLD smaller than 8km. Among them, the short length trips accounted for 81.1% of all trips, while the total length of the short length trips accounted for 57.6% of the length of all the trips. As we know, the trip purposes have a great influence on the TLD. As illustrated in Figure 6-a, the short distance trips are distributed densely in the CBD area;
daily travel by taxi, such as for commuting, shopping and entertainment, tends
to head to the bustling regions. Meanwhile, other forms of travel include
catching the train or tourism to the outside of Xiamen Island, necessitating
long distance travel. It is clear that short length trips on weekdays were able
to represent residents’ daily travel behavior better than long length trips. The
short length trips enabled us to observe the urban dynamics more deeply.
Consequently, we would best detect the urban dynamics using the short length trip data.
Figure 5. Log-log plot of the distribution of taxi trip length
Figure 6. Heat maps of taxi trip dynamics of different length
3.3 Community detection
3.3.1 Network construction and community detection
Complex network theory is traditionally used to analyze the evolution process of a natural phenomenon. In order to identify the urban dynamics process of Xiamen City, we built a directed graph, with which the dynamic nature of mobility in the whole citywide area is examined. Firstly, we divided the study area into different grids. Each grid is 400m*400m and its center is deemed a node of its respective graph. Secondly, we compute the origin- destination (OD) ends of daily taxi trips between any two grids. The OD connections between grids are the links of the graph.
For the community to be identified on a graph, many algorithms have been
used in previous works (Malliaros & Vazirgiannis, 2013; Newman, 2013).
Among these algorithms, the Fast Unfolding Algorithm (FUA) is a graph partition method based on the modularity optimization technique, which specifies the community using the direction and weight of the links (Malliaros
& Vazirgiannis, 2013). Simultaneously, it divides the detecting of commuting into various hierarchy structures, or intrinsic multi-level characteristic groups.
Thus, it can define an appropriate resolution value according to the hierarchy and degree of clustering as needed (Blondel et al., 2008). On the other hand, as most urban scholars pointed out, interaction among the spaces was influenced by land use types, demographic and other geographic factors (McLaughlin, 2012). Moreover, urban scholars are traditionally interested in detecting the regions in which most residents’ daily moves were completed t.
It implies that the infrastructure and social services within this type of region can meet resident’s basic living demands. Therefore, these regions are named functional self-sufficient zones (FSZ) in previous studies. In this paper, our work mainly lies in the detection of FSZs within Xiamen City by using the grid graph weighting of taxi trips.
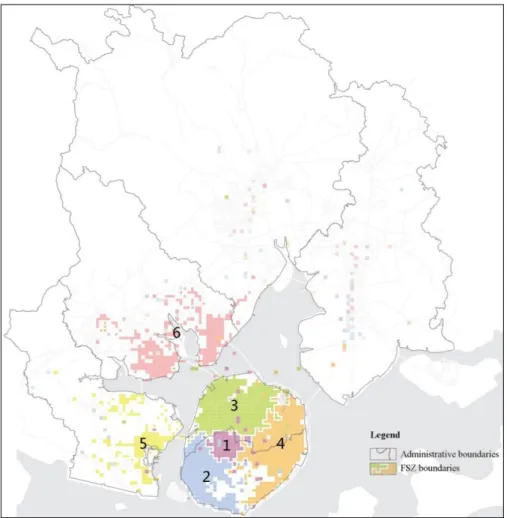
Figure 7. Functional self-sufficient zones (FSZs) detection result based on daily taxi trips
After setting the resolution parameter in the FUA as 0.5, we find that there are six main FSZs citywide, after carrying out the community detection algorithm as Blondel et al. (2008) did. The community detection result is shown in Figure 7, illustrating the number of nodes (a node represents the center of a 400*400m grid) located within the six FSZs, which take up 91.93%
of the total area. Four of the six FSZs lie on Xiamen Island, while the other
two are on the mainland areas. Compared to the administrative districts of
Xiamen city presented in Figure 1, most of the FSZ boundaries differed from the administrative boundaries; the resulting division presents a polycentric structure in Xiamen City.
3.3.2 Properties of the six FSZs and the hot spots
In order to study the properties of the six FSZs, we propose the corresponding indicators, including the degree, the average degree, the weighted degree, the average weighted degree and the graph density, where, the degree of a node refers to the number of nodes connecting it. Accordingly, the average degree indicates the average number of connections a node is linked to and the weighted degree denotes the amount of taxi trips between one node and another. Similarly, average weighted degree is the mean of weighted degrees of all the nodes. And, the graph density represents the degree of saturation or integration of the network.
According to Table 1, the six FSZs can be divided into three groups.
Specifically, the first group is FSZ 1, which covers the least nodes, yet, it owns the highest value of trips, average degree and average weighted degree. On the other hand, group 2 consists of FSZ 2, 3 and 4, whose properties are relatively closed. Finally, FSZ 5 and FSZ 6 belong to group 3, and their attributes are obviously smaller than those of the former two groups. We can conclude that FSZ 1 is the exact core of Xiamen City. Moreover, human travel mobility is mainly concentrated on Xiamen Island, while the mainland areas of Xiamen City are far inferior to Xiamen Island in terms of taxi trip frequency during weekdays.
Table 1. Properties of the six FSZs
FSZs Nodes Edges Trips Average
degree
Average weighted degree
Graph density
1 74 21362 78629 320 1278 0.048
2 198 18374 67535 184 684 0.042
3 274 29297 72206 148 370 0.057
4 279 23833 54867 117 267 0.048
5 149 718 1098 8.3 12.3 0.014
6 259 917 1207 6.6 8.3 0.009
Figure 8. Cumulative probability of normalized degree (a) and normalized weighted degree (b) of the six FSZs
In Figure 8, we plot the cumulative probability curves of the normalized
degrees and the normalized weighted degrees of the six FSZs. As shown in
the figure, the properties of FSZ 2, 3 and 4 turn out to be similar, so do those
of FSZ 5 and 6. It could be proved that the group classification of the FSZ is reasonable. On the other hand, we could see that the cumulative probability of degrees in all FSZs increased rapidly in the beginning and then gradually slowed down. This implies that there exist a few nodes with a very high weighted degree, which dominates taxi trip flows for each FSZ. Furthermore, we detect such nodes as the hot spots of each FSZ according to the distribution of the weighted degrees. The result has been presented in Figure 9.
Figure 9. The spatial distribution of hot spots of each FSZ according to weighted degrees of each node
3.4 Evaluating and optimizing proposed urban land-use planning
In order to evaluate land use in the proposed FSZ, we analyze the land use
planning scheme of the Master Plan of Xiamen City (2010-2020). We classify
the planned land use categories and summarize the percentage of each type of
land in each FSZ. As shown in Figure 10, we identified that residential land
accounts for a large proportion of land use in all FSZs. The trips in FSZs
account for 65.1 percent of all the daily taxi trips, and the total trip mileages
of all trips in these six FSZs only take up 33.6 percent of all trips. Thus, it can
be inferred that the short-distance taxi trips among FSZs may be the major
cause of traffic congestion.
Specifically, taking FSZ 1 (whose area is the smallest) as an example, the residential district land accounts for 49% of the total planned land within it, while most of the FSZs own an appropriate proportion of commercial and recreational districts, except FSZ 5, whose commercial proportion is relatively small. As for the proportion of official districts, a significant difference exists between Xiamen Island and the mainland areas. Clearly, the mainland area covers a relatively smaller proportion of the official district than Xiamen Island, which will probably lead to an excess of commuting heading to or out of the island. At the same time, a great number of industrial districts are distributed on the mainland areas, which necessarily require a settlement of workmen and would result in social differentiation to some extent. According to the results, it is urged that urban planners and policy makers should adjust the land use configuration in these FSZs.
Figure 10. Comparison of planned land use conditions in the six FSZs
4. DISCUSSIONS AND CONCLUSIONS
Planning can manage individual travel behavior to some extent, however
it is not able to co-ordinate individual travel behavior concretely, without
considering the current situation. City blueprints depicted by traditional
spatial planning based on aesthetics can rarely be realized. According to the
former analysis, there is considerable disequilibrium between development on
and off Xiamen Island. Clearly though, Xiamen Island has an absolute
advantage in attracting people and activities, compared with the planned city
center in the east of Xiamen City, which as yet is poorly developed. Given
that urban planning could achieve its original goal only when the target of
urban planning matches the social reality, it is therefore of great need to
reconsider if the existing planning has underestimated the aggregation effect
of the old city center and overestimated the effect of guiding urban
development outward from the island. Considering the fact that Xiamen is a
coastal city generated from an island city, it is necessary for Xiamen to develop beyond the boundaries of the island. Therefore, it is necessary to enhance the multi-centric structure of Xiamen, which is still weak thus far.
It is in western countries that rational planning has matured, while in China, the planning industry has not yet truly accepted rational planning.
However, there is an increasing number of scholars reflecting on traditional spatial planning and appealing to the application of quantitatively analyzing that which is objective and scientific in the planning progress. Moreover, access of diverse analysis platforms and availability of big data has made it inevitable, to some extent, that urban planning transforms from a traditional spatial aesthetic to a modern spatial science.
This study has built a complex network based on taxi trip data and applies the community detection method, to deeply understand urban dynamics in this research. Then, the research puts forward evaluation and suggestions for proposed urban planning on the basis of quantified urban dynamics. This research can, after all, be considered an attempt at rational planning. It provides a relevant contribution by exploring the potential of applying the taxi trip data to revelations in urban dynamics and urban planning optimization utilizing a community detection method. However, since travel by taxi is only one of the diverse ways in which people travel, limitations exist inevitably.
Therefore, our future work intends to progress through the merging of multiple data sources and methods.
REFERENCES
Alexander, E. R. (2000). "Rationality Revisited: Planning Paradigms in a Post-Postmodernist Perspective". Journal of planning education and research, 19(3), 242-256.
Austwick, M. Z., O’Brien, O., Strano, E., & Viana, M. (2013). "The Structure of Spatial Networks and Communities in Bicycle Sharing Systems". PloS one, 8(9), e74685.
Benevolo, L., & Landry, J. (1967). The Origins of Modern Town Planning: Mit Press Cambridge, MA.
Blondel, V. D., Guillaume, J.-L., Lambiotte, R., & Lefebvre, E. (2008). "Fast Unfolding of Communities in Large Networks". Journal of statistical mechanics: theory and experiment, 2008(10), P10008.
Gao, S., Liu, Y., Wang, Y., & Ma, X. (2013). "Discovering Spatial Interaction Communities from Mobile Phone Data". Transactions in GIS, 17(3), 463-481.
Liang, X., Zheng, X., Lv, W., Zhu, T., & Xu, K. (2012). "The Scaling of Human Mobility by Taxis Is Exponential". Physica A: Statistical Mechanics and its Applications, 391(5), 2135- 2144.
Liu, X., Gong, L., Gong, Y., & Liu, Y. (2015). "Revealing Travel Patterns and City Structure with Taxi Trip Data". Journal of Transport Geography, 43, 78-90.
Liu, Y., Sui, Z., Kang, C., & Gao, Y. (2014). "Uncovering Patterns of Inter-Urban Trip and Spatial Interaction from Social Media Check-in Data". PloS one, 9(1), e86026.
Lu, Y., & Liu, Y. (2012). "Pervasive Location Acquisition Technologies: Opportunities and Challenges for Geospatial Studies". Computers, Environment and Urban Systems, 36(2), 105-108.
Malliaros, F. D., & Vazirgiannis, M. (2013). "Clustering and Community Detection in Directed Networks: A Survey". Physics Reports, 533(4), 95-142.
McLaughlin, R. B. (2012). "Land Use Regulation: Where Have We Been, Where Are We Going?". Cities, 29, S50-S55.
Newman, M. E. (2013). "Spectral Methods for Community Detection and Graph Partitioning".
Physical Review E, 88(4), 042822.
Newman, M. E., & Girvan, M. (2004). "Finding and Evaluating Community Structure in Networks". Physical Review E, 69(2), 026113.
Pan, G., Qi, G., Wu, Z., Zhang, D., & Li, S. (2013). "Land-Use Classification Using Taxi Gps Traces". Intelligent Transportation Systems, IEEE Transactions on, 14(1), 113-123.
Peng, C., Jin, X., Wong, K.-C., Shi, M., & Liò, P. (2012). "Collective Human Mobility Pattern from Taxi Trips in Urban Area". PloS one, 7(4), e34487.
Roth, C., Kang, S. M., Batty, M., & Barthélemy, M. (2011). "Structure of Urban Movements:
Polycentric Activity and Entangled Hierarchical Flows". PloS one, 6(1), e15923.
Wang, W., Pan, L., Yuan, N., Zhang, S., & Liu, D. (2015). "A Comparative Analysis of Intra- City Human Mobility by Taxi". Physica A: Statistical Mechanics and its Applications, 420, 134-147.
Yuan, J., Zheng, Y., & Xie, X. (2012). "Discovering Regions of Different Functions in a City Using Human Mobility and Pois". Paper presented at the 18th ACM SIGKDD International Conference on Knowledge Discovery and Data Mining.
Yuan, N. J., Zheng, Y., Zhang, L., & Xie, X. (2013). "T-Finder: A Recommender System for Finding Passengers and Vacant Taxis". Knowledge and Data Engineering, IEEE Transactions on, 25(10), 2390-2403.