Abstract
Objectives: The purpose of this study was to develop a quantitative method for myocardial blood flow (MBF) measurement using contrast-enhanced multidetector computed tomography (MDCT) images with bolus tracking and helical scanning.
Materials and Methods: Nine canine models of left anterior descending artery stenosis were prepared and underwent MDCT perfusion imaging during adenosine infusion to study a wide range of flow parameters. Neutron-activated microspheres were injected to document MBF during adenosine infusion. Six animals underwent dynamic MDCT perfusion imaging, and K1 and k2 (which represent the first-order transfer constants from left ventricular blood to myocardium and from myocardium to the vascular system, respectively) were measured using a two-compartment model. The results were compared against microsphere MBF measurements, and the extraction fraction (E) of contrast agent and the mean value of K1/k2 were calculated. Six animals then underwent helical CT perfusion imaging, and neutron-activated microspheres were injected to document MBF during adenosine infusion. For each animal, based on E, K1/k2, time-registered helical CT myocardial data, and arterial input function data, tables of myocardial CT values versus MBF were simulated for various MBF values to create look-up tables from the myocardial CT value to MBF. The CT-derived MBF values were compared against the microsphere MBF measurements.
Results: A strong linear correlation was observed between the MDCT-derived MBF and the microsphere MBF (y = 1.065x – 0.616, R2 = 0.838).
Conclusions: Regional MBF can be measured accurately using a combination of bolus tracking and time-registered helical CT data from contrast-enhanced MDCT scanning during adenosine stress.
Key words: Multidetector computed tomography, Myocardial blood flow, Perfusion, Adenosine stress, Two- compartment model
Introduction
Quantitative assessment of myocardial blood flow (MBF) by contrast-enhanced first-pass imaging has been demonstrated in animals and patients by employing MRI or CT with the use of extracellular contrast agent and applying methods based on deconvolution of the time course of the measured tissue signal with the blood pool input function1,2 or based on compartmental model-based analysis.3-5 Previously, studies from our laboratory and other groups have demonstrated that accurate and quantitative myocardial perfusion information can be derived from dynamic MDCT imaging protocols designed to track contrast kinetics in the arterial blood pool and myocardium.6,7 However, dynamic MDCT imaging, due to its high radiation dose and limited cardiac coverage in the Z-axis, is not a practicable technique for myocardial perfusion imaging in humans and cannot provide coronary arterial imaging simultaneously. On the other hand, helical or large field of view
MDCT imaging can provide full cardiac coverage and coronary arterial imaging. Recent studies from our laboratory have established that semiquantitative perfusion information can be derived from protocols designed for MDCT angiography when performed during vasodilator stress. In addition, while relative differences in myocardial perfusion are visually evident in the presence of an epicardial arterial stenosis, there is also a significant relationship between myocardial attenuation values normalized to the arterial blood pool attenuation and myocardial blood flow. However, this relationship falls short of being quantitative in its accuracy.8,9
Accordingly, the purpose of this study was to test a novel method for deriving quantitative myocardial blood flow measurements from MDCT angiography images with bolus tracking and helical scanning.
Materials and methods
Animal Preparation and Coronary Stenosis Placement
The Animal Care and Use Committee of the Johns Hopkins University School of Medicine approved all procedures. A total of nine mongrel dogs (24.5-36 kg) were anesthetized with intravenous thiopental (3-4 mg/kg), intubated, and Received 22 May 2015, Accepted 9 July 2015
Corresponding author : Takashi Ichihara, PhD
Faculty of Radiological Technology, Fujita Health University School of Health Sciences, 1-98 Dengakugakubo, Kutsukake-cho, Toyoake, Aichi 470-1192, Japan E-mail [email protected]
A technique for quantitative measurement of myocardial blood flow using a combination of bolus tracking and time-registered helical multidetector CT angiography during adenosine stress
Takashi Ichihara, PhD
1*, Richard T. George, MD
2*, Richard Mather, PhD
5, Joao A.C. Lima, MD
2,3, Albert C. Lardo, PhD
2,4*These two authors contributed equally to this article.
1Faculty of Radiological Technology, Fujita Health University School of Health Sciences, Toyoake, Aichi, Japan, 2Department of Medicine, Division of Cardiology, The Johns Hopkins University School of Medicine, Baltimore, MD, USA, 3Department of Radiology, The Johns Hopkins University School of Medicine, Baltimore, MD, USA, 4Department of Biomedical Engineering, The Johns Hopkins University School of Medicine, Baltimore, MD, USA, 5Toshiba Medical Research Institute USA, Vernon Hills, IL, USA
Original Article Open Access
mechanically ventilated with isoflurane anesthesia (1%-2%) during preparation and MDCT scanning. Following vascular cutdowns, 8F sheaths were placed in both femoral veins, the right femoral artery, and the right internal jugular vein. A left thoracotomy was performed in the fifth intercostal space, and the pericardium was excised. A catheter was placed in both the left atrium and the proximal descending aorta for neutron-activated microsphere administration and sampling, respectively (STERIspheresTM, BioPAL, Inc., Worcester, MA, USA). The proximal to mid left anterior descending artery (LAD) was isolated and instrumented with an electromagnetic flow meter, and reactive hyperemia was tested in the vessel with an inflatable external occluder. Suture was then secured around the LAD and tightened to produce a graded stenosis with the aim of maintaining baseline flow while attaining a reduction of 50% or more in hyperemic flow. The thoracotomy was closed and the animal was transported to the MDCT suite using a portable ventilator.
Dynamic MDCT Imaging Protocols
Six animals underwent dynamic imaging with a 64-row MDCT system (AquilionTM 64, Toshiba Medical Systems Corporation, Otawara, Japan) as previously described6 (Note:
three animals underwent both dynamic and helical CT imaging). The animals received intravenous metoprolol (5-20 mg) to achieve a heart rate of <100 bpm and pancuronium (0.1 mg/kg) to avoid respiratory motion artifacts. Adenosine was infused intravenously (0.14 mg/kg/min) for 5 minutes, followed by bolus intravenous injection of iodixanol contrast agent (VisipaqueTM, 320 mg iodine/ml, Amersham Health, Amersham, UK) via the right internal jugular access at a rate of 10 ml/
s for a total of 30 ml. Respiration was then suspended with the airway open to air, and imaging was performed using a dynamic MDCT protocol with the following parameters: gantry rotation time = 400 ms, detector collimation = 8 mm × 4, tube voltage = 120 kV, tube current = 150 mA, and scan time = 70 s. Immediately following imaging and prior to discontinuation of the adenosine infusion, neutron-activated microspheres were injected to document MBF during adenosine infusion.
Helical CT Imaging Protocols
Six animals underwent helical CT imaging as previously described9 (Note: three animals underwent both dynamic and helical CT imaging). The animals received intravenous propranolol (5-20 mg) to achieve a heart rate of <100 bpm. In order to study a wide range of flows, adenosine was infused intravenously for 5 minutes at 0.14 mg/kg/min in three experiments and at 0.21 mg/kg/min in three dogs. After scout film acquisition, iodixanol contrast agent was infused intravenously at a rate of 2.5 ml/s for a total of 100 ml. Using bolus tracking, MDCT scanning was initiated when a threshold of 180 Hounsfield units (HU) was detected in the ascending aorta. Prior to discontinuation of the adenosine infusion, neutron-activated microspheres were injected to document MBF during adenosine infusion (Figure 1).
Myocardial Microsphere Sample Processing
After imaging, the animals were euthanized with a saturated solution of potassium chloride, and the heart was excised and divided into five equal slices perpendicular to the short axis.
Myocardial samples (0.87-3.24 g) were excised and processed from the anterior, anteroseptal, lateral, inferolateral, inferior,
and inferoseptal walls from base to apex according to the 17-segment system.11,12
Calculation of the Extraction Fraction and the Mean Value of K1/k2
In order to determine the extraction fraction (E) and the mean value of K1/k2,10 dynamic MDCT images were reconstructed without beam hardening correction using full scan reconstruction without ECG gating and analyzed as previously described.6 Using custom perfusion analysis software (CineTool, GE Medical Systems, Waukesha, WI, USA) and hand planimetry, regions of interest (ROIs) were drawn in the stenotic (anterior myocardial wall) and remote (lateral wall and inferior wall) territories registered to the location of microsphere sampling and in the left ventricular (LV) blood pool for the arterial input function (AIF). The mean attenuation density values within the ROIs were calculated, and time-attenuation curves (TACs) were constructed. A curve-smoothing function was applied to each TAC using a moving average with a period of five. The myocardial and blood pool TACs were then fitted to a two- compartment tracer kinetic model to calculate the two rate constants K1 and k2 and the mean value of K1/k2 using the graphic plot method13 as described below.
Mathematical analysis of the compartmental model produces the following system of linear differential equations. The mass balance of contrast agent is described by the following equation (eq.):
dt dCmyo(t)
= K1Ca(t)−k2Cmyo(t) (1)
where Cmyo(t) is the relative concentration of contrast agent in the myocardium as a function of time t, Ca(t) is the relative concentration of contrast agent in the arterial blood (i.e., the blood in the left ventricle), and K1 and k2 represent the first- order transfer constants from arterial blood to myocardium and from myocardium to the vascular system, respectively (in units of ml/g/min). K1/k2 (≡λ) is the fractional partition coefficient of contrast agent within the myocardium. K1 can be shown to be related to the regional MBF by the following
Myocardial perfusion measurement protocol for contrast-enhanced helical CT scanning.
The time-attenuation curves (TACs) from bolus tracking and time-registered helical CT imaging were combined taking into account the 3.6-s delay between the two imaging modes. Each TAC was baseline corrected.10 tmid is the mid-period of helical CTA scanning for myocardial attenuation density measurements.
Figure 1
equations:14
K1 = E × F (2) E = (1-exp(-PS/F)) (3)
where E is the extraction fraction, PS is the permeability- surface area product, and F represents myocardial flow (in units of ml/g/min). Using Eq. 3, E can be described as E = K1/ F. Then, PS can be described as Fm ln(K1/Fm-1) using the dynamic CT-derived K1 and Fm (microsphere-derived MBF). A look-up table can also be created to obtain the MBF (F) value from K1 = (1-exp(-PS/F)) × F.15
Calculation of the Helical CT Perfusion Parametric Image
The bolus-tracking data and time-registered helical CT images for characterization of the AIF were reconstructed as previously described.9 A ROI was drawn in the aortic root of each bolus-tracking image and in the intravascular blood pool of each helical CT image. Each image in the axial plane was assigned a mean acquisition time from the initiation of helical imaging. The mean attenuation density in HU was calculated.
These data were combined with the time-registered helical CT data (taking into account the 3.6-s delay between the two imaging modes) to create the TAC of the AIF. Each TAC was baseline corrected by subtracting the attenuation density of the intravascular blood pool from the measured attenuation density (Figure 1).
In order to calculate the myocardial attenuation density for various MBF values during helical CTA scanning in individual dog studies, we generated a look-up table from K1 to MBF.
Using the above-mentioned two-compartment tracer kinetic model and the mean value of K1/k2 (≡λ) from dynamic CTA data, as the solution of eq. (1), Cmyo(t), which is the attenuation density of the myocardium during contrast-enhanced helical CTA scanning, is expressed as follows:3
Cmyo(t)= K1
∫
0tCa(τ)e-λK1(t-τ)d(τ) (4)where it is assumed that Cmyo(t) is zero at time zero.
The composite AIF was used as Ca(t).9 The values of Cmyo(tmid) in the myocardium for various K1 values at the mid- period (tmid) of helical CTA acquisition were calculated using eq. (4) to create a look-up table. This look-up table could then be used to obtain K1 from the measured attenuation values of Cmyo(tmid). Using eq. (2), the K1 value could then be converted to MBF.10 In this way, helical CTA images were converted to MBF parametric images. Finally, the calculated MBF values were compared against the MBF values obtained using microspheres.
Statistical Analysis
The fractional partition coefficient (K1/k2≡λ) was expressed as the mean value ± standard deviation. Paired t-tests were performed to determine whether there were significant differences between the stenotic and remote myocardial territories. The K1 values calculated from dynamic CTA values were compared against the mean microsphere MBF values using the paired t-test.
The mean MBF values calculated from helical CT were compared against the mean microsphere MBF values using the paired t-test. The relationships between the microsphere MBF and calculated flow values were evaluated by linear regression analysis, and Bland-Altman analysis was performed to determine whether there were significant differences in the estimation of MBF. In the regression analysis, the multiple measures clustered in each experiment were accounted for
such that measurements were considered to be independent across the different dogs but not within individual dogs. All statistical analyses were performed at a level of P<0.05 using JMP Version 8 software (SAS Inc., Cary, NC, USA).
Results
Dynamic CT Imaging
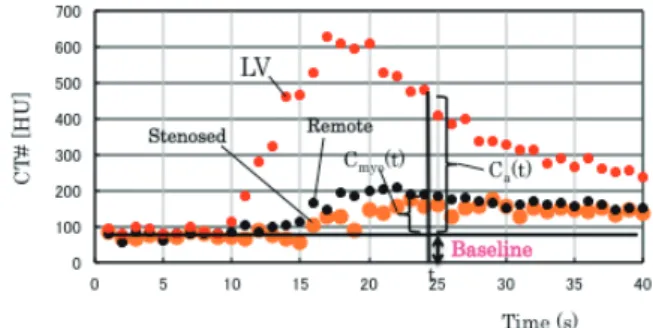
The time-attenuation curves for the remote and stenotic myocardial territories obtained during first-pass dynamic contrast-enhanced CT imaging are shown in Figure 2. Figure 3 shows the dynamic CT-derived K1 and the microsphere- derived MBF. Figure 4 shows the relationship between the PS value and the microsphere-derived MBF. There is a good linear correlation between the PS value and the absolute MBF obtained using microspheres (PS = 0.339F + 0.3193, R2 = 0.755).
Then, the extraction fraction was obtained using the following equation:
E = (1-exp(-(0.3396F + 0.3193)/F)) (5)
Figure 5 shows the relationship between the dynamic CT- derived MBF and the microsphere MBF. An excellent linear correlation is seen between the MBF calculated from dynamic CT and the absolute MBF obtained using microspheres (y = 0.931x - 0.075, R2 = 0.838). By fitting the results of K1 and k2
obtained from dynamic CT, the mean K1/k2 was determined to be 0.339 ± 0.071. There was no significant difference in K1/ k2 between the stenotic and remote myocardial territories (Table 1). The K1 values calculated from dynamic CT were compared against the mean microsphere MBF values, and the results showed that the calculated K1 values could be used to distinguish between the stenotic and remote territories during adenosine stress (Table 2).
Helical CT Imaging
The variability in the flow measurements obtained using helical CT as a function of flow is shown in Figure 6. A strong linear correlation is seen between the helical CT-derived MBF and the microsphere MBF (y = 1.0648x - 0.6159, R2 = 0.8383).
Figure 7 shows Bland-Altman plots comparing the calculated MBF values from helical CT scanning and the microsphere MBF values. Myocardial perfusion measurements obtained by helical CT imaging in the stenotic and remote myocardial territories are shown in Table 3. Paired t-test analysis of the MBF obtained using microspheres and the calculated MBF values (P<0.05) showed that the helical CT-derived MBF values can be used to distinguish between the stenotic and remote myocardial territories during adenosine stress.
Examples of TACs for remote and stenotic left ventricular myocardial territories and LV blood in dynamic MDCT perfusion images.
Figure 2
Comparison between the dynamic CT-derived K1 and the microsphere- derived MBF. A linear relationship is seen between the dynamic CT-derived K1 and the microsphere-derived MBF (fitted line: y = 0.294x + 0.151, R2 = 0.842).
Figure 3
Relationship between the dynamic CT-derived MBF and the microsphere MBF.There is an excellent linear correlation between the calculated MBF obtained from dynamic CT and the absolute MBF obtained using microspheres (y
= 0.931x - 0.075, R2 = 0.838). The measured K1 values (Figure 3) were converted to calculated flow using a look-up table with extraction fraction correction from K1 to MBF.
Figure 5
Bland-Altman plots showing comparison of the helical CT-derived MBF and the microsphere MBF. The dashed lines indicate 1.96 SD. SD = standard deviation.
Figure 7
Helical CT-derived MBF versus microsphere MBF.
There is a strong linear relationship between the helical CT-derived MBF and the microsphere MBF.10 There are two clusters in this figure. They correspond to the stenotic territory (low MBF) and the remote territories (high MBF) during adenosine stress.
Figure 6
Relationship between the PS value and the microsphere-derived MBF.
PS can be described as PS = Fm ln(K1/Fm - 1), where K1 is the dynamic CT- derived K1 and Fm is the microsphere-derived MBF. The microsphere-derived MBF and Fm ln(K1/Fm - 1) are plotted in this figure. There is a good linear correlation between the PS value and the absolute MBF obtained using microspheres (PS = 0.339F + 0.3193, R2 = 0.755).
Figure 4
Table 1. K1/k2 (≡λ) Measurements Obtained by Dynamic MDCT Imaging in Stenotic Versus Remote Myocardial Territories
Parameter Stenotic Territory Remote Territory Standard Error P Value
dynamicCTA- λ 0.327 0.345 0.024 0.243
Table 2. K1 Measurements Obtained by Dynamic MDCT Imaging in Stenotic Versus Remote Myocardial Territories
Parameter Stenotic Territory (ml/g/min)
Remote Territory (ml/g/min)
Standard Error P Value Microsphere
Flows 1.36 3.66 0.94 0.028
dynamicCTA-K1 0.517 1.24 0.33 0.038
Table 3. Myocardial Perfusion Measurements Obtained by Helical CT Imaging in Stenotic Versus Remote Myocardial Territories Parameter Stenotic Territory
(ml/g/min)
Remote Territory (ml/g/min)
Standard Error P Value Microsphere
Flows 2.36 9.05 2.46 0.021
Calculated Flow 1.75 9.1 2.96 0.027
Discussion
We have shown that: 1) the calculated MBF obtained using a combination of bolus tracking and time-registered helical CTA imaging agrees well with the microsphere MBF and 2) the helical CT-derived K1 value and the calculated MBF can be used to distinguish between stenotic and remote myocardial territories during adenosine stress.
Tracer Kinetic Model and the Fractional Partition Coefficient of Contrast Agent
To obtain physiological information concerning tissues based on analysis of the tissue TACs in a contrast-enhanced dynamic CT study, we employed a two-compartment tracer kinetic model. In this model, all myocardial capillaries, interstitium, and cells are defined as one compartment. The input function of Ca(t) in this study represents the concentration of contrast agent in the intravascular blood pool, not the plasma volume.
The concentration of contrast agent in plasma can be described as Ca(t)/(1 - Hct), where Hct is the hematocrit, which was assumed to be 45% in all of the dogs. Therefore, the fractional partition coefficient of contrast agent in the myocardium was defined as (1 - Hct)K1/k2. In this study, the fractional partition coefficient was found to be 0.188 ± 0.039. This showed good agreement with the value of 0.153 ± 0.052 obtained using Gd- DTPA and MRA reported by Vallée et al.5
Quantitative MBF Measurement Protocol and Technique
We have shown that the helical CT-derived MBF can be used to distinguish between stenotic and remote myocardial territories during adenosine stress. Based on comparative evaluation of the dog experiments and the simulation results for the measurement of regional MBF, we expect that this will prove to be a useful helical CTA technique in which scanning is performed with the continuous intravenous infusion of contrast agent. Using a correction method based on the modified PS model in eq. (5) and conversion tables, we demonstrated a strong linear correlation between the calculated MBF and the microsphere MBF (y = 1.065x - 0.616, R2 = 0.838) (Figure 6). The generally accepted reference method for noninvasive quantification of absolute MBF is positron emission tomography (PET) with either oxygen-15- labeled water16 or nitrogen-13-labeled ammonia used as the positron-emitting tracer.17 After the intravenous administration of the flow tracer and dynamic imaging, MBF measurements are obtained by determination of the AIF and myocardial tissue response from the ROIs assigned to the left ventricular blood pool and left ventricular myocardium and fitting of the resulting time-activity curves with the tracer kinetic compartment model. Kuhle et al.17 reported a strong linear correlation between calculated ammonia-PET flows and microsphere flows (y = 0.94x + 0.057, R = 0.93). This relation is similar to that found in the present study.
Clinical Implications
MDCT, as compared with MR imaging and radionuclide myocardial perfusion imaging, has several unique advantages, including wide availability, short scanning times, and high spatial resolution. The proposed myocardial perfusion CT method has the potential to provide quantitative regional MBF information with high spatial resolution. With simultaneous coronary artery and CT perfusion imaging using the proposed helical myocardial perfusion CT protocol under rest and stress
conditions, MDCT could simultaneously depict atherosclerosis and its functional effects on the myocardium. Furthermore, indeterminate multidetector CT angiograms that show severe calcifications or motion artifacts could benefit from such myocardial perfusion measurements. This added information can be acquired without the time and expense that a second imaging examination would entail.
Study Limitations
The present study suffers from several limitations that could lead to errors in the MBF values. Beam hardening can cause a decrease in the attenuation measured in myocardial tissue and thus interfere with the ability to perform quantitative myocardial perfusion calculations. We used the myocardial attenuation density measured during helical CT and selected the mid-period (tmid) of helical CTA imaging for MBF calculation, which is a limitation because it does not allow the exact elucidation of myocardial contrast kinetics.
Due to the 3.6-s delay between bolus tracking and helical CT imaging (which was needed to change the tube current and collimator position), the AIF TACs obtained in this study were incomplete. In addition, data interpolation can cause errors in AIF characterization. This study also involved only a small number of experiments, and larger studies are needed to confirm the results. Further studies are also needed to determine K1/k2 and the relationship between MBF and the extraction fraction of iodixanol contrast agent in human myocardium.
Conclusion
The MBF obtained using a combination of bolus tracking and time-registered helical myocardial perfusion CT correlates well with the microsphere MBF. The proposed helical myocardial perfusion CT method shows promise for the quantification of regional MBF.
Acknowledgements
This work was supported in part by Toshiba Medical Systems Corporation. This work was published in part at the 2010 IEEE Nuclear Science Symposium, Medical Imaging Conference, Knoxville, Tennessee, USA.
Conflict of interests
Dr. Goerge RT has a patent (combined multi-detector CT angiography and CT myocardial perfusion imaging for the diagnosis of coronary artery disease: US-8615116); Dr. Mather R is an employee of Toshiba Medical Systems Corporation; and Dr. Lardo AC received research grant from Toshiba Medical Systems Corporation.
References
1. Jerosch-Herold M, Hu X, Murthy NS, Rickers C, Stillman AE. MRI of myocardial contrast enhancement with MS-325 and its relation to myocardial blood flow and the perfusion reserve. J Magn Reson Imaging 2003;18: 544-54.
2. Axel L. Tissue mean transit time from dynamic computed tomography by a simple deconvolution technique. Invest Radiol 1983;18:94-99.
3. Diesbourg LD, Parato FS, Wisenberg G, Drost DJ, Marshall TP, Carroll SE, OʼNeill B. Quantification of myocardial blood flow and extracellular volumes using a bolus injection of Gd-DTPA: Kinetic modeling in canine ischemic disease. Magn Reson Med 1992;23:239-53.
4. Larsson HBW, Hansen TF, Rostrup E, Søndergaard L, Ring P, Henriksen O.
Myocardial perfusion modeling using MRI. Magn Reson Med 1996;35:716-26.
5. Vallée JP, Lazeytas F, Kasuboski L, Chatelain P, Howarth N, Righetti A, Didier
D. Quantification of myocardial perfusion with fast sequence and Gd bolus in patients with normal cardiac function. J Magn Reson Imaging 1999;9:197-203.
6. George RT, Jerosch-Herold M, Kitagawa K, Bluemke DA, Lima JAC, Lardo AC. Quantification of myocardial perfusion using dynamic 64-detector computed tomography. Invest Radiol 2007;42:815-22.
7. Daghini E, Primak AN, Chade AR, Zhu X, Ritman EL, McCollough CH, Lerman LO. Evaluation of porcine myocardial microvascular permeability and fractional vascular volume using 64-slice helical computed tomography (CT).
Invest Radiol 2007;42:274-82.
8. George RT, Silva C, Cordeiro MAS, Thompson DR, McCarthy WF, Ichihara T, Lima JAC, Lardo AC. Multi-detector computed tomography myocardial perfusion imaging during adenosine stress. J Am Coll Cardiol 2006;48:153-60.
9. George RT, Ichihara T, Lima JAC, Lardo AC. A method for reconstructing the arterial input function during helical CT: Implications for myocardial perfusion distribution imaging. Radiology 2010;255:396-404.
10. Ichihara T, George RT, Mather R, Silva C, Lima JAC, Lardo AC. Quantification of Myocardial Blood Flow Using the Combination of Bolus Tracking and Time- registered Helical Multidetector CT Angiography During Adenosine Stress, in Proc Conf Rec 2010 IEEE Nuclear Science Symp Medical Imaging Conf, 2010:2573-77.
11. Reinhardt CP, Dalhberg S, Tries MA, Marcel R, Leppo JA. Stable labeled microspheres to measure perfusion: Validation of a neutron activation assay technique. Am J Physiol Heart Circ Physiol 2001;280:H108-16.
12. Cerqueira MD, Weissman NJ, Dilsizian V, Jacobs AK, Kaul S, Laskey WK, Pennell DJ, Rumberger JA, Ryan T, Verani MS. Standardized myocardial segmentation and nomenclature for tomographic imaging of the heart: A statement for healthcare professionals from the Cardiac Imaging Committee of the Council on Clinical Cardiology of the American Heart Association.
Circulation 2002;105:539-42.
13. Yokoi T, Iida H, Itoh H, Kanno I. A new graphic plot analysis for cerebral blood flow and partition coefficient with iodine-123-iodoamphetamine and dynamic SPECT validation studies using oxygen-15-water and PET. J Nucl Med 1993;34:498-505.
14. Crone C. The permeability of capillaries in various organs as determined by use of the indicator diffusion method. Acta Physiol Scand 1963;58:292-305.
15. Ichihara T, George RT, Silva C, Lima JAC, Lardo AC. Quantitative analysis of first-pass contrast-enhanced myocardial perfusion multidetector CT using a Patlak plot method and extraction fraction correction during adenosine stress.
IEEE Trans on Nuclear Sci 2011;58:133-38.
16. Bergmann SR, Herrero P, Markham J, Weinheimer CJ, Walsh MN.
Noninvasive quantification of myocardial blood flow in human subjects with oxygen-15-labeled water and positron emission tomography. J Am Coll Cardiol 1989;14:639-52.
17. Kuhle WG, Porenta G, Huang SC, Buxton D, Gambhir SS, Hansen H, Phelps ME, Schelbert HR. Quantification of regional myocardial blood flow using
13N-ammonia and reoriented dynamic positron emission tomographic imaging.
Circulation 1992;86:1004-17.
Copyright©2015 Takashi Ichihara, PhD et al.
This is an Open access article distributed under the Terms of Creative Commons Attribution License, which permits unrestricted use, distribution, and reproduction in any medium, provided the original author and source are credited.