Abstract
Japan, a wealthy and sophisticated market, has the potential to be a major destination for foreign direct investment (FDI) due to its local advantages such as market size, an educated workforce and advanced technological capabilities. It is surprising therefore that Japan has a reputation for being averse to inward FDI. In fact Japan was dubbed as the most closed investment market in the developed world by European Union Trade Commissioner Peter Mandelson in his 2008 address to business and government leaders in Tokyo. Japan’ s trade statistics compared to other developed nations suggest there may be deterrents that are suppressing inbound FDI. As a G7 nation and a member of the Organisation for Economic Co-operation and Development (OECD), Japan is competing against other worthwhile destinations for investment capital, and like its competitors, Japan needs to constantly improve its business climate in order to stay attractive to multi-national corporations. Fortunately, in keeping with successive prime Minister’ s goal of increasing incoming FDI, Japan has been taking steps to become friendlier to foreign capital over the years.
This paper will assess the current state of Japan’ s inward FDI and evaluate Japan’ s performance in relation to its major global and regional competitors particularly other G7 nations and OECD members. It discusses Japan’ s openness in terms of existing impediments to FDI and look at Japan’ s international perception based on its ranking on two global indices. As well, there is an overview of the government’ s goals for increasing FDI and local initiatives to stimulate openness to foreign capital. Finally there are suggestions for areas of opportunities that Japan can explore going forward to increase its inbound FDI.
Keywords:Foreign direct investment, FDI, MNC, M&A Introduction
A vibrant local economy is a top priority for most countries, and international trade in the form of foreign direct investment (FDI) helps to achieve this. Openness to international trade in general helps nations profit from industries in which they possess a comparative advantage, increases competition in products and labour markets and helps to bring about economies of scale [Beltramello, De Backer, Mercade, 2011].
Leeja Russell
The Current State of Japanese Inbound FDI:
Deterrents and Initiatives
Benefits specific to FDI often derive from the long term nature of the investments made by multi-national corporations (MNC) in local markets. For example, several studies on FDI have documented the superior performance in productivity, innovation and R&D of foreign affiliates relative to domestic firms in host countries (OECD, 2011a) [Beltramello, De Backer, Mercade, 2011] Furthermore, foreign capital results in unintended benefits that typically spill over from MNCs to the local economy they invest in. Local benefits can potentially arise from FDI when foreign firms demonstrate new technology that diffuse to local companies, train workers who subsequently migrate to other firms, and spur competition which leads to improved efficiency in the local market. When these spillover benefits are assimilated by local suppliers, customers, the workforce, and local firms, FDI contributes additional productivity growth for the host economy [Beltramello, De Backer, Mercade, 2011]).
The long term economic benefits of FDI are compelling enough that economies both large and small find it prudent to improve their investment atmosphere for foreign capital and aggressively market themselves as attractive FDI destinations. On this competitive FDI landscape, where does Japan stand in terms of attracting MNCs to invest within its borders and what issues serve as deterrents to Japan receiving even more cross-border investments?
How does Japan currently business climate rank among other competing nations in regards to openness, taxation and other factors that are important to attracting inward FDI? This report will seek to answer these questions by analyzing data from the Organisation for Economic Co-operation and Development (OECD), the World Bank and other world organizations that track international trade.
In particular, emphasis will be placed on the OECD’ s FDI Restrictiveness Index and the World Bank’ s Ease of Doing Business ranking as they are two of the most reputable global organizations that track trade and investment data for countries worldwide. Japan’ s position on both these indices will shed light on its performance individually and in comparison to other nations. More importantly, the well-defined performance criteria tracked by these two indices will be used to gain a better understanding of the reason behind Japan’ s current inbound FDI status.
Ⅰ Current State of Japanese Inbound FDI
Japan is the third largest economy in the world based on its gross domestic product (GDP)
which stood at USD $4.123 trillion at the end of 2015. It is a major trading partner for most advanced countries and many other developing nations. It accounts for 3.6% of global exports and 4.3% of global imports [WTO, 2015]. Japan ranks 4th worldwide in merchandize exports and imports and ranks 7th and 6th for commercial services export and import respectively.
Japan’ s position as a major economy with many competitive advantages, as well as a sophisticated and wealthy consumer base, makes it a major player in the international trade arena.
Particularly, Japan is an aggressive investor overseas and according to the United Nations
Conference on Trade and Development (UNCTAD) in 2014, it ranked 7
thworldwide for the
value of its off-shore FDI. FDI outflows from Japan, have shown a relatively stable upward trend increasing from 10.3% of GDP in 2006 to just over 28% in 2015 [OECD, 2016], reflecting the tenacity of Japanese firms to develop their business interests abroad.
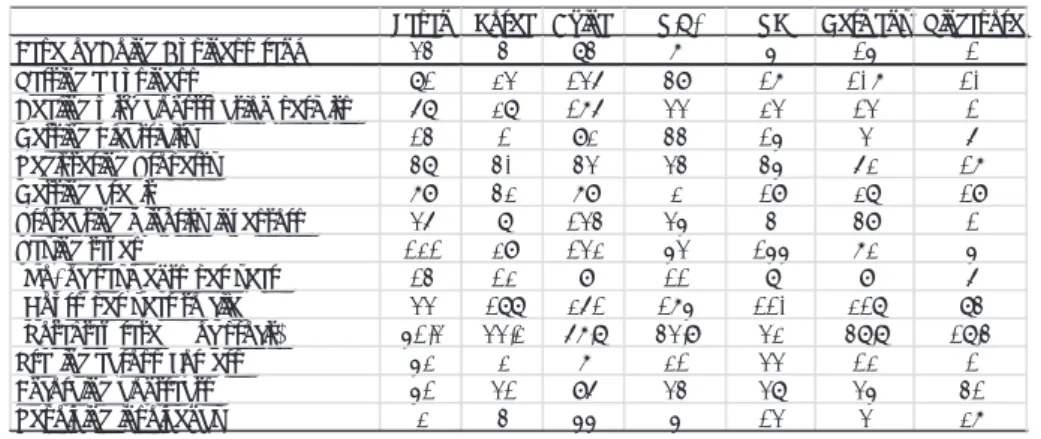
Japan’ s inbound FDI statistics however tells a different story. In 2015, Japan’ s inward FDI stock represented 3.7% of its GDP, a fraction of the OECD average of 42%. As table 1 shows, Sixty four percent of these investments were concentrated in just three industries namely:
finance and insurance (37.9%), transportation equipment manufacturing (13.6%) and electric machinery manufacturing (11.7%) [JETRO, JETRO Invest Japan Report 2015, 2016]. Other areas such as real estate, medical and education attracted very little or no foreign capital.
Japan’ s inward FDI stock had a three-fold increase from USD $29.939 billion to $100.89 billion over the 10 years spanning 1996 to 2005. In 2006 however, Japan had negative inward FDI flows of – $6.5 billion; incoming investments then rebounded until FDI stock reached a peak in 2011 at $225.78 billion (3.82% of GDP) but sagged to USD $170.69 billion (4% of GDP) in 2015, when once again, Japan had negative inbound FDI flows. While inward FDI stock decreased between 2011 and 2015, its percentage of GDP increased suggesting that the Japanese economy had shrunk over the years in question [UNCTD, 2016] (Table 2 and 3).
International merger and acquisition (M&A) is an important component of FDI evidenced Table 1: Top 10 Industries with Inward FDI Stock as at End of 2014
Table 2: Inbound FDI Stock (billions of USD)
Source: Compiled from JETRO Invest Japan Report 2015
Source: Compiled from OECD and World Bank online databases
OECD (2016), FDI stocks (indicator). doi: 10.1787/80eca1f9-en
by the fact that it is the strategy most used by multinational corporations (MNC) to enter a foreign market. Before the financial crisis in 2007, M&A accounted for approximately 80%
of global FDI but fell to around 60% in 2013 however M&A is expected to return to its pre- crisis levels [OECD, 2014]. As such global M&A has been increasing steadily and has almost doubled over the past five years from USD $3,481 billion in 2010 to USD $6,144 billion in 2015.
For the same period however, Japanese inbound M&A was erratic, increasing 20% in 2011, then decreasing 50% in 2013 from 2012 levels. Although M&A rebounded in 2015 to USD $61.6 billion, it was still lower than the USD $63.02 billion average for the prior nine years (Fig. 1).
Ⅱ Comparing Japan’ s Inbound FDI Other Economies
1 .Return on Inward FDI
Historically, Japan has been a chronic underperforming when it comes to attracting foreign capital compared with other developed, and in some cases, developing countries, suggesting that Japan is rather closed to foreign investment [Beltramello, De Backer, Mercade, 2011].
However, MNCs who do make it within Japan’ s borders enjoy very good rates of return on Table 3: Inbound FDI Flows (billions of USD)
Figure 1: M&A Deals in Japan (millions of dollars)
Source: Compiled from OECD and World Bank online database
OECD (2016), FDI flows (indicator). doi: 10.1787/99f6e393-en (Accessed on 10 August 2016)
Source: Compiled from OECD data from various years; https://data.oecd.org
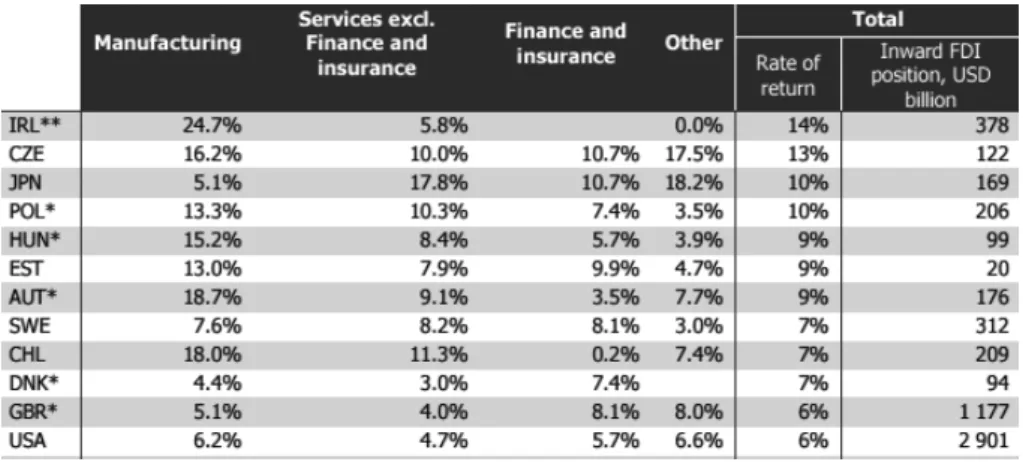
their investments. Japan has the third highest rate of return on inward FDI across all sectors
(10%) behind Ireland (14%) and the Czech Republic (18%). It places first in the service sector with an 18% return on investment, outranking fellow G7 nations the United Kingdom
(4%) and the United States (4.7%) and its Asian neighbor Korea (-0.9%) (Table 4).
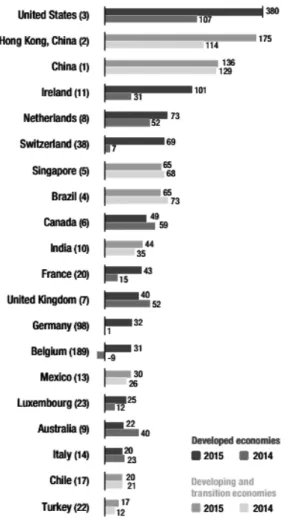
2 .Share of World Inbound FDI Stock
In the 1980’ s, Japans inbound FDI accounted for less than 1.5% of global accumulated FDI
(FDI stock); this was in stark contrast to its 10% share of world GDP [Graham Yoshitomi, 1996]. As of 2015 Japan accounted 4.4% of world GDP and less than 1% (0.6%) of world FDI. Spain and Canada’ s share of world GDP is 1.45% and 1.48% but accounted for 2.1% and 2.86% of global FDI stock respectively. In 2014 OECD nations held 62% of global inbound FDI stocks, out of this Japan accounted for 1%, while Germany and Italy, the G7 nations with the lowest ratios besides Japan accounted for 4.8% and 2% respectively of the OECD share.
Among its neighbours, Korea with a much smaller economy slightly outperformed Japan at .066% of global FDI while China accounted for 10.8%.
3 .Inbound Stock as a Percentage of GDP
On May 6, 2013 the Nihon Keizai Shimbun reported that the ratio of inward FDI to national GDP was 23.2% in the United States and 20.0% in Germany, but only 3.9% in Japan. At that time, the ratio was also far behind that of its neighbours South Korea (11.8%) and China
(10.1%). There have been little changes since so these FDI levels remain typical for Japan in 2015. South Korea in particular had a hesitant stance and restrictive policies toward inward FDI until recently, yet their ratios are at a considerably higher level than Japan’ s.
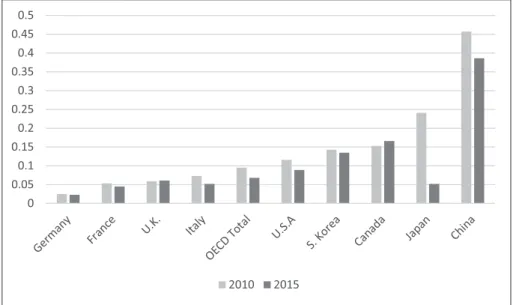
Since Japan sends far more capital overseas than it welcomes at home, it has created a huge gap between Japan’ s inbound and outbound FDI stock as a percentage of GDP. As of 2015, Japan’ s inbound stock is only 4.1% of its GDP while outbound FDI stock represents
Table 4: Average and Sector Rate of Return on Inward FDI
Source: OECD FDI in Figures 2016, pg. 9
29.8%. The OECD average rate of inbound and outbound FDI stock as a percentage of GDP is 35.8% and 42% respectively. Italy has the second lowest inbound FDI/GDP ratio of the G7 nations after Japan, nonetheless Italy maintains an outbound FDI of 25.7% of GDP (compared to Japan’ s 29.8%) but has an inbound FDI to GDP ratio of 18.5%, more than four times higher than Japan (Fig. 2 and Table 5).
Japan’ s comparatively low inbound FDI is puzzling considering it has qualities that make it a competitive investment destination. Japan boasts high R&D capabilities, a highly educated work force and cutting edge technology. Japan has well developed rules therefore risks associated with investments in many other countries, such as expropriation, nationalization, and intellectual property infringement, are not a concern in Japan. Additionally, no significant
2005 2006 2007 2008 2009 2010 2011 2012 2013 2014 2015
Canada 54.61 53.73 70.51 40.04 63.27 60.98 48.23 52.27 52.36 53.51 48.46
China 20.79 22.51 19.07 20.08 25.99 25.99 25.45 24.44 24.56 25.11 26.16
France 16.86 21.24 23.42 19.26 24.06 23.83 24.41 25.37 27.09 24.07 27.26
Germany 22.64 27.85 29.44 24.71 28.23 28.07 26.31 24.39 25.44 21.79 23.61
Italy 12.8 16.1 17.1 13.7 16.6 15.4 15.6 18.1 17.13 16.22 18.48
Japan 2.21 2.47 3.05 4.19 3.98 3.91 3.82 3.45 3.48 3.73 4.15
Luxembourg 174.8 202.3 272.6 225.8 340.9 328.5 384.2 298.5 147.9 278.11 357.1
S. Korea 11.78 11.44 10.86 9.45 13.52 12.38 11.24 12.91 13.85 12.71 12.53
OECD Total 23.74 27.34 30.15 23.32 28.82 29.53 27.95 30.87 33.64 33.48 35.85
U.K. 32.58 40 37.87 32.61 44.34 44.44 44.61 54.76 55.77 54.46 54.54
U.S.A 21.52 23.77 24.53 16.89 20.77 22.87 22.55 24.24 29.7 31.37 31.01
Spain 33.2 36.5 39.5 35.8 42.1 43.8 42.2 48.1 44.16 39.2 44.5