JAIST Repository
https://dspace.jaist.ac.jp/
Title
スピーチにおける感情的な知覚の多層ファジィ論理的
なモデルの構築
Author(s)
黄, 純芳
Citation
Issue Date
2004‑09
Type
Thesis or Dissertation
Text versionauthor
URL
http://hdl.handle.net/10119/1884
RightsDescription
Supervisor:赤木 正人, 情報科学研究科, 修士
!
" #
$
# ! %
&''(
!" # $
" % &
'
( )
*
) ' +
""#
) ' +
) !, -
) '+ '
ABSTRACT
This thesis proposes a multi-layered perceptual model, which attempts to simulate human ability to perceive emotions from speech. Differing from most existing studies that deal with the relationship between acoustic features measured in speech signals and emotions the speech intended, the proposed perceptual model included 3 layers,
emotion, primitive feature, and acoustic feature, where primitive feature is defined as an adjective that is used to describe emotional speech. To accomplish the perceptual model, two approaches should be considered. The top-down approach is adopted to construct a framework for the model, and the bottom-up approach is adopted to verify the existing framework. This thesis focuses on the top-down approach, mainly
The purpose of this thesis is to construct the proposed multi-layered perceptual model by the top-down approach. Two relationships, the emotion and the primitive feature, the primitive feature and the acoustic feature, are investigated sequentially. With regard to the relationship between the emotion and the primitive feature, three
perceptual experiments are conducted. The first experiment examines the utterances in terms of the emotions. The other two experiments, although with different purposes, find suitable primitive features collectively. One is to construct the psychological distance model, and the other is to evaluate the adjectives. Finally, the relationship between the emotion and the primitive feature is built by applying fuzzy logic with these experiment results. With regard to the relationship between the primitive feature and the acoustic feature layer, two attributes of sound, pitch and loudness, are
investigated. According to the analytic results, part of the relationship is build.
Regarding future work, more analysis of acoustic features is needed and also the relationship between the primitive feature and the acoustic feature should be refined by fuzzy logic. Moreover, the model should be verified by bottom-up approach. The significance of the perceptual model is that it clarifies the human ability to perceive emotional speech from an engineering perspective and it also covers the vagueness of human nature. It opens a possibility to many fields of practical applications, for example text-to-speech processing, emotional morphing processing, or improving
human-machine interface to create a “human interface”.
TABLE OF CONTENTS
ABSTRACT...I TABLE OF CONTENTS ... II LIST OF FIGURES ... IV LIST OF TABLES ...V
CHAPTER 1 ... 1
1.1 BACKGROUND... 1
1.2 PREVIOUS WORK... 2
1.2.1 Emotions versus acoustic features... 2
1.2.2 Sound attributes versus acoustic features ... 2
1.2.3 Perception and Fuzzy logic... 3
1.3 GAP IN THE RESEARCH... 3
1.4 PURPOSE AND TASKS OF THE CURRENT RESEARCH... 3
1.4.1 Multi-layered perceptual model of emotional speech ... 4
1.4.2 How to construct?... 5
1.5 ORGANIZATION OF THE THESIS... 6
CHAPTER 2 ... 7
2.1 PURPOSE... 7
2.2 CORPUS, SUBJECTS, AND EQUIPMENTS... 7
2.2.1 Corpus... 7
2.2.2 Subjects... 9
2.2.3 Equipments ... 9
2.2.4 Method ... 10
2.3 RESULTS... 11
CHAPTER 3 ... 12
3.1 EXPERIMENT2: CONSTRUCTION OF PSYCHOLOGICAL DISTANCE MODAL... 12
3.1.1 Purpose ... 12
3.1.2 Corpus, subjects, and equipments ... 13
3.1.3 Method ... 14
3.1.4 Data analysis and results... 14
3.1.5 Discussion... 20
3.2 EXPERIMENT3: RATING ADJECTIVES... 20
3.2.1 The purpose ... 21
3.2.2 A pre-experiment for choosing 34 adjectives from 60 adjectives... 21
3.2.3 Corpus, subjects, and equipments ... 23
3.2.4 Method ... 23
3.2.5 Data analysis and Results... 24
CHAPTER 4 ... 29
4.3 PURPOSE... 32
4.4 UNDERLYING TECHNIQUES OF FIS ... 33
4.5 CONSTRUCTION OF FIS ... 33
4.6 RESULTS... 36
4.7 EXAMINATION... 37
4.7.1 Examination method... 37
4.7.2 Results ... 39
4.8 DISCUSSION... 40
CHAPTER 5 ... 42
5.1 RELATIONSHIP BETWEEN ACOUSTICFEATURES AND PRIMITIVE FEATURES... 42
5.1.1 F0 ... 42
5.1.2 Power ... 45
5.1.3 Discussion... 46
5.2 POWERSPECTRUM... 50
5.2.1 Average power spectrum... 50
5.2.2 Variance in vowel power spectrum... 52
5.3 CONCLUDING REMARKS... 52
CHAPTER 6 ... 56
6.1 SUMMARY... 56
6.2 CONTRIBUTIONS... 60
6.3 FUTUREWORK... 61
APPENDIX-A. ... 62
A-1. RATING RESULT OF EXPERIMENT1 ... 62
A-2. RATING RESULT OF EXPERIMENT2 ... 68
A-3. DETAILED DATA OF REGRESSION COEFFICIENT OF... 70
REFERENCES... 71
LIST OF FIGURES
FIGURE1-1 CONCEPTUAL DIAGRAM OF MULTI-LAYERED PERCEPTUAL MODEL FOR EMOTIONAL
SPEECH... 5
FIGURE2-1 CONFIGURATION OF THE EQUIPMENT USED IN ALL EXPERIMENTS OF THIS THESIS10 FIGURE2-2 ONESAMPLEEVALUATION FORM USED IN EXPERIMENT1... 10
FIGURE2-3 PERCENTAGE OF RATINGS OF THE 5 INTENDED CATEGORIES... 11
FIGURE3-1 SCREENSHOT OF THE EVALUATION PROGRAM IN EXPERIMENT 2... 14
FIGURE3-2 STRESS BY DIMENSION... 17
FIGURE3-3 3-DIMENSIONAL PRESENTATION OF THE PSYCHOLOGICAL DISTANCE MODEL OF 15 UTTERANCES WITH 7% STRESS... 18
FIGURE3-4 2-DIMENSIONAL (DIMENSION 1 AGAINST DIMENSION 2) PRESENTATION OF THE PSYCHOLOGICAL DISTANCE MODEL OF 15 UTTERANCES WITH 7% STRESS... 18
FIGURE3-5 2-DIMENSIONAL (DIMENSION 1 AGAINST DIMENSION 3) PRESENTATION OF THE PSYCHOLOGICAL DISTANCE MODEL OF 15 UTTERANCES WITH 7% STRESS... 19
FIGURE3-6 2-DIMENSIONAL (DIMENSION 2 AGAINST DIMENSION 3) PRESENTATION OF THE PSYCHOLOGICAL DISTANCE MODEL OF 15 UTTERANCES WITH 7% STRESS... 19
FIGURE3-7 SCREENSHOT OF THE EVALUATION PROGRAM IN EXPERIMENT 3... 24
FIGURE3-8 DIRECTION OF EACH OF 34 ADJECTIVES OF DIMENSION-1 AGAINST DIMENSION-2 . 26 FIGURE3-9 DIRECTION OF EACH OF 34 ADJECTIVES OF DIMENSION-1 AGAINST DIMENSION-3 . 26 FIGURE3-10 DIRECTION OF EACH OF 34 ADJECTIVES OF DIMENSION-2 AGAINST DIMENSION-327 FIGURE4-1 EXEMPLIFIED COMPARISON BETWEEN CLASSICAL SET AND FUZZYSET... 30
FIGURE4-2 SCHEMATIC DIAGRAM OF FIS... 31
FIGURE4-3 BUILDING STEPS OF THE MODEL... 34
FIGURE4-4 TWO PLOTS OF MONOTONOUS AGAINST NEUTRAL AND HOT ANGER... 39
FIGURE5-1 F0 CONTOUR AND ACCENTUAL PHRASES OF THE UTTERANCE /A TA RA SHI I KU RU MA O KA I MA SHI DA/. ITS INTENDED EMOTION WAS NEUTRAL. ... 44
FIGURE5-2 F0 CONTOUR AND ACCENTUAL PHRASES OF THE UTTERANCE /A TA RA SHI I KU RU MA O KA I MA SHI DA/ SPOKEN IN DIFFERENT INTENDED EMOTIONS. THE LEFT PLOT REPRESENTS NEUTRAL UTTERANCE AND THE RIGHT PLOT REPRESENTS JOY UTTERANCE... 44
FIGURE5-3 AVERAGE POWERSPECTRUM OF 10 NEUTRAL UTTERANCES... 51
FIGURE5-4 AVERAGE POWERSPECTRUM OF 10 JOY UTTERANCES... 51
FIGURE5-5 AVERAGE POWERSPECTRUM OF 10 SADNESSUTTERANCES... 51
FIGURE5-6 AVERAGE POWERSPECTRUM OF 10 COLD ANGER UTTERANCES... 51
FIGURE5-7 AVERAGE POWERSPECTRUM OF 10 HOT ANGER UTTERANCES... 51
FIGURE5-8 VARIANCE IN VOWEL POWER SPECTRUM IN TIMEDOMAIN... 53
FIGURE5-9 VOWEL POWER SPECTRUM IN TIMEDOMAIN OF 10 NEUTRAL UTTERANCES... 54
FIGURE5-10 VOWEL POWER SPECTRUM IN TIME DOMAIN OF 10 JOYUTTERANCES... 54
FIGURE5-11 VOWEL POWER SPECTRUM IN TIME DOMAIN OF 10 ANGERUTTERANCES... 54
FIGURE5-12 VOWEL POWER SPECTRUM IN TIME DOMAIN OF 10 SADNESS UTTERANCES... 54
FIGURE5-13 VOWEL POWER SPECTRUM IN TIME DOMAIN OF 10 HOTANGERUTTERANCES... 55
FIGURE5-14 TREND OF VOWEL POWERSPECTRUM OF 5 EMOTIONS... 55
FIGURE6-1CONCEPTUAL MODEL OF EMOTION NEUTRAL... 58
FIGURE6-2CONCEPTUAL MODEL OF EMOTION JOY... 58
LIST OF TABLES
TABLE2-1 SPECIFICATIONS OF VOICE DATA... 8
TABLE2-2 19 SENTENCES USED IN EXPERIMENT 1 ... 8
TABLE2-3 171 UTTERANCES USED IN EXPERIMENT1 ... 9
TABLE2-4 EQUIPMENT OF EXPERIMENT1 ... 9
TABLE3-1 DETAIL DESCRIPTIONS OF CORPUSES... 13
TABLE3-2 PSYCHOLOGICAL DISTANCE MATRIX OF 15 UTTERANCES... 16
TABLE3-3 34 ADJECTIVES CHOSEN FROM PER-EXPERIMENT... 22
TABLE3-4 15 PRIMITIVE FEATURES FOR THE PROPOSED PERCEPTUAL MODEL... 28
TABLE4-1 TRAINING ERROR FOR EACHSTEP... 36
TABLE4-2 CHECKINGERROR FOR EACH STEP... 37
TABLE4-3 SAMPLE OF INPUT DATA FOR EXAMINATION OF FIS... 38
TABLE4-4 RAW RESULTS OF THE FUZZY INFERENCE SYSTEMS... 40
TABLE5-1 CORRELATION COEFFICIENTS BETWEEN PRIMITIVE FEATURES AND ACOUSTIC FEATURES MEASURED FROM PITCH... 48
TABLE5-2 CORRELATION COEFFICIENTS BETWEEN PRIMITIVE FEATURES AND ACOUSTIC FEATURES MEASURED FROM POWER... 49
TABLE5-3 DETAILED DATA OF VARIANCE IN VOWEL POWERSPECTRUM IN TIMEDOMAIN... 53
Chapter 1 Introduction
This chapter describes the background and previous work of this thesis, and what gap this thesis would like to fill. It states the overall purpose and the tasks to perform.
Finally it gives the following contents of the thesis.
1.1 Background
Speech is one of the most convenient and important ways we humans use to communicate with each other. Apparently we do not use only linguistic meaning to convey our feeling but we also consciously or unconsciously inject our emotions into speech. When a listener perceives either consciously or unconsciously what emotions a speaker would like to convey, he1 then decides either consciously or unconsciously how to react to the speaker in a variety of ways. Such interactive paths establish our daily communication. Interpreting emotions from the linguistic form of speech, i.e., words, may be relatively straight-forward. It is generally thought there are relatively unique mappings between the linguistic word and its meaning(s).However, emotions that are injected into speech via not words per se, but changes in the acoustic properties of the speech, i.e., changes in intonation, pitch, duration, loudness, etc., are totally different.
There is not necessarily a straight-forward connection between these types of emotions injected into speech and the perception by listeners of these emotions.
We speak and perceive emotions from speech all the time in daily life.
However, the perception of emotions from speech is such a mysterious ability of a human that it is still difficult to give it satisfactory explanation. If there is a model that could explain and simulate the ability from an engineering approach, then the model could be applied to many applications to benefit the human community, for example, improvement of human-machine interface to create a “human interface” [1],
text-to-speech processing, or emotional morphing processing.
1.2 Previous Work
Concerning perception of emotional speech, two areas of previous research are reviewed here. One is with regard to emotions versus acoustic features. It has been studied most. The other is with regard to sound attributes versus acoustic features. It relates to perception in particular. The following section discusses some previous research of these two areas.
1.2.1 Emotions versus acoustic features
A number of studies attempted to identify and measure acoustic parameters in speech signals that reflect emotional states of speakers. For example, Williams and Stevens studied recordings of pilots speaking directly prior to a fatal crash (fear) or the classic Hindenburg radio announcement (anguish), and compared the simulated emotions of anger, fear, sorrow and “neutral” and the live recording of the Hindenburg crash broadcast. They found that different emotions had different effects on fundamental frequency (F0), which included its average value, the average pitch range, the characteristic shape of the contour, the rate of F0 change along the contour – and the speech rate [2][3]. Hiratate studied the relationship between two categories of anger, cold anger and hot anger, and acoustic features, which included the changing rate of F0 and power at the accent portions, and the duration of vowels in accent portions [4].For emotional speech synthesis, Cahn [5] considered speak model and perceptual model for representation of emotional state. He applied the relationship between emotions and acoustic features in terms of pitch, timing, and voice quality to build the perceptual model.
Their studies well reported either those certain acoustic features would possibly affect perception of emotion or that certain emotional speech has certain acoustic
features. Their approaches mainly concerned the direct relationship between emotions and acoustic features. However, even more acoustic features were found to be related to emotions, they all overlooked one important point. Human ability to percept emotions from speech was not directly based on acoustic features. From observations of
perception emotional speech, “his voice sounds dark” might lead to a judgment about
“he is sad”. Direct studying the relationship between these two factors still could not provide a complete and appropriate solution for solving emotional speech. Some other factor, the linguistic meaning to describe voice, in the middle between them was overlooked.
1.2.2 Sound attributes versus acoustic features
Regarding the perception of sound attributes, Ueda and Akagi [6] reported how amplitude envelope shapes, sound-pressure level, and duration affect perception
attributes, sharpness and brightness, and found a better definition of sharpness and brightness. Regarding to others perception of sound attributes, for example pitch and loudness, Zwicker have been reported a number of studies about the relationship between them and acoustic features [7]. Researches in this area well explained the relationship between the perception of sound attributes and the acoustic features. It was not specific to emotional speech, but it could help to bridge the gap of the current research, the middle factor between acoustic features and emotions.
1.2.3 Perception and Fuzzy logic
Most of studies that analyzed experimental results were by using statistics. Different from using statistical approach, Massaro proposed a fuzzy logical model of perception (FLMP) to solve vagueness of human nature because fuzzy logic provide a natural representation of the degree of match [8]. He showed how fuzzy logic model could be implemented in modeling perceptual system and how audible and visible sources are so naturally coordinated by the perceptual system. The study of this thesis was not focused on collaboration between audible and visible perception, and the idea still applied. To explain human nature in a “precise” and “rigorous” way, fuzzy logic corresponded to the needs.
1.3 Gap in the Research
According to previous research, apparently, using only the relationship between emotions and acoustics feature is not enough. Linguistic form to describe voice in the middle exists in human emotional perception. The studies of the relationship between emotions and linguistic form and the relationship between linguistic form and acoustic features are needed. The relations in these two relationships may be multiple and may be related to other aspects of knowledge. The vagueness of human nature should also be explained. Traditional mathematical model is insufficient. Fuzzy logic should be pulled in to make explanations sounds.
A model which explains and simulates human ability to perceive emotional speech from an engineering perspective but also covers fuzziness within human nature in the perceptional process is necessary.
1.4 Purpose and Tasks of the Current Research
accomplished, it could be applied to other practical applications, for example
text-to-speech processing or emotional morphing speech processing. For the purpose of this study, there are four tasks:
z To examine the voice data z To investigate primitive features z To build fuzzy inference systems z To analyze acoustic features
In the following sections, the perceptual model of emotional speech is introduced first.
Then the details of the tasks are described.
1.4.1 Multi-layered perceptual model of emotional speech
This thesis proposes a multi-layered perceptual model by which a human’s ability to perceive emotions from speech could be simulated. Differing from previous research, the multi-layered perceptual model involves with not only emotions and acoustic features, but also the original sound attributes, namely primitive features. By studying sound attributes that we human originally perceive from sound, it provides a useful way to understand the perception of emotions from speech and to be able to simulate it. One other character of the proposed model is it will deal with the relationships by using fuzzy logic, since many physical meanings of fuzzy logic are just corresponded to the property of perception, for example, it deals with the vagueness and linguistic form.
The conceptual model consists of three layers, emotion, primitive feature, and acoustic feature. It is illustrated in Figure 1-1. The emotion represents emotions in speech a listener perceives. There are 5 categories of emotion, Neutral, Joy, Cold Anger, Sad, and Hot Anger, which are studied in this thesis. The primitive feature contains a set of linguistic form of adjectives. The adjectives are used by listeners to describe
emotional speech which he listened to, for example, high, low, quiet etc. The acoustic feature concerns the measurable physical features in speech such as average power, highest pitch, vowel duration etc.
Figure 1-1 Conceptual Diagram of Multi-Layered Perceptual Model for Emotional Speech
The model is inspired by the observations of linguistic form of interpreting emotions from speech. When listening to a voice of a speaker, a receiver first senses
“the voice sounds dark” or “the voice sounds very blue”, and then we interpret “I think he is sad”. We never say “the voice sounds fundamental frequency is 400 Hz”. The observations indicate three points.
1. Primitive features are the intermediate relationship between emotions and acoustic features
2. Humans describe their perception of phenomenon with vague linguistic form but not precise value. The vagueness nature of humans should be considered.
3. Although human nature is vague, a precise analytical/mathematic approach to deal with the vagueness of humans is needed.
The first point results in the three-layered architecture of the model. The last two points result, results in the application of fuzzy logic. Linguistic form is vague, uncountable, and also it is related to human knowledge of communication. The characteristics of linguistic form are corresponded to the concepts of fuzzy logic. More detailed explanation of applying fuzzy logic is provided in Chapter 4.
1.4.2 How to construct?
To build the perceptual model, the top-down approach and the bottom-up approach should be adopted. The top-down approach is used to construct the framework of the proposed model. The framework contains the relationship between the emotion and the primitive feature, and the relationship between the primitive feature and the acoustic feature. After the framework is constructed, the bottom-up approach will be adopted to
Neutral Sadness Joy
Bright Heavy Strong
Pitch Power Duration
Acoustic Features Primitive Features Emotions
With regard to the top-down approach, firstly, the voice database in terms of emotions should be examined by perceptual experiments. Secondly, what adjectives should be taken as the members of the primitive feature should be investigated by conducting two perceptual experiments. Thirdly, fuzzy inference systems should be built to describe the relationship between the emotion and the primitive feature. Finally, how acoustic features affect each primitive features should be analyzed.
1.5 Organization of the Thesis
The remainder of this thesis is organized as the following.
Chapter 2, Experiment 1: Voice Data Examination, describes the details of a perceptual experiment. The experiment is used to examine each sentence in the voice data in terms of 5 emotions.
Chapter 3, Finding Primitive Features, presents the details of two perceptual experiments which are used to decide what adjectives are suitable to be the member of the primitive feature. One experiment is conducted for constructing a psychological distance model and the other is to rate adjectives.
Chapter 4, Fuzzy Inference System, describes construction of fuzzy inference systems. The reason why fuzzy logic is used to model the relationship between the emotion and the primitive feature is stated. The process of the construction of the fuzzy inference systems is presented.
Chapter 5, Acoustic Features Analysis, discusses the analysis of acoustic features.
Chapter 6, Conclusion, is the conclusion of this thesis. It summarizes what has been done, the significance of current research, and future work.
Appendix A, Supplement Data of Experiment Results, supplies supplement data results of experiments conducted in this thesis.
Chapter 2
Experiment 1: Voice Data Examination
In order to build the framework for the purposed perceptual model, first of all, the utterances in the voice database should be examined in terms of how the listeners rate their perception of the emotions. The rating results would be utilized in choosing the appropriate utterances concerning emotions in the subsequent experiments. This chapter describes details of the perceptual experiment that was carried out to examine the utterances in terms of 5 emotions. The purpose, the experiment setting, the experiment method, the results and their discussion are presented.
2.1 Purpose
The purpose of the experiment was to choose appropriate utterances from the voice database for further perceptual experiments.
2.2 Corpus, Subjects, and Equipments
2.2.1 Corpus
The corpuses used in the experiment were selected from a voice database produced by Fujitsu laboratories. There were 19 sentences. Each sentence was uttered in 5 emotions, which were Neutral, Joy, Cold Anger, Sadness, and Hot Anger. Neutral had one
utterance and others had two utterances for each. Thus each sentence was represented by nine utterances. A total of 171 utterances were used in the experiment and all of them were recorded by professional voice actresses in Japanese. The detailed information of the corpus is shown in Table 2-1, Table 2-2, and Table 2-3.
Table 2-1 Specifications of Voice Data
Item Value
Sampling frequency 22050 Hz Quantization 16bit
Sentences 19
Table 2-2 19 Sentences Used in Experiment 1
This table lists all sentences used in Experiment 1. First column shows the id numbers of the sentences. Second column shows the linguistic format of the sentences in Japanese. Id
14 was not in the database.
Id Sentence
1
新しいメールが届いています
2頭にくることなんてありません
3待ち合わせは青山らしいんです
4新しい車を買いました
5
いらないメールがあったら捨てて下さい
6そんなの古い迷信です。
7
みんなからエールが送られたんです。
8
手紙が届いたはずです。
9
ずっとみています。
10
私のところには届いています。
11
ありがとうございました
12申し訳ございません
13ありがとうは言いません
15気が遠くなりそうでした。
16
こちらの手違いもございました。
17
花火を見るのにゴザがいりますか。
18
もうしないと言ったじゃないですか。
19
時間通りに来ない訳を教えてください。
20
サービスエリアで合流しましょう。
Table 2-3 171 Utterances Used in Experiment 1
First column shows the utterances id numbers. Second column shows the intended emotions. The UID is composed of a letter and a numerical code. The letter represented what emotion it was (a: Neutral, b, c: Joy, d, e: Cold Anger, f, g: Sadness, h, i: Hot Anger) and the numerical code presented what sentence it was. a014, b014, c014, d014, e014, F014,
g014, h014, and i014 were not used.
UID Emotion
a001 ~ a020 Neutral b001 ~ b020
c001 ~ c020 Joy d001 ~ d020
e001 ~ e020 Cold Anger F001 ~ F020
g001 ~ g020 Sadness h001 ~ h020
i001 ~ i020 Hot Anger
2.2.2 Subjects
The subjects were 12 graduate students. Average age was 25 and the difference between maximum and minimum was 4. No one had had a hearing disease before. All were native Japanese speakers.
2.2.3 Equipments
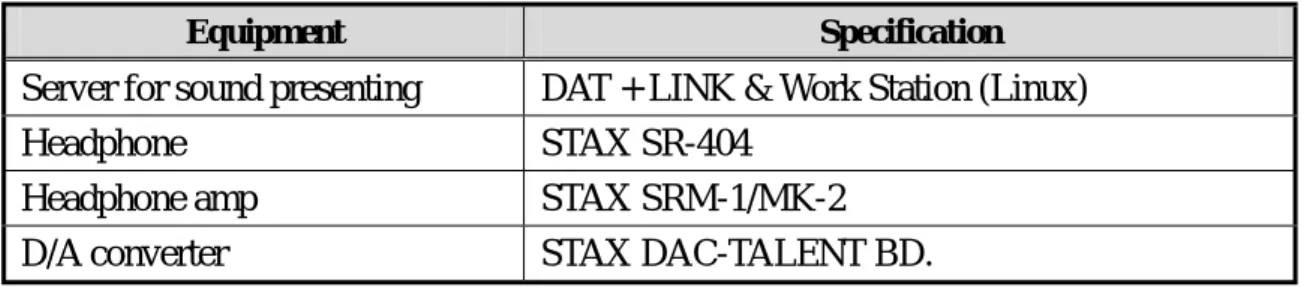
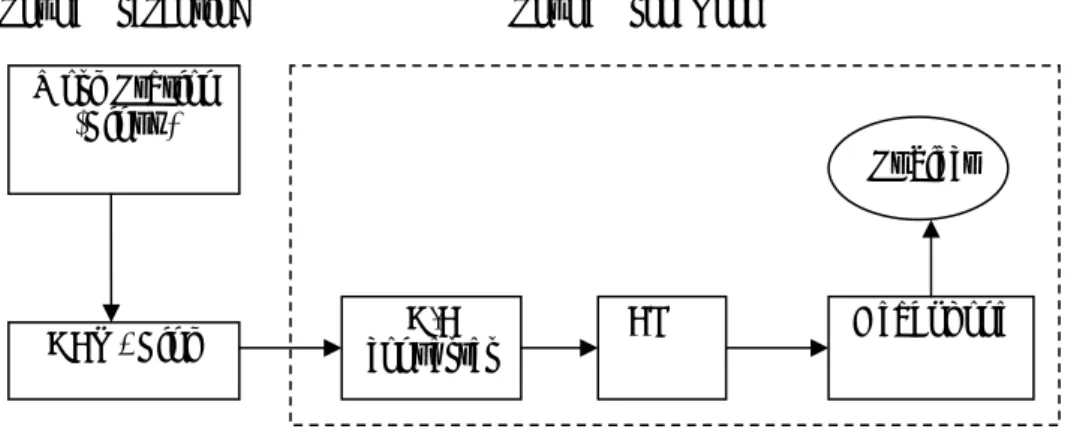
All experiments that were conducted in this thesis used identical equipment. One sound proof room was used. The detailed information of the other equipment was listed in Table 2-4, and, the configuration of the equipment was depicted in Figure 2-1.
Table 2-4 Equipment of Experiment 1
Equipment Specification
Server for sound presenting DAT + LINK & Work Station (Linux)
Headphone STAX SR-404
Headphone amp STAX SRM-1/MK-2
Figure 2-1 Configuration of the Equipment Used in All Experiments of this thesis
2.2.4 Method
The subjects were asked to rate 171 utterances in evaluation forms according to the perceived degree of 5 emotions. There was a total of 5 points for one utterance. That is, if a subject perceived that an utterance belonged to one emotion without any doubt then he gave it 5 points. Conversely, if a subject was confused within two or even more emotions then he divided 5 points into these emotions depending on the degree to which he perceived the utterance belonged to the emotions. Every utterance was presented 2 times with a pause of 2 sec. 9 utterances of one sentences was presented continuously but in a randomized order. One sample evaluation form for the sentences is shown in Figure 2-2.
Figure 2-2 One Sample Evaluation Form Used in Experiment 1 Sent ence 1
新しいメールが届いてい ます。
Sent ence 2 頭にくることなんてあり
ません。
sent ence 3 待ち合わせは青山らしい
んです。
1 10 19
N J C A S H A N J C A S H A N J C A S H A
2 11 20
N J C A S H A N J C A S H A N J C A S H A
…. (following parts are omitted for saving space) Work Station
(Linux)
DAT - Link D/A
converter AMP Headphone
Subject Sound Proof Room
Sound Presenting
2.3 Results
With regard to the rating results, the number of times each of the171 utterances was judged as containing one of the 5 emotions, Neutral (N), Joy (J), Cold Anger (CA), Sadness (S), and Hot Anger (HA) was count. The results are presented in Section A-1 (on page 62). In addition, rating percentages in terms of the intended emotions of N, J, CA, S, and HA are shown in Figure 2-3. As the results show, most of the utterances could be perceived according to the intended emotions with very high percentage. Cold Anger had the lowest percentage and it was confused with Neutral easily. However, the one most confused with Neutral is Joy. The rating result will be used when considering which utterance should be selected as corpus in the following experiments.
0%
20%
40%
60%
80%
100%
N 98% 12% 10% 5% 1%
J 0% 87% 0% 0% 0%
CA 2% 1% 86% 3% 1%
S 0% 0% 4% 92% 0%
HA 0% 0% 1% 0% 97%
N J CA S HA
Figure 2-3 Percentage of ratings of the 5 intended categories
The 5 rows were the 5 intended emotions and the 5 columns were the same 5 emotion rated by subjects.
Chapter 3
Primitive Features
Regarding the purposed perceptual model, each of the 171 utterances had been rated in terms of 5 emotions by the previous perceptual experiment. A key problem is the following. What should be the primitive features for the purposed perceptual model? In order to deal with this question, two experiments are conducted to choose suitable adjectives as the members of primitive features.
Chapter 3 gives the detailed descriptions of two experiments. The first
experiment is to construct a psychological distance model of 15 utterances by applying a multidimensional scaling technique. This experiment is carried out to help with selecting suitable adjectives as primitive features in the second experiment. The second experiment is to rate adjectives. According to rating results and directions of all
adjectives that are superimposed onto the psychological distance model, 15 adjectives are selected as suitable primitive features for the purposed perceptual model.
3.1 Experiment 2: Construction of Psychological Distance Modal
A psychological distance model was considered as a model that illustrated the similarity among stimuli. The 15 utterances chosen according to the results of the first experiment were used. By asking subjects to rate how similar pairs of the 15 utterances were, this experiment constructed a psychological distance model for these 15 utterances. The resultant psychological distance model represented the similarity among the utterances.
Moreover it also showed the positions of 5 emotions within it. The resultant model was primarily used to help with choosing suitable adjectives to be primitive features in the next experiment.
3.1.1 Purpose
The purpose of this experiment was to construct a psychological distance model of 15 utterances, with 3 utterances for each of 5 emotions. It was the first step for selection of suitable primitive features.
3.1.2 Corpus, subjects, and equipments Corpus
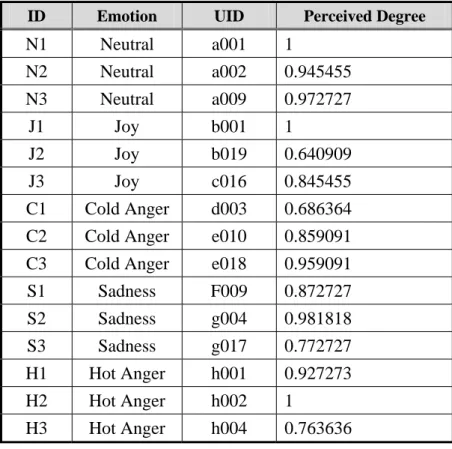
In the results of the first experiment, 171 utterances were rated according to the perceived degree of emotion for each of the 5 emotions. The utterance with a higher perceived degree of emotion was considered to be more typical for a certain emotion. In this experiment, 15 utterances were chosen from the 171 utterances as corpus. Detail descriptions of the corpuses are shown in Table 3-1.There were 3 utterances for each of the 5 emotions, the most typical utterance (Perceived Degree = 0.95 ~ 1), the middle typical utterance (Perceived Degree = 0.8 ~ 0.95), and the least typical utterance (N3, J2, C1, S3, and H3).
Table 3-1 Detail Descriptionsof Corpuses
First column represents id numbers. Second column represents emotions. Third column represents utterances id numbers. Forth column represents perceived degrees of 15
utterances used in Experiment 2.
ID Emotion UID Perceived Degree
N1 Neutral a001 1
N2 Neutral a002 0.945455
N3 Neutral a009 0.972727
J1 Joy b001 1
J2 Joy b019 0.640909
J3 Joy c016 0.845455
C1 Cold Anger d003 0.686364 C2 Cold Anger e010 0.859091 C3 Cold Anger e018 0.959091
S1 Sadness F009 0.872727
S2 Sadness g004 0.981818
S3 Sadness g017 0.772727
H1 Hot Anger h001 0.927273
H2 Hot Anger h002 1
H3 Hot Anger h004 0.763636
Subjects and equipments
The subjects and the equipment were identical to Experiment 1.
3.1.3 Method
The method of paired comparison was implemented in this experiment. Since there were 15 utterances in the experiment, taking each pair within the15 utterances as stimuli, there were a total of 15 x 14 = 210 pairs as stimuli. The subjects were asked to rate each utterance pair according to how similar they perceived the pair. There were 3 levels between the two extreme ends, totally similar and totally different, making a total of 5 levels. Before each utterance pair was presented to the subjects, a notification “bee”
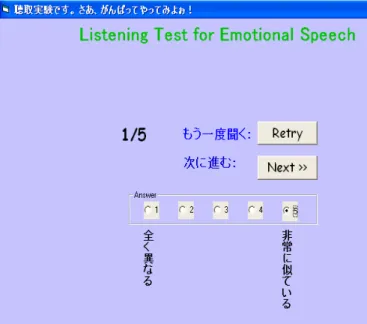
tone was presented. Each utterance pair was presented with a gap of 2 sec. The whole experiment was taken by an evaluation program written in Visual Basic 6.0 and a screenshot of the program is shown in Figure 3-1. As the screenshot shows, the subjects were allowed to listen to one utterance pair again by clicking the “Retry” button. The experiment was conducted 5 times.
Figure 3-1 Screenshot of the Evaluation Program in Experiment 2
The radio buttons were used by the subjects to evaluate one utterance pair. There were 5 levels including the two extreme ends. The “Retry” button was used by the subjects to listen to one utterance pair again. The “Next” button was used to move to next utterance
pair.
3.1.4 Data analysis and results
This experiment evaluated the similarity among 15 utterances. A number of studies have
reported that the perceptual space is multidimensional [9][10][11][12][13]. Since there is a possibility that the perception of similarity had multidimensional characteristics, the experimental results were mainly analyzed by multidimensional scaling techniques (MDS) [14][15]. A statistical application, SPSS 11.0J for Windows was used and Kruskal’s method was applied [16]. It was convenient that MDS could provide a visual presentation of the model of similarities among these 15 utterances. Finally, the result was a psychological distance model which described the similarities among the utterances.
To build the psychological distance model according to the rating results, there were two steps.
Firstly, a psychological distance matrix for 15 sentences was formed according to the rating results. The psychological distance matrix was a
dissimilarity matrix as shown in Table 3-2. In this matrix, the number represented the distance between two utterances. In other words, a larger number indicated a longer distance between two utterances, i.e. less similarity between them.
Conversely, a smaller number indicated a shorter distance between two utterances, i.e. more similarity between them.
Secondly, the psychological distance matrix calculated in the first step was analyzed by MDS in SASS which resulted in the psychological distance model.
Table 3-2 Psychological Distance Matrix of 15 Utterances
In the matrix, larger numbers indicate less similarity between two utterances. Conversely, smaller numbers indicate more similarity.
N1 N2 N3 J1 J2 J3 C1 C2 C3 S1 S2 S3 H1 H2
H 3
N1 0
N2 1.05 0 N3 1.12 1.02 0 J1 4.25 4.2 4.27 0 J2 2.79 2.73 3.05 1.98 0 J3 4.4 4.41 4.43 1.19 2.23 0 C1 4.18 3.94 4.15 4.83 4.68 4.94 0 C2 4.36 4.33 4.37 4.96 4.68 4.9 1.83 0 C3 4.33 4.27 4.1 4.95 4.77 4.92 1.39 1.11 0 S1 4.35 4.18 4.4 4.96 4.76 4.93 4.11 3.53 3.78 0 S2 4.41 4.43 4.44 4.87 4.55 4.78 4.41 4.04 3.99 2.01 0 S3 4.22 4.27 4.4 4.65 4.47 4.63 4.62 4.33 4.16 2.53 1.42 0 H1 4.37 4.43 4.5 4.73 4.8 4.84 3.01 3.18 3.38 4.86 4.82 4.93 0 H2 4.74 4.7 4.64 4.83 4.85 4.76 3.23 3.52 3.38 4.92 4.89 4.94 1.08 0 H3 4.58 4.47 4.63 4.65 4.77 4.76 3.26 3.51 3.41 4.92 4.93 4.97 1.17 1.11 0
By MDS, as implied by the name of the analysis technique, data results could be represented by multi-dimensions. For MDS, orientation and how many dimensions used to specify the resultant distant model should be considered. Following are discussions about it.
First, orientation of presentation was arbitrary within MDS. The most important set of information was the distance among instances (i.e. utterances) that indicates similarity between them.
Second, concerning how many dimensions should be used to specify the resultant distant model, the stress measure was the most common measure, that was used to evaluate how well (or poorly) the model reproduced the distance matrix. In other words, the stress value represented appropriate dimensions. The smaller the stress value, the more appropriate it was to reproduce the distance model to the distance matrix [15].
According to the above discussions, in order to decide how many dimensions
would be appropriate to use to present the resultant distance model, three criteria were taken into account:
1. Stress should be less then 10%
2. The dimension should be stable
3. Its presentation should be easy to comprehend
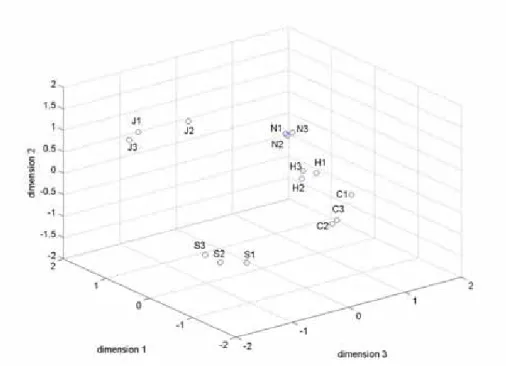
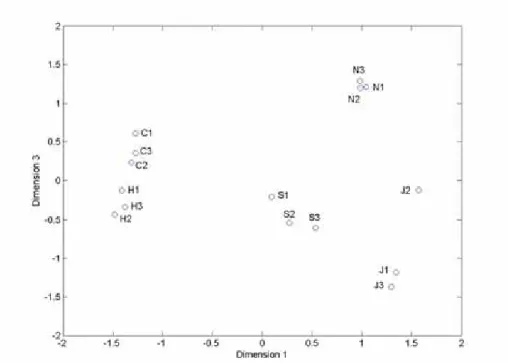
The results, the stress value against presenting dimension, are shown in Figure 3-2. Accordingly, 3-dimension with stress equal to 7 % was chosen to present the psychological distance model. The resultant psychological distance model is shown in Figure 3-3. Moreover, in order to look into information within 3-dimension, the 3-dimension model was illustrated by showing dimension 1 against dimension 2 in Figure 3-4, dimension 1 against dimension 3 in Figure 3-5, and dimension 2 against dimension 3 in Figure 3-6.
% J NF O T J P O
4USFTT
Figure 3-2 Stress by Dimension
Figure 3-3 3-Dimensional Presentation of the Psychological Distance Model of 15 Utterances with 7% Stress
Figure 3-4 2-Dimensional (Dimension 1 against Dimension 2) Presentation of the Psychological Distance Model of 15 Utterances with 7% Stress
Figure 3-5 2-Dimensional (Dimension 1 against Dimension 3) Presentation of the Psychological Distance Model of 15 Utterances with 7% Stress
3.1.5 Discussion
A qualified psychological distance model could tell the similarity among instances correctly. That is, if two instances were very similar then they should be very close to each other. Conversely, if two objectives were very different then they should be a far distance from each other. The following discussions describe whether the resultant psychological distance model was qualified to describe the similarity among these 15 utterances.
By observing profiles shown in Figure 3-3, Figure 3-4, Figure 3-5, and Figure 3-6, it could be noticed that those sentences which had the same intended emotion clustered together. The details of each emotion are discussed below.
About Neutral (N1, N2, and N3), they clustered together in every profile. A similar phenomenon was also shown within Hot Anger (H1, H2, and H3). Such phenomenon could be explained in that Neutral and Hot Anger had a higher degree of perceptibility by listeners than the other emotions. That meant they were easier to be perceived by listeners.
About Joy (J1, J2, and J3), from Figure 3-5and Figure 3-6, it was noticed that J1 and J3 clustered together but J2 kept a slight distance from J1 and J3.
Similarly, regarding Cold Anger, (C1, C2, and C3), C1 was somewhat distant from C2 and C3. In fact, it could be explained by comparing the degree of perceptibility by listeners of 3 utterances of Joy and Cold Anger in Table 3-1. It showed that J2 was the least typical sentence for Joy and C1 was also the least typical sentence for Cold Anger. The degree of perceptibility of both J2 and C1 was rather low
compared to the other 2 utterances, in other words, J2 was not “so-Joy” and C1 was not “so-Cold Anger”. That was why J2 and C1 were not clustered with the other 2 more typical sentences.
About Sad (S1, S2, and S3), the distances among each sentence were bigger than that for the other emotions. It could be explained that it was because those sentences of Sad had lower degree of perceptibility by listeners than other emotions. In other words, Sad was more difficult to be perceived.
According to the discussions above, the psychological distance model was considered to be reasonable and qualified. In the next experiment, it will be applied to help find suitable primitive features.
3.2 Experiment 3: Rating Adjectives
Before performing Experiment 3, a pre-experiment was conducted and 34 adjectives were chosen from 60 adjectives. Then, in this experiment, the subjects were asked to rate the 34 adjectives. According to the combination of the rating results and how each
of the 34 adjectives were related to a certain emotion, depending on what direction an adjective was superimposed onto the psychological distance model, 15 adjectives were selected from the 5 emotions to be the members of the primitive features for the
proposed perceptual model.
3.2.1 The purpose
The purpose of the experiment was to give each of 34 adjectives a rating in terms of how much appropriately it described each of the 15 utterances. It was the second step for selection of suitable primitive features.
3.2.2 A pre-experiment for choosing 34 adjectives from 60 adjectives
The purpose of the pre-experiment was to narrow down adjectives for Experiment 3. As mentioned in Chapter 1, the primitive features used in this thesis were actually
adjectives that were suitable to describe emotional speech. Ueda proposed 50 adjectives that were considered most often used to describe tone and sound [17].The 50 adjectives were selected from 114 adjectives according to his previous research. There were so many adjective that could be possibly used to describe sound, tone, or voice. However, for this study what was needed should be those related to emotional speech. In order to remove unnecessary adjectives, it is necessary conduct a pre-experiment.
A total of 60 adjectives were chosen as candidates in the pre-experiment.
Except the 50 adjectives proposed by Ueda, an extra 10 adjectives that were considered relevant to emotional speech were also added into.
The subjects listened to each of utterances and were asked to circle which adjective is appropriate to describe the utterances. As listed in Table 3-3,34 adjectives that were relatively more frequently circled are chosen as the candidates for Experiment 3.
Table 3-3 34 Adjectives Chosen from Per-Experiment ID Adjective (Japanese) Adjective (English)
1 明るい bright
2 暗い dark
3 声の高い high
4 声の低い low
5 強い strong
6 弱い weak
7 太い thick
8 細い thin
9 堅い hard
10 柔らかい soft
11 重い heavy
12 軽い light
13 鋭い sharp
14 鈍い dull
15 耳障りな rough
16 流暢な fluent
17 荒っぽい violent
18 滑らかな smooth
19 うるさい noisy
20 静かな quiet
21 ざわついた noisy
22 落ち着いた calm
23 落ち着きのない unstable
24 きれいな clean
25 汚い dirty
26 濁った muddy
27 明らかな clear
28 あいまいな vague
29 明瞭な plain
30 かすれた husky
31 抑揚のある well-modulated
32 単調な monotonous
33 早い quick
34 ゆっくり slow
3.2.3 Corpus, subjects, and equipments
The corpus, the subjects, and the equipments were the same as the previous experiments.
3.2.4 Method
The subjects were asked to rate each of 34 adjectives in terms of how appropriate the adjectives described the utterances they heard. It was a 4 point scale from 0 to 3, where
“0” indicated that the adjective was inappropriate and “3”, the adjective was appropriate.
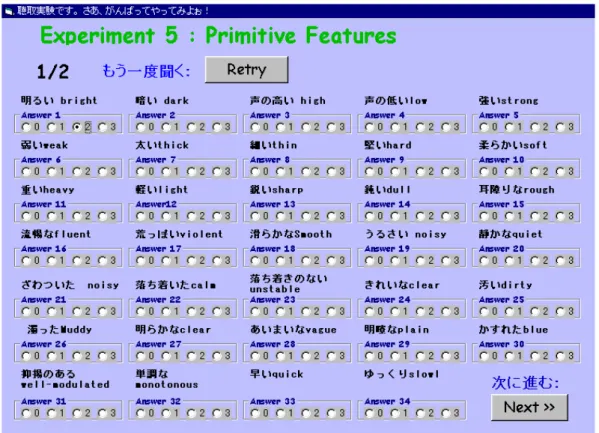
The experiment was a one-side test. The experiment was taken by a program written in Visual Basic 6.0 and a screenshot of the program is shown in Figure 3-7. As the
screenshot shows, the subjects were allowed to listen to one utterance again by clicking the “Retry” button. The experiment was conducted twice.
Figure 3-7 Screenshot of the Evaluation Program in Experiment 3
The radio buttons were used by the subjects to evaluate the adjectives. For each adjective, there were 4 levels covering two extreme ends. “Retry” button was used by the subjects to
listen to one utterance again. “Next” button was used to move to next utterance.
3.2.5 Data analysis and Results
Section A-2 (on page 68) listed the rating results of 34 adjectives for each of the 15 utterances. In order to see how each adjective was related to emotional speech, 34 adjectives were superimposed onto the psychological distance model by multiple regression analysis. (3-1) was the regress equation.
3 3 2 2 1
1x a x a x
a
y (3-1)
, wherex1,x2, and x3 were position (x1,x2,x3) of one utterance in the
psychological distance model, and ywas the rating of an adjective against the utterance.
Calculating regression coefficients a1, a2, and a3, by performing a least squares fit, Figure 3-8, Figure 3-9, and Figure 3-10 present the 34 adjectives plotted within
dimension-1 against dimension-2, dimension-1 against dimension-3, and dimension-2 against dimension-3, respectively, of the psychological distance model. A line in the plot indicates an adjective by marking its id number (id numbers are shown in Table 3-3).
The pointed direction of the arrow head of each line indicated that the adjective was
increasingly related to the utterances. For example, the adjective “clean” (ID: 24) was more related to the utterance J2 than to the utterance C2. In the other words, the adjective “clean” was more related to Joy than to Cold Anger. In this way, it was possible to find which each adjective was related to which emotion. In addition, the multiple correlation coefficient of each adjective was calculated. According to
1. The direction of each adjective in the psychological distance model, and 2. The multiple correlation coefficient of each adjective,
15 adjectives listed in Table 3-4 are chosen as suitable primitive feature from 34 adjectives.
The detailed data of regression coefficients a1, a2, a3, and multiple correlation coefficient of each adjective were listed in Section A-3 (on page 70).
Figure 3-8 Direction of Each of 34 Adjectives of Dimension-1 against Dimension-2 The figure was plotted with arrow head lines in dimension-1 against dimension-2 of the
psychological distance model.
Figure 3-9 Direction of Each of 34 Adjectives of Dimension-1 against Dimension-3 The figure was plotted with arrow head lines in dimension-1 against dimension-3 of the
psychological distance model.
Figure 3-10 Direction of Each of 34 Adjectives of Dimension-2 against Dimension-3 The figure was plotted with arrow head lines in dimension-2 against dimension-3 of the
psychological distance model.
Table 3-4 15 Primitive Features for the Proposed Perceptual Model They were chosen from 34 adjectives in Table 3-3 according to multiple correlation
coefficients and the direction in the psychological distance model.
ID Adjective (Japanese) Adjective (English)
PF1
明るい
brightPF2
暗い
darkPF3
声の高い
highPF4
声の低い
lowPF5
強い
strongPF6
弱い
weakPF7
落ち着いた
calm PF8落ち着きのない
unstablePF9
抑揚のある
well-modulated PF10単調な
monotonousPF11
重い
heavyPF12
明らかな
clear PF13うるさい
noisyPF14
静かな
quietPF15
鋭い
sharpChapter 4
Fuzzy Inference System
Thus far, regarding the three-layered proposed perceptual model, the emotion and the primitive feature are investigated. The following task is to build fuzzy inference systems by which the relationship between the emotion and the primitive feature is established.
A fuzzy inference system is the process of formulating the mapping from a given input to an output based on the concepts of fuzzy logic, i.e. fuzzy set theory
Chapter 4 gives explanations of fuzzy logic, how it can deal with fuzziness, why a fuzzy inference system is used to build the relationship, and finally describes how a fuzzy inference system of the perceptual model is built.
4.1 What is FIS?
Fuzzy logic was fist proposed by L.A. Zadeh in 1965. He developed the concept of linguistic variables, or fuzzy set in a 1973 paper. The human brain interpreted imprecise and incomplete sensory information provided by perceptive organs. Fuzzy logic
provided a systematic calculus to deal with such information linguistically, and it performed numerical computation by using linguistic labels stipulated by membership functions. Moreover, a set of fuzzy IF-THEN rules formed the key component of a fuzzy inference system that could effectively model human expertise in a specific application [18].
Three relevant concepts within fuzzy logic were:
1. Fuzzy set, i.e. linguistic variables were defined as variables whose values were words or sentences.
2. Membership function mapped each element in a fuzzy set to a membership degree between 0 and 1.
3. IF-THEN rules, comprising the input (antecedent) and the output (consequent), were propositions containing linguistic variables.